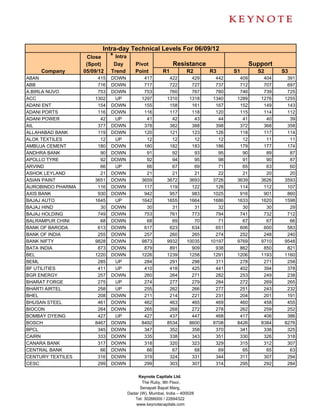
1. Intra-day Technical Levels For 06/09/12
Close * Intra
(Spot) Day Pivot Resistance Support
Company 05/09/12 Trend Point R1 R2 R3 S1 S2 S3
ABAN 415 DOWN 417 422 429 442 409 404 391
ABB 716 DOWN 717 722 727 737 712 707 697
A.BIRLA NUVO 753 DOWN 753 760 767 780 746 739 725
ACC 1302 UP 1297 1310 1318 1340 1289 1276 1255
ADANI ENT 154 DOWN 155 158 161 167 152 149 143
ADANI PORTS 116 DOWN 116 117 118 120 115 114 112
ADANI POWER 42 UP 41 42 43 44 41 40 39
AIL 377 DOWN 378 382 388 398 372 368 358
ALLAHABAD BANK 119 DOWN 120 121 123 126 118 117 114
ALOK TEXTILES 12 UP 12 12 12 12 12 11 11
AMBUJA CEMENT 180 DOWN 180 182 183 186 179 177 174
ANDHRA BANK 90 DOWN 91 92 93 95 90 89 87
APOLLO TYRE 92 DOWN 92 94 95 98 91 90 87
ARVIND 66 UP 66 67 69 71 65 63 60
ASHOK LEYLAND 21 DOWN 21 21 21 22 21 20 20
ASIAN PAINT 3651 DOWN 3659 3672 3693 3726 3639 3626 3593
AUROBINDO PHARMA 116 DOWN 117 119 122 128 114 112 107
AXIS BANK 930 DOWN 942 957 983 1025 916 901 860
BAJAJ AUTO 1645 UP 1642 1655 1664 1686 1633 1620 1598
BAJAJ HIND 30 DOWN 30 31 31 32 30 30 29
BAJAJ HOLDING 749 DOWN 753 761 773 794 741 732 712
BALRAMPUR CHINI 68 DOWN 68 69 70 71 67 67 66
BANK OF BARODA 613 DOWN 617 623 634 651 606 600 583
BANK OF INDIA 255 DOWN 257 260 265 274 252 248 240
BANK NIFTY 9828 DOWN 9873 9932 10035 10197 9769 9710 9548
BATA INDIA 873 DOWN 879 891 909 938 862 850 821
BEL 1220 DOWN 1226 1239 1258 1291 1206 1193 1160
BEML 285 UP 284 291 298 311 278 271 258
BF UTILITIES 411 UP 410 418 425 441 402 394 378
BGR ENERGY 257 DOWN 260 264 271 282 253 249 238
BHARAT FORGE 275 UP 274 277 279 284 272 269 265
BHARTI AIRTEL 258 UP 255 262 266 277 251 243 232
BHEL 208 DOWN 211 214 221 231 204 201 191
BHUSAN STEEL 461 DOWN 462 463 465 469 460 458 455
BIOCON 264 DOWN 265 268 272 278 262 259 252
BOMBAY DYEING 427 UP 427 437 447 468 417 406 386
BOSCH 8467 DOWN 8492 8534 8600 8708 8426 8384 8276
BPCL 345 DOWN 347 352 358 370 341 336 325
CAIRN 333 DOWN 335 338 343 351 330 326 318
CANARA BANK 317 DOWN 318 320 323 329 315 312 307
CENTRAL BANK 66 DOWN 66 67 68 69 65 65 63
CENTURY TEXTILES 316 DOWN 319 324 331 344 311 307 294
CESC 299 DOWN 299 303 307 314 295 292 284
Keynote Capitals Ltd.
The Ruby, 9th Floor,
Senapati Bapat Marg,
Dadar (W), Mumbai, India – 400028
Tel: 30266000 / 22694322
www.keynotecapitals.com
2. Intra-day Technical Levels For 06/09/12
Close * Intra
(Spot) Day Pivot Resistance Support
Company 05/09/12 Trend Point R1 R2 R3 S1 S2 S3
CHAMBL FERT. 68 DOWN 68 69 69 71 67 66 65
CIPLA 374 DOWN 376 380 386 396 370 366 356
CNX INFRA 2232 DOWN 2237 2247 2262 2287 2222 2212 2187
CNX IT 6084 UP 6075 6119 6153 6232 6040 5997 5919
CNX PSE 2836 DOWN 2840 2854 2872 2903 2822 2809 2777
COAL INDIA 359 UP 359 362 365 371 356 352 346
COLGATE 1220 DOWN 1222 1229 1239 1256 1213 1205 1189
CORE EDUTEC. 299 DOWN 299 302 304 309 297 294 290
CROMPTON GREAVES 107 UP 107 110 113 120 103 100 93
CUMMINS INDIA 447 DOWN 451 457 468 485 441 435 418
DABUR 128 DOWN 128 129 130 132 127 126 124
DCB 40 DOWN 41 41 41 42 40 40 39
DELTA CORP. 59 DOWN 59 60 61 63 58 57 55
DENA BANK 86 DOWN 87 88 90 92 85 84 81
DISH TV 70 UP 70 71 72 75 69 68 66
DIVIS LAB 1121 UP 1115 1141 1162 1208 1095 1069 1022
DJIA 13036 UP 13035 13093 13150 13266 12978 12920 12805
DLF 193 DOWN 194 196 199 203 191 189 184
DR. REDDYS 1676 UP 1674 1693 1709 1745 1657 1638 1602
EDUCOMP 149 DOWN 149 152 155 161 146 143 137
ESCORTS 62 DOWN 63 63 65 67 61 60 58
ESSAR OIL 49 UP 48 49 50 52 48 47 45
EXIDE INDS. 143 DOWN 144 145 148 152 141 140 136
FEDERAL BANK 401 DOWN 403 406 411 420 398 395 387
FINANCIAL TECH. 827 DOWN 834 844 861 889 817 806 779
FORTIS 94 UP 94 94 95 96 93 93 92
GAIL 356 DOWN 357 362 367 377 351 347 337
GE SHIPPING 247 UP 246 250 252 258 244 240 235
GLAXO 2100 DOWN 2102 2119 2137 2172 2083 2067 2031
GMDC 186 DOWN 186 188 190 193 185 183 180
GMR INFRA 20 UP 19 20 20 21 19 18 17
GODREJIND 249 UP 247 252 255 262 245 240 233
GRASIM 2927 DOWN 2933 2958 2989 3044 2902 2877 2821
GSPL 78 DOWN 78 79 80 81 78 77 76
GUJ. FLOUROCHEM 362 UP 361 365 368 374 358 355 348
GVK POWER 11 DOWN 11 11 11 12 11 11 10
HAVELLS 555 DOWN 557 564 573 589 548 542 526
HCC 16 UP 16 16 16 17 15 15 15
HCL TECH. 562 UP 561 568 573 586 555 548 536
HDFC 725 DOWN 725 730 735 745 720 715 705
HDFC BANK 592 UP 592 596 600 609 588 583 575
HDIL 70 DOWN 70 71 73 75 69 68 66
HERO MOTOCORP 1808 UP 1804 1819 1829 1854 1794 1779 1754
Keynote Capitals Ltd.
The Ruby, 9th Floor,
Senapati Bapat Marg,
Dadar (W), Mumbai, India – 400028
Tel: 30266000 / 22694322
www.keynotecapitals.com
3. Intra-day Technical Levels For 06/09/12
Close * Intra
(Spot) Day Pivot Resistance Support
Company 05/09/12 Trend Point R1 R2 R3 S1 S2 S3
HEXAWARE 125 DOWN 125 126 128 131 124 123 120
HINDALCO 101 DOWN 102 104 106 111 99 97 93
HIND.OIL. EXP 115 DOWN 115 117 119 123 113 111 107
HIND PETRO 304 UP 304 306 309 315 301 298 293
HIND UNILEVER 531 UP 527 536 542 556 522 513 498
HIND ZINC 126 DOWN 132 139 153 174 118 111 90
HOTEL LEELA 28 DOWN 28 28 29 30 27 27 25
ICICI BANK 880 DOWN 889 900 921 954 868 856 823
IDBI 87 UP 86 87 88 90 86 85 83
IDEA 77 UP 77 78 79 82 76 74 72
IDFC 126 DOWN 127 128 131 134 125 123 119
IFCI 25 UP 25 26 26 27 25 24 23
IGL 241 DOWN 241 243 244 248 240 238 235
INDIAN HOTELS 59 DOWN 59 59 60 61 58 58 57
INDIA CEMENTS 81 DOWN 82 83 85 89 79 78 74
INDIA INFOLINE 53 DOWN 53 54 55 57 52 51 49
INDIAN BANK 156 DOWN 164 172 189 214 148 139 114
INDUSIND BANK 313 DOWN 313 316 319 324 310 308 302
INFOSYS TECH. 2339 DOWN 2343 2354 2368 2392 2329 2318 2293
IOB 67 DOWN 67 68 68 70 66 65 64
IOC 246 UP 244 249 253 261 241 236 227
IRB 126 UP 126 129 131 135 124 122 118
ITC 268 UP 268 269 271 274 266 264 261
IVRCL INFRA 39 UP 39 40 41 43 38 37 36
JET AIRWAYS 330 DOWN 334 339 349 364 324 319 304
JINDAL SAW 115 DOWN 116 116 117 119 115 114 113
JINDAL STEEL 336 DOWN 340 348 360 380 328 319 299
JISLJALEQS 62 DOWN 63 65 68 73 60 58 53
JP ASSOCIATES 64 DOWN 64 65 66 68 63 63 61
JP POWER 27 UP 26 27 27 29 26 25 24
JSW ENERGY 46 DOWN 46 47 48 50 45 44 42
JSW ISPAT 9 DOWN 9 9 9 10 9 9 8
JSW STEEL 655 DOWN 660 668 681 703 647 638 617
JUBILANT FOOD 1226 DOWN 1230 1242 1258 1286 1214 1202 1174
KOTAK BANK 569 UP 568 573 577 586 564 559 550
KTK. BANK 82 DOWN 83 83 84 85 82 81 80
LIC HSG. FIN. 238 DOWN 239 241 245 250 236 234 229
LITL 11 DOWN 11 11 11 11 11 11 11
L&T 1324 DOWN 1333 1345 1366 1400 1312 1299 1266
LUPIN 586 DOWN 589 595 603 618 580 575 561
M&M 755 UP 755 763 770 785 747 740 725
MARUTI 1175 UP 1172 1182 1189 1206 1165 1155 1138
MAX 181 UP 181 183 185 189 179 177 173
Keynote Capitals Ltd.
The Ruby, 9th Floor,
Senapati Bapat Marg,
Dadar (W), Mumbai, India – 400028
Tel: 30266000 / 22694322
www.keynotecapitals.com
4. Intra-day Technical Levels For 06/09/12
Close * Intra
(Spot) Day Pivot Resistance Support
Company 05/09/12 Trend Point R1 R2 R3 S1 S2 S3
MCDOWELL-N 1014 UP 1008 1026 1037 1066 997 979 950
MCLEOD RUSSEL 326 UP 325 330 334 342 321 316 307
MPHASIS 382 UP 382 389 395 409 375 368 355
MRF 10041 DOWN 10084 10153 10265 10446 9972 9903 9722
MRPL 61 UP 61 62 63 64 60 59 58
MTNL 38 DOWN 38 38 39 40 37 37 35
NCC 33 DOWN 33 33 34 35 32 32 31
NIFTY MCAP50 1990 DOWN 1994 2002 2014 2033 1983 1975 1956
NHPC 18 DOWN 18 18 18 18 18 17 17
NIFTY 5226 DOWN 5234 5252 5277 5321 5208 5190 5146
NMDC 182 DOWN 184 187 192 199 179 177 169
NTPC 169 UP 168 170 171 174 167 166 163
OFSS 2901 DOWN 2906 2997 3093 3279 2810 2720 2534
OIL 482 DOWN 483 489 496 510 476 469 456
ONGC 273 UP 272 276 279 286 269 266 259
ON MOBILE 35 UP 35 35 35 36 34 34 33
OPTO CIRCUITS 125 DOWN 126 127 130 135 123 121 116
ORCHID CHEM 109 DOWN 110 111 113 116 108 107 104
ORIENTAL BANK 218 DOWN 220 222 226 233 216 213 207
PANTALOON RETAIL 139 UP 138 141 143 148 136 133 128
PATEL ENGG. 64 DOWN 65 65 66 67 64 63 62
PETRONET 158 DOWN 158 160 162 166 156 154 150
PFC 156 DOWN 157 159 162 166 154 153 148
PIRAMAL HEALTH 471 UP 471 476 481 492 466 460 450
PNB 669 DOWN 670 674 680 689 665 661 652
POLARIS 119 DOWN 120 122 125 129 117 116 111
POWER GRID 123 DOWN 123 124 125 128 122 121 119
PRAJ IND 44 DOWN 44 45 46 47 43 43 41
PTC 55 DOWN 55 56 57 59 54 54 52
PUNJ LLOYD 44 DOWN 45 45 47 48 44 43 41
RANBAXY 553 DOWN 557 565 577 597 545 537 517
RAYMOND 345 DOWN 345 349 353 361 341 337 328
REL. COM. 49 DOWN 50 50 51 53 49 48 46
REC 182 DOWN 185 189 196 206 178 175 164
REL. CAPITAL 330 DOWN 331 334 339 346 327 323 316
RELIANCE 771 DOWN 772 779 788 803 764 756 740
REL. INFRA 445 UP 443 452 458 473 437 428 414
RENUKA SUGAR 32 DOWN 32 32 33 34 31 31 30
ROLTA 65 DOWN 66 67 69 71 64 63 60
REL. POWER 78 DOWN 78 79 80 82 77 76 75
RUCHI SOYA 83 DOWN 83 84 84 85 83 82 81
S&P 500 1405 UP 1404 1411 1416 1429 1398 1391 1378
SAIL 76 DOWN 76 77 78 79 76 75 74
Keynote Capitals Ltd.
The Ruby, 9th Floor,
Senapati Bapat Marg,
Dadar (W), Mumbai, India – 400028
Tel: 30266000 / 22694322
www.keynotecapitals.com
5. Intra-day Technical Levels For 06/09/12
Close * Intra
(Spot) Day Pivot Resistance Support
Company 05/09/12 Trend Point R1 R2 R3 S1 S2 S3
SBI 1830 DOWN 1841 1856 1881 1921 1816 1802 1762
SCI 50 UP 49 51 52 54 48 47 44
SESA GOA 164 DOWN 165 167 171 176 162 160 155
SIEMENS 665 DOWN 667 674 684 701 657 650 632
SINTEX 55 DOWN 56 57 58 61 54 54 51
SKUMAR SYNF 18 DOWN 18 18 19 20 17 17 16
SOBHA 334 UP 332 338 342 353 328 321 311
SOUTH INDIAN BANK 22 DOWN 22 22 22 23 21 21 21
SRE INFRA 23 DOWN 23 23 24 24 23 22 22
SRIRAM TRANS. FIN. 628 UP 626 633 638 650 621 615 603
STERLITE 93 DOWN 94 95 96 99 92 91 88
STR TECH. 28 DOWN 28 28 29 29 28 28 27
SUN PHARMA 650 DOWN 652 658 666 681 644 638 623
SUN TV 298 UP 297 300 302 307 294 291 286
SUZLON 15 DOWN 15 15 15 16 15 15 15
SYNDICATE BANK 94 DOWN 95 97 99 103 93 91 87
TATA CHEM 311 UP 309 314 317 325 306 301 293
TATA COFFEE 964 DOWN 966 972 981 995 958 951 936
TATA COMM 225 DOWN 227 230 235 244 222 219 211
TATA GLOBAL 134 UP 133 135 137 141 131 129 125
TATA MOTORS 229 DOWN 231 233 238 246 226 223 215
TATA MOTORS DVR 136 DOWN 137 138 140 143 135 134 130
TATA POWER 95 DOWN 95 96 98 100 94 93 90
TATA STEEL 350 DOWN 353 358 367 380 345 340 327
TCS 1365 UP 1356 1380 1395 1434 1341 1317 1278
TECH M 832 UP 829 842 853 877 818 805 781
TITAN 223 DOWN 223 225 228 233 221 219 214
TTK PRESTIGE 3341 DOWN 3345 3389 3437 3528 3297 3253 3161
TTML 11 DOWN 11 11 12 12 11 10 10
TVS MOTOR 38 DOWN 38 38 39 40 37 36 35
UCO BANK 64 DOWN 64 65 66 67 63 63 61
ULTRA CEMCO 1675 UP 1671 1696 1717 1763 1650 1625 1578
UNION BANK 158 UP 157 159 160 162 156 155 153
UNITED PHOS. 120 DOWN 121 123 125 128 119 118 114
UNITECH 19 UP 18 19 19 19 18 18 18
VIDEOCON INDS. 174 DOWN 174 176 178 181 172 170 167
VIJAYA BANK 47 DOWN 47 47 48 49 47 46 45
VIP INDS. 76 DOWN 76 77 78 80 74 73 71
VOLTAS 107 DOWN 108 109 112 116 105 104 99
WELCORP 96 UP 96 99 101 106 93 91 86
WIPRO 362 UP 361 365 368 374 359 355 349
Keynote Capitals Ltd.
The Ruby, 9th Floor,
Senapati Bapat Marg,
Dadar (W), Mumbai, India – 400028
Tel: 30266000 / 22694322
www.keynotecapitals.com
6. Intra-day Technical Levels For 06/09/12
Close * Intra
(Spot) Day Pivot Resistance Support
Company 05/09/12 Trend Point R1 R2 R3 S1 S2 S3
YES BANK 324 DOWN 326 330 336 346 320 317 307
ZEEL 171 UP 170 173 175 179 168 166 161
Sanjay Bhatia (AVP – Technical Research), Email Id sanjay@keynotecapitals.net
Pivot Point: Intra- Day Trading Tool. - The key to the use of this tool is the use of Stop Loss
Intra Day Trend: It is valid only till the point where Price trades above Pivot Point. For Eg. “UP” would be valid till Price
remains above Pivot Point. It would become “DOWN” in event Price trades below Pivot Point.
Pivot Point (PP): This is a trigger point for Intra Day Buy / Sell based on the price range of the previous day.
R1: Resistance 1: 1st Resistance level over Pivot Point, R2: Resistance 2: Next Resistance level after R1.
R3: Resistance 3: Next Resistance level after R2.
S1: Support 1: 1st Support level after Pivot Point, S2: Support 2: Next Support level after S1.
S3: Support 3: Next Support level after S2.
Note: As per this tool, the trader should take BUY position just above the Pivot Point and keep the Pivot Point level as stop
loss and the first target would be R1 level (Resistance 1). If R1 is crossed then R2 (Resistance 2) becomes the next target
with the stop loss placed at R1 level. If R2 is crossed then R3 (Resistance 3) becomes the next target with the stop loss
placed at R2 level.
Similarly if price goes below the Pivot Point the trader should take a SELL position and keep the Pivot Point level as the
stop loss and the first target would be S1 level (Support 1). If S1 level is breached then S2 level (Support 2) becomes the
next target with the stop loss placed at S1 level. If S2 level is breached then S3 level (Support 3) becomes the next target
with the stop loss placed at S2 level.
Disclaimer: This document is not for public distribution and has been furnished to you solely for your information and must not be
reproduced or redistributed to any other person. Persons into whose possession this document may come are required to observe these
restrictions. This material is for the personal information of the authorized recipient, and we are not soliciting any action based upon it. This
report is not to be construed as an offer to sell or the solicitation of an offer to buy any security in any jurisdiction where such an offer or
solicitation would be illegal. It is for the general information of clients of Keynote Capitals Ltd. It does not constitute a personal
recommendation or take into account the particular investment objectives, financial situations, or needs of individual clients. We have
reviewed the report, and in so far as it includes current or historical information, it is believed to be reliable though its accuracy or
completeness cannot be guaranteed. Neither Keynote Capitals Ltd., nor any person connected with it, accepts any liability arising from the
use of this document. The recipients of this material should rely on their own investigations and take their own professional advice. Price
and value of the investments referred to in this material may go up or down. Past performance is not a guide for future performance.
Certain transactions -including those involving futures, options and other derivatives as well as non-investment grade securities - involve
substantial risk and are not suitable for all investors. Reports based on technical analysis centers on studying charts of a stock’s price
movement and trading volume, as opposed to focusing on a company’s fundamentals and as such, may not match with a report on a
company’s fundamentals. Opinions expressed are our current opinions as of the date appearing on this material only. While we endeavor
to update on a reasonable basis the information discussed in this material, there may be regulatory, compliance, or other reasons that
prevent us from doing so. Prospective investors and others are cautioned that any forward-looking statements are not predictions and may
be subject to change without notice. Our proprietary trading and investment businesses may make investment decisions that are
inconsistent with the recommendations expressed herein. We and our affiliates, officers, directors, and employees world wide may: (a)
from time to time, have long or short positions in, and buy or sell the securities thereof, of company (ies) mentioned herein or (b) be
engaged in any other transaction involving such securities and earn brokerage or other compensation or act as a market maker in the
financial instruments of the company (ies) discussed herein or act as advisor or lender / borrower to such company (ies) or have other
potential conflict of interest with respect to any recommendation and related information and opinions. The analyst for this report certifies
that all of the views expressed in this report accurately reflect his or her personal views about the subject company or companies and its or
their securities, and no part of his or her compensation was, is or will be, directly or indirectly related to specific recommendations or views
expressed in this report. No part of this material may be duplicated in any form and/or redistributed without Keynote Capitals Ltd’s., prior
written consent.
Keynote Capitals Ltd.
The Ruby, 9th Floor,
Senapati Bapat Marg,
Dadar (W), Mumbai, India – 400028
Tel: 30266000 / 22694322
www.keynotecapitals.com