
Recommended
Recommended
More Related Content
What's hot
What's hot (19)
Similar to Doc join
Similar to Doc join (20)
Recently uploaded
Recently uploaded (20)
Doc join
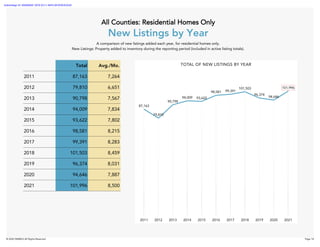
- 1. Total Avg./Mo. 2011 87,163 7,264 2012 79,810 6,651 2013 90,798 7,567 2014 94,009 7,834 2015 93,622 7,802 2016 98,581 8,215 2017 99,391 8,283 2018 101,503 8,459 2019 96,374 8,031 2020 94,646 7,887 2021 101,996 8,500 All Counties: Residential Homes Only New Listings by Year A comparison of new listings added each year, for residential homes only. New Listings: Property added to inventory during the reporting period (included in active listing totals). 87,163 79,810 90,798 94,009 93,622 98,581 99,391 101,503 96,374 94,646 101,996 101,996 2011 2012 2013 2014 2015 2016 2017 2018 2019 2020 2021 TOTAL OF NEW LISTINGS BY YEAR © 2022 NWMLS All Rights Reserved Page 14 Authentisign ID: EB2B92AF-307E-EC11-94F6-281878CED430
- 2. Total Avg./Mo. 2011 347,109 28,926 2012 261,371 21,781 2013 236,174 19,681 2014 242,849 20,237 2015 195,416 16,285 2016 161,453 13,454 2017 135,026 11,252 2018 146,446 12,204 2019 143,011 11,918 2020 84,649 7,054 2021 55,993 4,666 All Counties: Residential Homes Only Active Listings by Year A comparison of active listings each year, for residential homes only. Active Listings: Inventory on market. 347,109 261,371 236,174 242,849 195,416 161,453 135,026 146,446 143,011 84,649 55,993 347,109 2011 2012 2013 2014 2015 2016 2017 2018 2019 2020 2021 TOTAL OF ACTIVE LISTINGS BY YEAR © 2022 NWMLS All Rights Reserved Page 23 Authentisign ID: EB2B92AF-307E-EC11-94F6-281878CED430
- 3. Total Avg./Mo. 2011 48,952 4,079 2012 55,697 4,641 2013 65,122 5,427 2014 66,716 5,560 2015 75,975 6,331 2016 81,852 6,821 2017 85,819 7,152 2018 80,232 6,686 2019 80,734 6,728 2020 83,410 6,951 2021 92,713 7,726 All Counties: Residential Homes Only Closed Sales by Year A comparison of closed sales units each year, for residential homes only. 48,952 55,697 65,122 66,716 75,975 81,852 85,819 80,232 80,734 83,410 92,713 92,713 2011 2012 2013 2014 2015 2016 2017 2018 2019 2020 2021 TOTAL OF CLOSED SALES BY YEAR © 2022 NWMLS All Rights Reserved Page 41 Authentisign ID: EB2B92AF-307E-EC11-94F6-281878CED430
- 5. Active Listings Closed Sales Months of Inventory 2011 347,109 48,952 7.09 2012 261,371 55,697 4.69 2013 236,174 65,122 3.63 2014 242,849 66,716 3.64 2015 195,416 75,975 2.57 2016 161,453 81,852 1.97 2017 135,026 85,819 1.57 2018 146,446 80,232 1.83 2019 143,011 80,734 1.77 2020 84,649 83,410 1.01 2021 55,993 92,713 0.60 All Counties: Residential Homes Only Months of Inventory by Year A comparison of the months of inventory each year, for residential homes only. Months of Inventory: The ratio of active listings to closed sales (derived by dividing the total number of active listings on the market by the total number of closed sales). 347,109 92,713 0 50,000 100,000 150,000 200,000 250,000 300,000 350,000 400,000 2011 2012 2013 2014 2015 2016 2017 2018 2019 2020 2021 Active Listings Closed Sales 7.09 4.69 3.63 3.64 2.57 1.97 1.57 1.83 1.77 1.01 0.60 7.09 2011 2012 2013 2014 2015 2016 2017 2018 2019 2020 2021 Months of Inventory © 2022 NWMLS All Rights Reserved Page 59 Authentisign ID: EB2B92AF-307E-EC11-94F6-281878CED430
- 6. Total 2011 243,470 $ 2012 255,000 $ 2013 281,000 $ 2014 295,000 $ 2015 320,000 $ 2016 348,000 $ 2017 380,000 $ 2018 410,000 $ 2019 435,000 $ 2020 490,000 $ 2021 590,000 $ All Counties: Residential Homes Only Closed Sales Price by Year A comparison of median sales prices each year, for residential homes only. The median is the “middle” price, meaning that there are an equal number of sold units at a higher and lower value, the middle value being the median. Example: If you wanted to find the median sales price for 5 listings with sales prices of $100,000, $200,000, $250,000, $300,000, and $600,000 - the price in the middle of the list is $250,000. $243,470 $255,000 $281,000 $295,000 $320,000 $348,000 $380,000 $410,000 $435,000 $490,000 $590,000 $590,000 2011 2012 2013 2014 2015 2016 2017 2018 2019 2020 2021 MEDIAN PRICE OF CLOSED SALES BY YEAR © 2022 NWMLS All Rights Reserved Page 50 Authentisign ID: EB2B92AF-307E-EC11-94F6-281878CED430