PM Job Search Council Info Session - PMI Silver Spring Chapter
Presentation at ICOSSAR 2013
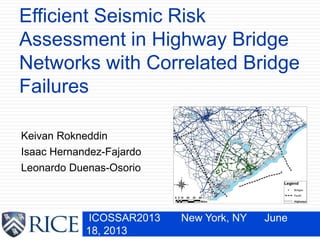
1. Efficient Seismic Risk
Assessment in Highway Bridge
Networks with Correlated Bridge
Failures
ICOSSAR2013 New York, NY June
18, 2013
Keivan Rokneddin
Isaac Hernandez-Fajardo
Leonardo Duenas-Osorio
2. New York, NY
System Reliability
2 Formulation
( ) 0
( )f
g
P f dX
x
x x
x1
x2
Safe samples
Failed samples
: input random variables
( ): joint probability distribution
( ) 0: limit state function
f
g
X
x
x
x
( ) 0g x
3. New York, NY
Network Reliability
3 Input and Reliability Objective
|
( ) 0
( )
= P[Network Failure | ]
f h
g
P f dX
x
x x
x
( ) 0g x
O
D
x1
x2
: Hazard scenario characteristics
: Bridge failure probabilities given
( ) 0: Network failure criteria: connectivity reliabilityg
h
x h
x
4. New York, NY
Network Reliability
4 Input and Reliability Objective
|
( ) 0
( )
= P[Network Failure | ]
f h
g
P f dX
x
x x
x
( ) 0g x
O
D
VulnerabilityO
D
x1
x2
5. New York, NY
Network Reliability
5 Input and Reliability Objective
O
D
Vulnerability
( ) 0g x
x1
x2
|
( ) 0
( )
= P[Network Failure | ]
f h
g
P f dX
x
x x
x
6. New York, NY
6 Probabilistic Analysis
Risk Assessment
0Pr[ ]f fP P
7. New York, NY
Unconditional probability
of
network failure
7 Unconditional Probability of Network Failure
Risk Assessment
1| 1
( ) 0
( )f h
g
P f d
x
x x
2| 2
( ) 0
( )f h
g
P f d
x
x x
hazard scenariosmapsn
( )
1
1
I( )
P( )
maps
maps
n
i
f i
i
f n
i
i
P u w
P u
w
weights
8. New York, NY
8 Flow Chart
Procedure
Generate Hazard Scenarios
Correlation among bridge
failure probs
Evaluate Network
Performance Pf
Evaluate Risk by Combining
the Hazard Scenarios
Bridge Failure Probs
9. New York, NY
Outline
9
1. Generating hazard scenarios
2. Correlated bridge failures
3. Network reliability assessment
4. Case study
5. Summary and conclusions
11. New York, NY
Generating Hazard Maps
11
1
Ground Motion Models
Scenario1
Scenario nmaps
E[ ], , and :PGA Boore and Atkinson (2008)
log( ) log(E[ ]) . .PGA PGA ε
and : Jayaram and Baker (2010)
~ N(0,ε Σ
~ N(0,1
Intra-event error term
Inter-event error term
…
12. New York, NY
Generating Hazard Maps
12
1
Importance Sampling
Expected Probability of
Exceedance
( )
1
1
I( )
P( )
maps
maps
n
i
f i
i
f n
i
i
P u w
P u
w
13. New York, NY
Bridge Failure Probabilities
13
1
Time-dependent Bridge Fragilities
Bridge failure:
extensive damage state
Bridge Fragility models
are time-dependent
Pi , probability that Bridge i fails
1Fragility P[ | , ,..., ]tDamage PGA x x
PGA (g)
Probabilityof
Exceedance
14. Sources of Correlations
Simulating correlated Bernoulli random
variables
Correlated Bridge Failures2
Generate Hazard
Scenarios
Correlation among
bridge failure probs
Evaluate Network
Performance Pf
Evaluate Risk by
Combining the Hazard
Scenarios
Bridge Failure Probs
15. New York, NY
Sources of Correlations:
Maintenance schedule
Construction methods
Environmental conditions
Traffic loading
Database to set up correlations
1. Condition ratings of bridges
(National Bridge Inventory)
2. Functional road classes
(TELEATLAS Maps)
3. Network topology (TELEATLAS
Maps)
15
Correlated Bridge Failures
Correlations
O
D
Correlation
level
2
Correlation Matrix
Rnxn
16. New York, NY
16 Correlated Bernoulli Sampling
Correlated Bridge Failures 2
1 0 1
0 0 1
1 1 0
MCN n
1
2
, {0,1}T n
n
X
X
X
X X
Bernoulli
randomVariable
CompatibleCorr.
Matrix
Sampling for
Monte Carlo
simulations
1 12 1
21 2
1 2
n
n n n
R R R
R R
R R R
R
17. New York, NY
Correlated Bridge Failures
17
2
Probability Matrix
1 12 1
21 2
1 2
n
n n n
R R R
R R
R R R
R
(1 ) (1 )ij i j ij i i j jP PP R P P P P
Probability
matrix
where is Bridge i’s failure probability
and:
iP
1 12 1
21 2
1 2
n
n n n
P P P
P P
P P P
P
Correlation matrixCorrelation
Matrix (R)
Form the Probability Matrix
Modify the Probability Matrix
for Compatibility
Pi, i = 1, …, n
18. New York, NY
Correlated Bridge Failures
18
2
Compatibility
1 12 1
21 2
1 2
n
n n n
P P P
P P
P P P
P
1. 0 1
2. max(0, 1) min( , )
3. 1
i
i j ij i j
i j k ij ik jk
P
P P P P P
P P P P P P
Compatibility
Conditions
Modified
Prob. Matrix
1 12 1
21 2
1 2
n
n n n
P P P
P P
P P P
P
Admissible
ranges
max min,R R
Original Prob.
Matrix
max min
0 min
'
( min . )
max min
1
R R
R R R R
R R
' '
0 max 0'
' '
0 0 min
0,1
1,0
R R R
R
R R R
19. Network Surrogate Models
Efficient Reliability
Assessment
3
Generate Hazard
Scenarios
Correlation among
bridge failure probs
Evaluate Network
Performance Pf
Evaluate Risk by
Combining the Hazard
Scenarios
Bridge Failure Probs
20. New York, NY
Reliability Assessment
20
3
Monte Carlo Simulations
Computationally Expensive for
multiple hazard scenarios
Error Term
'
min maxmax( , )
E
R R
R R R R
1 0 1
0 0 1
1 1 0
MCN n
M
O D
21. New York, NY
Surrogate Models
21
Form a closed form model fitted to ns records (<
nmaps)
Use the surrogate model to evaluate the bridge
demand or network failure probability for the
future, out-of-sample records
3
( )y s x
(1) (1) (1)
1 2
(2) (2) (2)
1 2
( ) ( ) ( )
1 2
n
n
ns n
ns ns ns
n
x x x
x x x
X
x x x
(1)
(2)
1
( )
ns
ns
y
y
Y
y
s: surrogate closed form
function
n: Number of
predictors
ns: Number of
records
24. New York, NY
Given Hazard Scenario
24 The impact of correlations
4
Correlations may change the
reliability estimate by 20%
The original correlation estimates
from the three sources are
acceptable
25. New York, NY
25
Risk Assessment
Reliability Assessment by Surrogate Models
4
Risk assessment with nmaps = 350
ns = 200 records: 180 for model
selection
26. New York, NY
26
Risk Assessment
South Carolina highway bridge network
4
( )
1
1
I( )
P( )
maps
maps
n
i
f i
i
f n
i
i
P u w
P u
w
Saving in
computation
time:
36%
28. New York, NY
Summary
28
Efficient seismic reliability assessment of
transportation networks enables risk assessment
of large systems
Non-hazard correlations among bridge failure
probabilities potentially have a considerable
impact on network reliability estimates
The use of surrogate models saves significant
computation time for seismic reliability and risk
analysis of highway bridge networks
The produced errors by applying the surrogate
models are in the range of acceptable errors for
risk analysis
5
29. New York, NY
Future Work
29
Estimate the total accumulated error
Estimate the total savings in computation time
Comprehensive bridge ranking for retrofit
prioritization
5
30. New York, NY
Thank you!
30
Generate Hazard
Scenarios
Correlation
among bridge
failure probs
Evaluate Network
Performance Pf
Evaluate Risk by
Combining the
Hazard Scenarios
Bridge Failure
Probs
Editor's Notes
Copulas, DGM
Careful how to explain ns and n. also s.
36% computational time saved!
LDO: Link to resilienceCareful how to explain ns and n. also s.
LDO: Add acknowledgments (NSF) and also a thank you note in the same slide.Careful how to explain ns and n. also s.
LDO: Add acknowledgments (NSF) and also a thank you note in the same slide.Careful how to explain ns and n. also s.