SlideShare a Scribd company logo
1 of 60
Cambridge Lower Secondary Mathematics 0862 Progression Grid v1.2 1
Cambridge Lower Secondary
Cambridge Lower Secondary Mathematics 0862 Progression Grid
Number
Integers, powers and roots
Stage 7 Stage 8 Stage 9
7Ni.01 Estimate, add and subtract integers,
recognising generalisations.
Ensure learners can estimate simple calculations so that they
recognise when an answer is incorrect without a formal
calculation. Use numbers rounded to one significant figures
to estimate.
For large numbers learners can check using a calculator.
Use a number line to demonstrate the relative distances from
zero
e.g.
+2 – 2 = 0,
-2 + 2 = 0,
11 - 19 = -8
-7 + 10 = ?
-6 - 11 = ?
-8 + 6 = ?
Ensure learners understand the concept of subtracting a
negative number by generalising the rule.
Cambridge Lower Secondary Mathematics 0862 Progression Grid v1.2 2
7 - 2 = 5
7 - 1 = 6
7 - 0 = 7
7 - (-1) = 8
7 - (-2) = ?
7 - (-3) = ?
Encourage learners to discuss calculations where a range of
misconceptions have occurred.
e.g. which of the following are incorrect? What mistakes have
been made?
5 - 7 = 2
-5 - 4 = 9
5 - (-2) = -7
7Ni.02 Understand that brackets, positive indices and
operations follow a particular order.
8Ni.01 Understand that brackets, indices (square and
cube roots) and operations follow a particular order.
The correct order of operations is:
Brackets
Indices
Division/multiplication
Addition/subtraction
Start with any numbers inside brackets, going from left to
right, then indices and so on.
e.g. 15 - 22
= 15 – 4 because indices are calculated first and
subtracted from 15 and not 15 – 22
= 132
Introduce examples with both addition and subtraction
e.g.
9 - 3 + 4
=6 + 4
=10
NOT
9 – 3 + 4
= 9 - 7
= 2
The correct order of operations is:
Brackets
Indices, square and cube roots
Division/multiplication
Addition/subtraction
Start with any numbers inside brackets, going from left to
right, then indices and so on.
e.g. 20 – 15 x √25
= 20 – 15 x 5 = 20 – 75 = -55
Use examples where learners have to explain the order of
operations.
e.g. Why are these different?
A) √ (42
+ 9)
B) (√4 + 9)2
Cambridge Lower Secondary Mathematics 0862 Progression Grid v1.2 3
Investigate situations where changing the operations in the
question or inserting / removing brackets will change the
answer.
e.g. How many different answers can be found using four 4s
and any combination of + - x ÷ and brackets?
(4 + 4) - 4 + 4 = 8
Insert brackets to make this calculation correct
42
+ 4 x 2 = 40
7Ni.03 Estimate, multiply and divide integers including
where one integer is negative.
8Ni.02 Estimate, multiply and divide integers,
recognising generalisations.
Ensure learners can estimate simple calculations so that they
recognise when an answer is incorrect without a formal
calculation. For large numbers learners can check using a
calculator.
Use examples that use times tables so that learners are
familiar with the numbers.
e.g. 5 x ( – 6) = - 30
-30 ÷ 5 = - 6
At this stage do not use examples that multiply and divide
negative integers by negative integers.
Use calculations involving positive and negative numbers to
list other calculations that can be derived
e.g.
If I know that
-288 ÷ 24 = -12
What other calculations can I derive?
(-12 x 24 = -228 and so on).
Ensure learners can estimate simple calculations so that they
recognise when an answer is incorrect without a formal
calculation. For large numbers learners can check using a
calculator.
e.g.
–7 × (–6); 48 ÷ (–8)
Use many examples so that learners determine the rules for
multiplication and division (similar to addition and
subtraction) of positive and negative numbers without rote
learning.
Give learners a range of calculations, some of which are
incorrect and ask them to identify the errors made.
e.g.
-8 x -9 = -72
(-10)2
= -100
7Ni.04 Understand lowest common multiple and
highest common factor (numbers less than 100).
8Ni.03 Understand factors, multiples, prime factors,
highest common factors and lowest common multiples.
Include examples where a listing strategy can be used.
e.g.
e.g. Construct a factor tree and write a number as a product
of its prime factors
e.g. 500 = 22
× 53
Cambridge Lower Secondary Mathematics 0862 Progression Grid v1.2 4
The multiples of 3 are 3, 6, 9, 12, 15, 18, 21, 24…
The multiples of 4 are 4, 8, 12, 16, 20, 24 …
The common multiples of 3 and 4 are 12, 24, …
The lowest common multiple of 3 and 4 is 12.
Note that the Highest Common Factor (HCF) is the same as
the Greatest Common Divisor.
e.g.
Factors of 36 are:
1, 2, 3, 4, 6, 9, 12, 18, 36
Factors of 48 are:
1, 2, 3, 4, 6, 8, 12, 16, 24, 48
The HCF of 36 and 48 is 12.
Use prime factorisation to find the LCM or HCF of two
numbers
e.g.
40 = 2 x 2 x 2 x 5
28 = 2 x 2 x 7
LCM = 2 x 2 x 2 x 5 x 7 = 280
HCF = 2 x 2 = 4
7Ni.05 Use knowledge of tests of divisibility to find
factors of numbers greater than 100.
Ensure learners are aware of the divisibility rules for numbers
between 2 and 10
25 – last two digits are 00, 25, 50 or 75
100 – last 2 digits are 00
e.g. The number 162 is divisible by 9 and also divisible by 3
because 1 + 6 + 2 = 9 and nine is divisible by 3.
Cambridge Lower Secondary Mathematics 0862 Progression Grid v1.2 5
8Ni.04 Understand the hierarchy of natural numbers,
integers and rational numbers.
9Ni.01 Understand the difference between rational and
irrational numbers.
Learners should be able to represent the hierarchy in a Venn
diagram.
Ask questions such as:
Write down a number from the list “-4, 0.5, 16.3, π, 10,000”
that is:
a) a rational number
b) an integer
c) a natural number
Tick all the correct statements:
a) 3 is a rational number
b) -3 is a rational number
c) 3 is a natural number
d) -3 is a natural number
e) 3 is an integer
f) -3 is an integer
Ensure learners understand that integers and natural
numbers are rational and that fractions (with integer
numerator and denominator), terminating decimals or
recurring decimals are also rational.
Ensure learners understand that some roots (e.g.
√2, √3, √5) are irrational but some roots are rational (e.g. √4
is rational as it is equal to 2). Ensure learners understand
that π is an example of an irrational number.
Learners are expected to understand that negative roots do
not belong to the set of rational or irrational numbers.
Ask questions such as:
Circle the number from the list below that is irrational:
-4, 0.5, 16.3, π, 10,000, √25
Circle all the rational numbers:
-4, 0.5, π, √2, 10, ½
Tick the correct boxes
Rational Irrational
5
√25
√2
½
Explore connections between rational and irrational numbers
Ask learners to find: two irrational numbers whose product is
rational
e.g. use a calculator to work out
√2 x √8
√3 x √12
Cambridge Lower Secondary Mathematics 0862 Progression Grid v1.2 6
8Ni.05 Use positive and zero indices, and the index
laws for multiplication and division.
9Ni.02 Use positive, negative and zero indices, and
the index laws for multiplication and division.
e.g. know that
70
= 1,
72
× 73
= 75
,
(153
)2
= 156
1114
÷ 1112
= 112
e.g. know that
2–3
=
1
23 ,
1110
÷ 1112
= 11–2
9Ni.03 Understand the standard form for representing
large and small numbers.
Standard form is the same as scientific notation.
2530000 = 2.53 x 10⁶
and not 253 x 104
or 25.3 x 10⁵
0.00568 = 5.68 x 10⁻³
7Ni.06 Understand the relationship between squares
and corresponding square roots, and cubes and
corresponding cube roots.
8Ni.06 Recognise squares of negative and positive
numbers, and corresponding square roots.
9Ni.04 Use knowledge of square and cube roots to
estimate surds.
Positive squares only.
Ensure learners can estimate simple calculations so that they
recognise when an answer is incorrect without a formal
calculation. Learners can check using a calculator where
appropriate.
Ensure learners use the notation for square, cube and
square root.
Ensure learners recognise the relationship between square
and square roots (and cube and cube roots) as inverse
operations.
e.g. 25² = 625 and √625 = √252
= 25.
33
= 27 so 3
√27 = 3
Ensure learners can estimate simple calculations so that they
recognise when an answer is incorrect without a formal
calculation. Learners can check using a calculator where
appropriate.
Ensure learners recognise that the square root of a number
may have positive or negative answers
e.g. The square root of 25 is 5 or -5 because 5 x 5 = 52
= 25
and (-5) x (-5) = (-5)2
= 25
Ensure learners can estimate simple calculations so that they
recognise when an answer is incorrect without a formal
calculation. Learners can check using a calculator where
appropriate.
e.g. recognise that
√9 < √10 < √16 so
3 < √10 < 4
Ensure learners know that when the answer to a square or
cube root is irrational (e.g.√5 = 2.223606… or 3
√30 =
3.107232…) it is referred to as a surd.
8Ni.07 Recognise positive and negative cube
numbers, and the corresponding cube roots.
Ensure learners understand the equivalence of the notation
3
√-64 = 3
√(-4)3
= 3
√(-4) x (-4) x (-4) = -4
Cambridge Lower Secondary Mathematics 0862 Progression Grid v1.2 7
Number
Place value, ordering and rounding
Stage 7 Stage 8 Stage 9
7Np.01 Use knowledge of place value to multiply and
divide whole numbers and decimals by any positive
power of 10.
8Np.01 Use knowledge of place value to multiply and
divide integers and decimals by 0.1 and 0.01.
9Np.01 Multiply and divide integers and decimals by
10 to the power of any positive or negative number.
e.g.
5 x 105
= 500 000
7 ÷ 103
= 0.007
Ensure learners recognise the notation for positive powers of
10
100
= 1
101
= 10
102
=100
103
= 1 000
104
= 10 000
105
= 100 000 etc.
e.g.
0.235 ÷ 0.1 = 2.35
0.235 × 0.1 = 0.0235
Ensure learners understand the position of the decimal point
when multiplying and dividing by
1
10
s (tenths).
When dividing by 0.1 or 0.01 consider equivalent calculations
3.5 ÷ 0.1 is the same as
35 ÷ 1
43.7 ÷ 0.01 is the same as
437 ÷ 0.1 and
4 370 ÷ 1
e.g.
2.4 x 105
= 240 000
5.82 x 10-3
= 0.00582
Ensure learners understand the different representations of powers
of ten:
0.1 =
1
10
= 10−1;
0.01 =
1
100
=
1
10
2
= 10−2
7Np.02 Round numbers to a given number of decimal
places.
8Np.02 Round numbers to a given number of
significant figures.
9Np.02 Understand that when a number is rounded
there are upper and lower limits for the original
number.
e.g. round 5.6470299 to 2 decimal places (d.p.)
(5.65)
Use examples that give solutions to problems with an
appropriate degree of accuracy.
Learners can use calculators to find the answer to a question
and then round the answer.
e.g. round 34 627 to 2 significant figures
(35 000)
Round 2.8963 to 3 significant figures
(2.90)
With the number 593 247 the 5 is the most significant digit,
because the number is 5 hundred thousand and something.
If a number was rounded to the nearest 10 to be 460,
learners understand that the original number could be any
number between 455 (including) and 465 (excluding).
Ensure learners can use inequality notation to describe the
limits (bounds) on the original number, 𝑥.
e.g. 455 ≤ 𝑥 < 465
Cambridge Lower Secondary Mathematics 0862 Progression Grid v1.2 8
e.g. They use the calculator to find √62 = 7.874007874 ⋯
and round to 2 decimal places to get to 7.87
Then 9 is the next most significant, and so on. 593 247
correct to 1 significant figure is 600 000
With the number 0.0000057263, the 5 is the most significant
digit, because it tells us that the number is 5 millionths and
something. The 7 is the next most significant, and so on.
0.0000057263 rounded to 2 significant figures is 0.0000057
Use examples that give solutions to problems with an
appropriate degree of accuracy
Use examples where zero is used as a place holder
e.g. Round
20 435 to 3 s.f. 20 400
0.2056 to 2 s.f. 0.21
40 505 to 2 s.f. 41 000
This will assist learners in their preparation for understanding
and using bounds at IGCSE.
Cambridge Lower Secondary Mathematics 0862 Progression Grid v1.2 9
Number
Fractions, decimals, percentages, ratio and proportion
Stage 7 Stage 8 Stage 9
7Nf.01 Recognise that fractions, terminating decimals
and percentages have equivalent values.
8Nf.01 Recognise fractions that are equivalent to
recurring decimals.
9Nf.01 Deduce whether fractions will have recurring or
terminating decimal equivalents.
Ensure learners understand that:
 a percentage can be written as a fraction out of 100
 place value can help to convert decimals into fractions with
a denominator of 10, 100, 1000 and vice versa.
e.g. 31% =
31
100
= 0.31
0.7 =
7
10
= 70%
0.43 = = 43%
0.047 = = 4.7%
Use examples where learners are required to show the
equivalence between fractions, decimals and percentages
F D P
1
2
0.25
75%
1
10
0.3
1
5
23%
0.31
13.2%
Ensure learners can interpret fractions as a division.
e.g.
3
8
can be converted to a decimal by dividing 3 by 8 (3 ÷
8 = 0.375)
Ensure learners can interpret fractions as division and that
some decimal representations of fractions will terminate and
some will recur.
e.g.
3
4
= 3 ÷ 4 =0.75 so this is terminating
1
3
= 1 ÷ 3 = 0.33333… 0. 3̇ so this is recurring
Encourage learners to work systematically to convert unit
fractions to decimal equivalents using a written method so
they can notice patterns
F D
1
2
1
3
1
4
1
5
1
6
1
7
1
8
1
9
1
10
1
11
1
12
e.g.
Learners know
1
9
= 0. 1̇
So,
4
9
= 4 ×
1
9
= 4 × 0. 1̇ = 0. 4̇
Ensure learners know that if 3 is a factor of the denominator
of the fraction (when in its simplest form) then it will result in
a recurring decimal.
e.g.
1
9
must be recurring as
1
3
= 0. 3̇ and because
1
3
=
3
9
= 3 x
1
9
Consider which denominators result in recurring decimals.
e.g.
If the denominator is a multiple of 7 will it recur?
Does
5
14
recur when converted to a fraction?
What about
7
14
?
100
43
1000
47
Cambridge Lower Secondary Mathematics 0862 Progression Grid v1.2 10
Use examples that include improper fractions and mixed
numbers.
1.245 = 124.5% =
249
200
Use examples where learners convert non-unit fractions to
decimals
e.g.
3
7
3÷7 = 0.428571…
7Nf.02 Estimate and add mixed numbers, and write
the answer as a mixed number in its simplest form.
8Nf.02 Estimate and subtract mixed numbers, and
write the answer as a mixed number in its simplest
form.
9Nf.02 Estimate, add and subtract proper and
improper fractions, and mixed numbers, using the
order of operations.
Use examples that add mixed numbers with the same and
different denominators. Learners can use any method but
should consider which is most efficient.
e.g. Learners understand when the most effective point to
regroup numbers is.
3
4
5
+ 2
3
10
= 3
8
10
+ 2
3
10
= 5
11
10
= 6
1
10
require
regrouping of the mixed number rather than converting to
improper fractions.
Learners express answers greater than one as a mixed
number, and reduce all fractions to their simplest form.
Use examples that subtract mixed numbers with the same
and different denominators.
e.g 2
3
7
– 1
1
5
Learners can use any method but should consider which is
most efficient.
e.g. learners understand that they need to regroup the first
number.
3
1
5
- 2
3
5
= 2
6
5
- 2
3
5
=
3
5
Learners express answers greater than one as a mixed
number, and reduce all fractions to their simplest form.
e.g. in
1
3
8
− (
2
5
+
1
2
)
we calculate the fractions in the brackets first
1
3
8
– (
9
10
) =
55
40
–
36
40
=
19
40
Ensure learners are also able to apply learning from 9Nf.03
to use the order of operations with multiplication and division
as well as addition and subtraction.
e.g.
5
3
7
– 1
1
5
x
7
2
We calculate the multiplication first
5
3
7
- 4
1
5
=
1
8
35
e.g.
(1 −
3
4
) ÷ (1 −
1
8
)
7Nf.03 Estimate, multiply and divide proper fractions. 8Nf.03 Estimate and multiply an integer by a mixed
number, and divide an integer by a proper fraction.
9Nf.03 Estimate, multiply and divide fractions, interpret
division as a multiplicative inverse, and cancel
common factors before multiplying or dividing.
Cambridge Lower Secondary Mathematics 0862 Progression Grid v1.2 11
e.g.
7
12
×
4
12
=
28
144
Learners should be able to simplify answers although some
learners may do this in stages.
e.g.
28
144
=
14
72
=
7
36
Learners become aware that fractions like
4
12
could be
simplified before the fractions are multiplied and once fluent,
learners may cross cancel before multiplying to improve
efficiency.
e.g.
For multiplication: Ensure learners understand that, when an
operator is less than one (proper fraction) the answer will be
smaller than the original quantity.
e.g.
3
4
x
1
6
=
1
8
and
1
8
is smaller than
3
4
and
1
6
For division: Ensure learners appreciate that for example
dividing by
1
3
is the same as multiplying by 3 and develop the
idea that for example dividing by
2
3
is the same as multiplying
by
3
2
.
Learners understand that dividing by a fraction is the same
as multiplying by its reciprocal.
Ensure learners understand that, when an operator is less
than one (proper fraction) the answer will be bigger than the
original quantity.
e.g.
5/
Learners should be able to multiply integers by mixed
numbers by partitioning
e.g. 20 × 1
3
8
,
20 x 1 = 20
Learners should also understand that converting the mixed
number to an improper fraction before multiplying will result
in the same answer.
Learners should be able to divide integers by unit fractions
initially, understanding that, for example, dividing an integer
by
1
2
is the same as multiplying by 2 as they are counting up
how many halves are needed to make that integer.
e.g.
Learners should know that when they divide A by B it means
how many lots of B are in A, rather than systematically
learning a rule to calculate the answer.
e.g. 12 ÷
3
4
means how many
3
4
are there in 12. The answer is
16
Learners should understand that dividing an integer by a
fraction is the same as multiplying by its reciprocal.
e.g.
e.g.
Use examples that use a combination of proper and improper
fractions with mixed numbers or integers. Learners will need
to be able to change mixed numbers into improper fractions
e.g.
Ensure learners understand that proper and improper
fractions, and mixed numbers can act as operators that
either increase or decrease the original value.
e.g.
when a quantity is multiplied by a mixed number/improper
fraction then the answer is larger than the original quantity.
When a quantity is divided by a mixed number/improper
fraction then the answer is smaller than the original quantity.
e.g. 20 × 1
1
2
= 30
20 ÷ 1
1
2
= 13
1
3
27
7
9
1
3
7
9
4
12
7




6
5
24
20
3
4
8
5
4
3
8
5





2
1
7
8
4
7
8
60
8
3
20 



2
1
27
2
1
7
20 

10
2
5
2
1
5 



63
9
7
9
1
7 



16
3
48
3
4
12
16
4
3
12





10
3
1
10
13
2
13
5
1
22
13
5
11
22
13
5
1
2







5
2
3
4
1
1 
Cambridge Lower Secondary Mathematics 0862 Progression Grid v1.2 12
and
5
6
is bigger than
5
8
7Nf.04 Use knowledge of common factors, laws of
arithmetic and order of operations to simplify
calculations containing decimals or fractions.
8Nf.04 Use knowledge of the laws of arithmetic and
order of operations (including brackets) to simplify
calculations containing decimals or fractions.
9Nf.04 Use knowledge of the laws of arithmetic,
inverse operations, equivalence and order of
operations (brackets and indices) to simplify
calculations containing decimals and fractions.
Encourage learners to work mentally where appropriate to
select an efficient strategy for the problem.
Use examples with decimals only or proper fractions only,
not combined, and of multiplying decimals by integers (not
decimal x decimal)
e.g.
0.5 x 7 x 10 = 0.5 x 10 x 7 =5 x 7 = 35
4.7 × 9 = 4.7 × (10 – 1) = 47 – 4.7 = 42.3
3
5
x
2
3
+
4
5
=
11
5
Encourage learners to work mentally where appropriate to
select an efficient strategy for the problem.
Use examples
- with decimals only or fractions only, not combined.
3
5
x (
2
3
+
4
5
) =
66
75
=
22
25
- that use one or more of the four operations.
(0.3 + 0.1) x 1.2=0.48
- of multiplying decimals by decimals.
4 × 7.6 × 2.5 = 4 × 2.5 × 7.6 = 10 × 7.6 = 76
4.7 × 9.9 = 4.7 × (10 – 0.1) = 47 – 0.47 = 46.53
Encourage learners to work mentally where appropriate to
select an efficient strategy for the problem.
Use examples that use one or more of the four operations
and a mix of fractions and decimals
e.g.
(
1
2
+ 6.5)
2
–1 = 48
2.5 × 2.5 × 12 =
5
2
×
5
2
× 12 = 5 × 5 × 3 = 75
3.64 × 52
=
364
100
× 25 =
364
100
×
100
4
= 364 ÷ 4= 91
7Nf.05 Recognise percentages of shapes and whole
numbers, including percentages less than 1 or greater
than 100.
8Nf.05 Understand percentage increase and decrease,
and absolute change.
9Nf.05 Understand compound percentages.
e.g.
1
2
% is half of 1%
1
2
% of 400 = 2
e.g. finding
1
2
% or 0.5% of a quantity can be confused with
finding 50%
e.g. 2
1
2
= 2.5 = 250%
Express any quantity as a percentage of another.
e.g. increase $300 by 20%
Ensure learners can use multipliers to increase and decrease
by a percentage
Increase $300 by 20%
$300 x 1.2=$360
Decrease £200 by 15%
£200 x 0.85 = £170
e.g. If an item priced at $200 has a 10% increase in price
then the new price is $220. If this price is followed by a 10%
decrease (a decrease of $22), the final price will be $198, not
the original price of $200.
e.g. If a new car which costs $11,000 decreases in price by
10% each year, how many years will it be before the car is
worth less than $6,000?
What situations could these calculations represent?
A) 600 x 1.047
Cambridge Lower Secondary Mathematics 0862 Progression Grid v1.2 13
If I have a block of wood that is 25 centimetres long and I cut
a piece from it that is 19 centimetres long, what percentage
did I cut? What percentage will be left?
Understand the multiplicative relationship of percentage
e.g. 300% is an increase by a factor of 3, 300% of 50 is 150
(which is a 200% increase)
If the price of a packet of sweets increases from $1.50 to
$4.50 then this is 300% of the original amount since this is
the new price is three times the original price and this
represents a 200% increase.
Ensure learners understand that if the price of an item
increases by 10% then the final price is 110% of the initial
price (100% + 10% = 110%)
Use examples that require learners to understand
percentage decrease and absolute change
e.g. 120 decreased by 200% = -120 and absolute change is -
120 -120 = - 240
An increase of 800% means the final amount is 9 times the
original (100% + 800% = 900% = 9 times as large).
B) 800 x 0.953
7Nf.06 Understand the relative size of quantities to
compare and order decimals and fractions, using the
symbols =, ≠, > and <.
8Nf.06 Understand the relative size of quantities to
compare and order decimals and fractions (positive
and negative), using the symbols =, ≠, >, <, ≤ and ≥.
e.g. order proper fractions and improper fractions
3
4
,
2
3
,
4
3
and
3
2
e.g. order from smallest to largest
3
5
,
11
20
,
5
8
and
8
15
Using the symbols =, ≠, > and < ask learners to order and
compare values.
e.g. given that 3.164 < x < 3.167 write down a possible value
for x.
e.g. given that 3
1
5
< 𝑥 < 3
1
4
write down a possible value for
x.
e.g. compare a mark of 43 out of 55 to a mark of 80%
Using the symbols =, ≠, >, <, ≤ and ≥ ask learners to order
and compare values.
e.g. Understand that
4.17≤ 𝑥 < 4.34
x represents any value in the range 4.17 inclusive to 4.34
exclusive.
Ensure learners understand that when they are ordering and
comparing fractions:
 For the same denominator, the larger the numerator the
larger the fraction.
 For the same numerator, the larger the denominator the
smaller the fraction
e.g. insert the correct symbol (< or >)
11
7
11
8
Cambridge Lower Secondary Mathematics 0862 Progression Grid v1.2 14
Ensure learners understand that to compare
37
65
with
48
4
decimals or percentages are more efficient than fractions.
e.g. decide the better buy between a 500 g packet of rice at
$0.35, or a packet with 500 g + 25% extra at $0.39
7Nf.07 Estimate, add and subtract positive and
negative numbers with the same or different number of
decimal places.
e.g. Three children took part in a long jump competition. John
jumped 1.2m, Mary jumped 0.15m further than John, Fatima
jumped 0.3m less than Mary. How far did Fatima jump?
Ensure learners can calculate with negative numbers and
decimals
e.g.
–7.18 + 3.9
1.208 – (0.7 + 2.41)
7Nf.08 Estimate, multiply and divide decimals by whole
numbers.
8Nf.07 Estimate and multiply decimals by integers and
decimals.
9Nf.06 Estimate, multiply and divide decimals by
integers and decimals.
e.g. 13.27 × 10⁸
4.132 ÷ 5
5.025 ÷ 25
Ensure learners can continue a division to a specified
number of decimal places.
e.g. Write 12.55 ÷ 7 to 1 d.p
12.55 ÷ 7 = 1.79…
So 12.55 ÷ 7=1.8 to 1d.p.
Use examples with positive decimals and positive and
negative integers.
e.g. -2 x 0.4 = -0.8
0.45 x 0.56
Consider patterns to develop an understanding of where to
place the decimal point
e.g.
0.2 x 3 = 0.6
0.2 x 0.3 = 0.06
Use examples with both positive and negative decimals and
integers.
e.g.
 2.34 × 2.9
 43.32 ÷ 0.12
 –2.7 ÷ 3
 –3 × –6 × –0.5
e.g.
If we know that 2.88÷0.24=12
What other calculations can you deduce?
37
23
41
23
Cambridge Lower Secondary Mathematics 0862 Progression Grid v1.2 15
0.2 x 0.03 = 0.006 (12 x 0.24 = 2.88 and so on)
Ensure learners recognise the effects of multiplying and
dividing by decimals between 0 and 1.
e.g. Learners should be able to recognise, without doing a
calculation, whether the answer to 3.784 ÷ 0.916 will be
bigger or smaller than 3.784
8Nf.08 Estimate and divide decimals by numbers with
one decimal place.
Use examples with positive decimals and positive and
negative integers.
e.g. -2 x 0.4 = -0.8
4 ÷ 0.5 = 8
0.45 x 0.56
5.21 ÷ 0.2
Consider equivalent calculations to develop understanding
e.g.
4.8 ÷ 0.6 is equivalent to
48 ÷ 6
7Nf.09 Understand and use the unitary method to
solve problems involving ratio and direct proportion in
a range of contexts.
8Nf.09 Understand and use the relationship between
ratio and direct proportion.
9Nf.07 Understand the relationship between two
quantities when they are in direct or inverse proportion.
Ensure learners understand that once the value of 1 unit is
known, the value of multiple units can be found by multiplying
e.g. if 12 tins of paint weigh 30kg, how much will 5 tins
weigh? The first step in solving this is to find what ONE tin
weighs. This will be
30
12
so 2.5kg. Scaling this back up for 5
tins gives 5 x 2.5 = 12.5kg
Include examples in context.
e.g.
- Recipes:
When A and B share money in the ratio 4:3, it means that A
gets
4
7
of the money and B gets
3
7
Ensure learners can express a given ratio as proportion.
e.g.
The ratio of red to blue counters in a bag is 5:4
What proportion are red? (
5
9
)
Hannah says she thinks there are 64 counters in the bag
altogether. Is she correct?
Ensure learners can identify and give examples of both direct
and indirect proportion and understand the difference
between them.
Use simple examples of inverse proportion.
e.g.
An athlete runs a race and takes 120 seconds to finish. If he
runs double the speed, how long will it take him?
e.g.
It takes 12 builders 2 weeks to build a garage. How long
would it take 6 builders to do the same job?
Cambridge Lower Secondary Mathematics 0862 Progression Grid v1.2 16
300g of sugar makes 12 biscuits. How much sugar is needed
for 5 biscuits?
- Currencies:
David exchanged 350 Euros and received $400.
How much is 1 Euro worth in dollars?
Ben received $6000. How many Euros did he pay?
Ensure learners can express given proportions as a ratio.
e.g.
There are some blue and red beads on a bracelet.
2
5
of the
beads are blue. What is the ratio of blue to red beads? (2:3)
Ensure learners can also use equivalence to compare
proportions.
e.g.
A has yellow and red sweets in the ratio 20:480
B has yellow and red sweets in the ratio 15:385
Who has the greater proportion of yellow sweets?
7Nf.10 Use knowledge of equivalence to simplify and
compare ratios (same units).
8Nf.10 Use knowledge of equivalence to simplify and
compare ratios (different units).
Ensure learners understand that the simplest form contains
no decimals or fractions so 1:1.5 in its simplest form is 2:3
Ensure learners understand that when simplifying a ratio the
relationship between the parts of the ratio does not change
but the quantities may increase or decrease.
e.g. 10:25 simplifies to 2:5
If 10 changes to 2 (5 times less) then 25 must change to 5 in
the same relationship (5 times less).
Use examples with the same units e.g. cm and cm
A model of a house is 30cm tall. The house is 500cm tall.
Write the ratio of the model height to the house height in its
simplest form.
30cm:500cm
3:50
Ensure learners can use equivalence to compare ratios to
solve a problem.
e.g.
30 biscuits cost $1
Use examples with different units e.g. m and cm
A model of a house is 30cm tall. The house is 5m tall. Write
the ratio of the model height to the house height in its
simplest form.
30cm:5m
30cm:500cm
3:50
Ensure learners can use equivalence to compare ratios to
solve a problem including different units of measure.
e.g.
3 cups hold 1300ml
4 mugs hold 1.5L
Which will hold more liquid, one cup or one mug?
Cambridge Lower Secondary Mathematics 0862 Progression Grid v1.2 17
45 biscuits cost $1.80
Which is best value?
30:$1 is the same as 15:50p
45:$1.80 is the same as 15:60c
7Nf.11 Understand how ratios are used to compare
quantities to divide an amount into a given ratio with
two parts.
8Nf.11 Understand how ratios are used to compare
quantities to divide an amount into a given ratio with
two or more parts.
9Nf.08 Use knowledge of ratios and equivalence for a
range of contexts.
Ensure learners can share a quantity into a given ratio (two
parts).
e.g.
Share 70 sweets between A and B, in the ratio 6:4
Use a table or diagram to assist learners.
A 6 42
B 4 28
Total 10 70
Consider the fraction of the sweets each person will get
A will get
6
10
(
42
70
) and B will get
4
10
(
28
70
).
Use examples of simplifying ratios with more than 2 parts.
e.g. 18:27:63 simplified to 2:3:7
Ensure learners can share a quantity into a given ratio
(include examples with more than two parts).
E.g., the angles in a triangle are in the ratio 2:7:9. Find the
size of the smallest angle.
Use examples of sharing in a ratio where learners have to
work backwards and use knowledge of the relative size of
the parts of a ratio.
e.g.
Some sweets are shared in the ratio 5:4:2 between A, B, and
C. B gets 48.
How many sweets were there altogether?
e.g.
A & B share money in the ratio 8:5. A gets $21 more than B.
Find out how much B gets.
e.g.
Two numbers are in the ratio 5 : 2 one of the numbers is 0.8
find two possible values for the other number.
Cambridge Lower Secondary Mathematics 0862 Progression Grid v1.2 18
Algebra
Expressions, equations and formulae
Stage 7 Stage 8 Stage 9
7Ae.01 Understand that letters can be used to
represent unknown numbers, variables or constants.
8Ae.01 Understand that letters have different
meanings in expressions, formulae and equations.
Ensure learners understand the meaning of unknown,
constant, coefficient and term.
e.g.
in 3𝑥 − 2 = 7, 𝑥 is the unknown, 3 is the coefficient of 𝑥, 2
and 7 are constants,
2𝑛 is a term, 3𝑛 + 5 is an expression containing two terms
(3𝑛 and 5),
4𝑛 – 5 = 11 is an equation containing an unknown 𝑛 and
there is only one possible value of 𝑛.
In some cases, constants are given as numbers and in other
cases as letters because they represent a relationship.
e.g.
 constant as numbers
in 5𝑥 + 9 = 17, the constants are 9 and 17
 constant as letters
𝜋 is the ratio of a circle's circumference to its diameter ≈
3.14
Use examples that relate to real situations
 John is x years old, Anne is y years old. What might the
expression x + y mean?
 What would the expression 2x mean?
 What would the expression x - y mean? Is this the same
as y - x?
 What could the equation x + 3 = y mean?
Ensure learners understand the difference between a
variable and an unknown, and the meaning of formula and
subject of a formula.
e.g.
 In the formula 𝑣 = 𝑢 + 𝑎𝑡, the letters are variables
related by the formula. 𝑣 is the subject of the formula.
 𝑦 = 5𝑥 + 4 is a formula but also a linear function in two
variables (x and y). For each individual value of 𝑥, the
value of 𝑦 can be calculated (𝑦 varies according to the
value of 𝑥)
 In the linear equation 4𝑛 − 5 = 11, there is only one
possible value of 𝑛. 𝑛 is an “unknown” but the equation
can be solved to find what 𝑛 is.
 In the expression 5𝑥 + 4, 𝑥 is a variable, 4 is a constant,
5𝑥 and 4 are terms of the expression. 5 is the coefficient of
𝑥. The expression is not equal to anything so cannot be
solved.
The emphasis in Stage 8 is on the difference between
equations, expressions and formulae.
e.g. which of the following is an expression?
V=IR
3x + 4 = 19
10p + 15
Which one is an equation?
Cambridge Lower Secondary Mathematics 0862 Progression Grid v1.2 19
7Ae.02 Understand that the laws of arithmetic and
order of operations apply to algebraic terms and
expressions (four operations).
8Ae.02 Understand that the laws of arithmetic and
order of operations apply to algebraic terms and
expressions (four operations, squares and cubes).
9Ae.01 Understand that the laws of arithmetic and
order of operations apply to algebraic terms and
expressions (four operations and integer powers).
e.g.
in 5 +
𝑎
2
the division is calculated first;
in 9 − 4𝑏 the multiplication is calculated first
𝑎 + 𝑏 = 𝑏 + 𝑎 (commutative)
𝑎𝑏 = 𝑏𝑎
Use examples with no brackets
e.g. Find the value of 5 +
𝑎
2
when 𝑎 = 6,
5 +
6
2
= 5 + 3
=8
Find the value of 3a + 5 when a = 7
Find the value of a + bc when a = 3, b = 1 and c = 10
Examples can include brackets
e.g.
In 2𝑎3
the power is calculated first; in 4(𝑑 − 3) the bracket is
calculated first; in
3𝑎+5
2
the numerator is calculated first.
e.g. Find the value of 3𝑥2
+ 4 when 𝑥 = −2,
3(−2)2 + 4
= 3(4) + 4
=12+4
=16
e.g. Calculate the following if a=3, b=5 and c=6
 a(b + c)
 ab + c
 (a + b)2
 a2
+ b2
Examples can include brackets and all operations
e.g.
In the expression, 3(𝑥 + 8) −
𝑥2
4
+ 5, the brackets are solved
first, then the power of two, then the multiplication and
division, and then the addition and subtraction from left to
right. In order to solve this expression for 𝑥 = 2, following the
order of operations:
3(2 + 8) −
22
4
+ 5
3(10) −
22
4
+ 5
3(10) −
4
4
+ 5
30 − 1 + 5
29 + 5 = 34
7Ae.03 Understand how to manipulate algebraic
expressions including:
- collecting like terms
- applying the distributive law with a constant.
8Ae.03 Understand how to manipulate algebraic
expressions including:
- applying the distributive law with a single term
(squares and cubes)
- identifying the highest common factor to factorise.
9Ae.02 Understand how to manipulate algebraic
expressions including:
- expanding the product of two algebraic expressions
- applying the laws of indices
- simplifying algebraic fractions.
Use and interpret algebraic notation (convention), including:
 3𝑦 in place of 𝑦 + 𝑦 + 𝑦 and 3 × 𝑦 and y3
 𝑎𝑏 in place of 𝑎 × 𝑏
 𝑎2
in place of 𝑎 × 𝑎, 𝑎3
in place of 𝑎 × 𝑎 × 𝑎; 𝑎2
𝑏 in place
of 𝑎 × 𝑎 × 𝑏

𝑎
𝑏
in place of 𝑎 ÷ 𝑏
Collect like terms
𝑎 + 𝑎 + 𝑎 + 𝑎 = 4𝑎
Expanding
Distributive law with a single term
3𝑎(𝑎 − 3) = 3𝑎2 − 9𝑎
5𝑏2
(𝑏 − 2𝑎) = 5𝑏3
− 10𝑎𝑏2
Ensure learners understand that factorising means
identifying common factors in algebraic expressions. Link
with multiples and factors and prime numbers.
Expanding two brackets to form trinomials where the
coefficient of x is 1:
(𝑥 + 3)(𝑥 + 2) = 𝑥2 + 5𝑥 + 6
(𝑦 − 1)(𝑦 + 3) = 𝑦2
+ 2𝑦 − 3
Ensure learners recognise the generalisations:
(𝑥 + 𝑎)(𝑥 − 𝑎) = 𝑥2
− 𝑎2
(difference of two squares)
(𝑥 + 𝑎)2
= 𝑥2
+ 2𝑎𝑥 + 𝑎2
Cambridge Lower Secondary Mathematics 0862 Progression Grid v1.2 20
3𝑎2
− 𝑎2
+ 4𝑎2
= 6𝑎2
3𝑐 + 5 − 2𝑐 = 𝑐 + 5
Include examples with fractional coefficients
3𝑏 +
𝑏
2
=
6𝑏+𝑏
2
=
7𝑏
2
𝑜𝑟
7
2
𝑏
3𝑏
8
+
𝑏
4
=
3𝑏+2𝑏
8
=
5𝑏
8
𝑜𝑟
5
8
𝑏
Distributive law with a constant
5(2𝑎 − 3) = 10𝑎 − 15
5(2𝑎 − 3 + 5c) = 10𝑎 − 15 + 25𝑐
Include examples from other strands, for example area and
perimeter of a rectangle
Find an expression for the area of the rectangle.
Find an expression for the perimeter of the rectangle.
Factorising
By identifying the highest common factor
4𝑐 − 8 = 4(𝑐 − 2)
3𝑎𝑏 + 2𝑎 = 𝑎(3𝑏 + 2)
3𝑎2
− 12𝑎 = 3𝑎(𝑎 − 4)
Ensure learners recognise the relationship between
expanding and factorising.
Include examples from other strands, for example area and
perimeter of a rectangle
e.g.
An expression for the area of this rectangle is 2b2
+ 14b.
Find an expression for the width of the rectangle.
(perfect squares)
Laws of indices
𝑥5
× 𝑥4
= 𝑥5+4
= 𝑥9
𝑦8
÷ 𝑦3
= 𝑦8−3
= 𝑦5
𝑧3
× 3𝑧 = 1𝑧3
× 3𝑧1
= 3𝑧3+1
= 3𝑧4
4𝑧5
÷ 2𝑧2
= 2𝑧5−2
= 2𝑧3
(𝑎3)2
= 𝑎3×2
= 𝑎6
3𝑛2 − 2𝑛2 = 𝑛2
Algebraic fractions
Ensure learners understand that ‘cancelling’ does not mean
‘crossing out what is similar’. e.g. The first example is
incorrect
6𝑥+3
3
= 6𝑥,
because learners need to factorise first as shown here:
6𝑥 + 3
3
=
3(2𝑥 + 1)
3
= 2𝑥 + 1
7Ae.04 Understand that a situation can be represented
either in words or as an algebraic expression, and
move between the two representations (linear with
integer coefficients).
8Ae.04 Understand that a situation can be represented
either in words or as an algebraic expression, and
move between the two representations (linear with
integer or fractional coefficients).
9Ae.03 Understand that a situation can be represented
either in words or as an algebraic expression, and
move between the two representations (including
squares, cubes and roots).
Use examples with one or two steps and no brackets
e.g.
7 more than double a number can be represented by 2𝑛 +
7.
Encourage learners to evaluate them by substituting a given
value for each variable.
Use examples with more than two steps, more than one
variable and with brackets
e.g. a triangle has three sides, the shortest side has length 𝑥,
the second side is twice as long as the shortest side and the
longest side is 3 units longer than the second side. The
expression for the perimeter of the triangle is
𝑥 + 2𝑥 + 2𝑥 + 3 = 5𝑥 + 3
Use examples with more than one variable and with brackets
e.g.
I think of a number, 𝑛, multiply it by 2, square and then
subtract 3. My number is represented by the expression
(2𝑛)2
− 3
Cambridge Lower Secondary Mathematics 0862 Progression Grid v1.2 21
e.g. In the example above, if my number is 3.
2 × 3 + 7 = 6 + 7 = 13 (the double of my number is 6. 7
more than 6 is 13)
If my number is 5. 2 × 5 + 7 = 10 + 7 = 17 (the double of my
number is 10. 7 more than 10 is 17)
Use examples where learners have to do the opposite: write
an algebraic expression in words
e.g.
one step: 2𝑥 = the double of a number
two step: 3𝑛 + 8 = I have a number. I triple it and add eight.
𝑥 represents the shortest side, 2𝑥 represents the second side
and 2𝑥 + 3 represents the longest side.
The area of a rectangle with side lengths 3𝑎 and
1
2
𝑏 is
represented by
3𝑎 ×
1
2
𝑏 =
3
2
𝑎𝑏
Angelique has 𝑚 marbles, Eva has 5 more marbles than
Angelique, Carlos has twice as many marbles as Eva.
Eva has 𝑚 + 5
Carlos has 2(𝑚 + 5) = 2𝑚 + 10 marbles.
Encourage learners to evaluate them by substituting a given
value for each variable.
e.g. If Angelique has 5 marbles (𝑚 = 5), Eva will have 𝑚 +
5 = 5 + 5 = 10 and Carlos 2 × 5 + 10 = 10 + 10 = 20.
(20 is twice as many as 10, and 10 is 5 more than 5)
If Angelique has 7 marbles, Eva will have 12 and Carlos will
have 24. (24 is twice as many as 12, and 12 is five more than
7)
A rectangle has width 𝑥. The length of the rectangle is 3
more than twice the width.
𝑊𝑖𝑑𝑡ℎ = 𝑥
𝐿𝑒𝑛𝑔𝑡ℎ = 2𝑥 + 3
The area of this triangle is represented by
𝐴𝑟𝑒𝑎 = 𝑤𝑖𝑑𝑡ℎ × 𝑙𝑒𝑛𝑔𝑡ℎ
𝑥(2𝑥 + 3) = 2𝑥2
+ 3𝑥
Encourage learners to evaluate them by substituting a given
value for the variables.
e.g. In the example above, if the width is 3, the length is 2 ×
3 + 3 = 6 + 3 = 9 (6 is twice the width, and 9 is 3 more than
6). The area, therefore, needs to be 3 × 9 = 27.
2𝑥2
+ 3𝑥 = 2 × 32
+ 3 × 3 = 2 × 9 + 9 = 18 + 9 = 27, which
shows that the expression for the area is correct.
A square has sides length 𝑥. Using Pythagoras, learners are
able to represent its diagonal as √2𝑥.
7Ae.05 Understand that a situation can be represented
either in words or as a formula (single operation), and
move between the two representations.
8Ae.05 Understand that a situation can be represented
either in words or as a formula (mixed operations), and
manipulate using knowledge of inverse operations to
change the subject of a formula.
9Ae.04 Understand that a situation can be represented
either in words or as a formula (including squares and
cubes), and manipulate using knowledge of inverse
operations to change the subject of a formula.
Use examples where learners have to derive the formulae
such as to convert hours to minutes (𝑚 = 60ℎ); to convert
centimetres to metres (𝑚 =
𝑐
100
)
Ensure learners use knowledge of inverse operations to
manipulate formulae.
Use examples where learners have to derive the formulae
such as to convert degrees Celsius (°𝐶) to degrees
Fahrenheit (°𝐹) (𝐹 = 𝐶 × 1.8 + 32);
to find the sum of the interior angles of a polygon of 𝑛 sides
(𝑠 = 180(𝑛 – 2)); cost of a taxi journey based on a $5 fixed
charge and $2 per kilometre (𝑐 = 2𝑘 + 5); area of a
trapezium (𝐴 =
𝑎+𝑏
2
ℎ), which is also covered in Geometry
and Measure;
Ensure learners understand the fixed and variable
components of formulae, and that they use knowledge of
e.g. Euler’s formula for the relationship between the number
of faces, vertices and edges in a polyhedron covered in
Geometry and measure
(𝐹 + 𝑉 − 𝐸 = 2);
Ensure learners use knowledge of inverse operations to
manipulate formulae.
e.g. Rearrange 𝑅 =
7𝑐+3
5
to make 𝑐 the subject of the formula
𝑅 =
7𝑐 + 3
5
5𝑅 = 7𝑐 + 3
Cambridge Lower Secondary Mathematics 0862 Progression Grid v1.2 22
inverse operations to manipulate formulae (rearranging up to
two steps).
e.g. Rearrange 𝑅 = 7𝑐 + 3 to make 𝑐 the subject of the
formula
𝑅 = 7𝑐 + 3
𝑅 − 3 = 7𝑐
𝑅 − 3
7
= 𝑐
𝑐 =
𝑅 − 3
7
5𝑅 − 3 = 7𝑐
5𝑅 − 3
7
= 𝑐
𝑐 =
5𝑅 − 3
7
e.g. A rectangle has width 𝑥, length 𝑦, and diagonal 𝑑. Using
Pythagoras, learners are able to represent its diagonal 𝑑
𝑑2 = 𝑥2 + 𝑦2.
𝑑 = √𝑥2 + 𝑦2.
7Ae.06 Understand that a situation can be represented
either in words or as an equation. Move between the
two representations and solve the equation (integer
coefficients, unknown on one side).
8Ae.06 Understand that a situation can be represented
either in words or as an equation. Move between the
two representations and solve the equation (integer or
fractional coefficients, unknown on either or both
sides).
9Ae.05 Understand that a situation can be represented
either in words or as an equation. Move between the
two representations and solve the equation (including
those with an unknown in the denominator).
e.g.
2𝑥 = 8,
3𝑥 + 5 = 14,
9 – 2𝑥 = 7,
11 = 3𝑥 + 5
I think of a number, double it and add 5, my answer is 13.
The equation that represents this statement is 2𝑛 + 5 = 13
Ensure learners understand that “taking or moving to the
other side” means performing inverse operations.
e.g. for the equation 𝑥 – 3 = 11, we add the inverse to each
expression.
𝑥 – 3 = 11
+ 3 = +3
𝑥 + 0 = 14
e.g.
4𝑥 + 5 = 2𝑥 + 11
2𝑥 = 4(𝑥 − 3)
4(2𝑥 + 1) − 2(𝑥 − 5) = 2
3
4
𝑥 = 16
3 (
7
8
𝑥 + 2) = −18𝑥
To work out the sizes of the angles in the isosceles triangle
below
2𝑥 + 10 is equal to 3𝑥 − 6 due to the characteristics of an
isosceles triangle.
e.g.
15
𝑧
= 5
15 = 5z
3 = z
e.g.
2
𝑥 + 1
= 16
There are x students in room A.
There are 3 more students in room B than in room A.
I share 100 sweets equally between all the students in room
B and they receive 20 each.
This problem can be represented by the equation
100
𝑥+3
= 20, where 𝑥 is the number of students in room A.
2𝑥 + 10° 3𝑥 − 6°
Cambridge Lower Secondary Mathematics 0862 Progression Grid v1.2 23
That gives us −3 + 3 = 0 on the left and 11 + 3 = 14 on
the right, so the solution of the equation is 𝑥 = 14
Therefore,
2𝑥 + 10 = 3𝑥 − 6
2𝑥 – 3𝑥 = −6 – 10
−𝑥 = −16
𝑥 = 16
Substituting:
2 × 16 + 10 = 32 + 10 = 42
180 – (42 + 42) = 180 – 84 = 96
The angles are 42°, 42°, 96°
Solving gives 𝑥 = 2, so there are 2 students in room A and 5
students in room B
9Ae.06 Understand that the solution of simultaneous
linear equations:
- is the pair of values that satisfy both equations
- can be found algebraically (eliminating one
variable)
- can be found graphically (point of intersection).
Use examples with a pair of equations, including with
decimal answers (approximate solutions).
e.g.
The graph shows the lines 𝑦 = 𝑥 + 1 and 𝑥 + 𝑦 = 3
Cambridge Lower Secondary Mathematics 0862 Progression Grid v1.2 24
The point of intersection is (1, 2) and therefore the solution of
the simultaneous equations is
𝑥 = 1, 𝑦 = 2.
The same solution to the set of simultaneous linear
equations
𝑦 = 𝑥 + 1
𝑥 + 𝑦 = 3
can also be found algebraically.
Using substitution:
x + y = 3
𝑥 + 𝑥 + 1 = 3 (substituting x+1 for y)
2𝑥 + 1 = 3
2𝑥 = 2
𝑥 = 1
𝑦 = 𝑥 + 1
𝑦 = 1 + 1 = 2
A pair of simultaneous equations can also be solved using
elimination:
6𝑥 + 5𝑦 = 38
2𝑥 + 5𝑦 = 26
Subtract to reach
4𝑥 = 12
𝑥 = 3
2𝑥 + 5𝑦 = 26
6 + 5𝑦 = 26
5𝑦 = 20
𝑦 = 4
Cambridge Lower Secondary Mathematics 0862 Progression Grid v1.2 25
7Ae.07 Understand that letters can represent an open
interval (one term).
8Ae.07 Understand that letters can represent open
and closed intervals (two terms).
9Ae.07 Understand that a situation can be represented
either in words or as an inequality. Move between the
two representations and solve linear inequalities.
Ensure learners understand that 𝑥 < 3 is represented as
which means that the 3 does not belong to the interval and
that the interval goes to negative infinity (x can assume any
number below 3)
This uses their knowledge of rational numbers and builds to
solve inequalities in later stages.
e.g.
𝑥 ≤ 2 (x can assume any number below 2, including 2)
−2 < 𝑥 ≤ 2 (x can assume any number between -2 and 2,
excluding -2 and including 2)
Use examples that require learners to use equivalence of
intervals
𝑥 > 3 is equivalent to 2𝑥 > 6
If 𝑥 > 3,
𝑥 – 4 > 3 – 4
𝑥 – 4 > −1
e.g.
The inequality 3𝑥 + 1 > −5 is true for any
𝑥 > −2
The inequality −3 < 𝑥 + 1 ≤ 2 is true when
−3 − 1 < 𝑥 + 1 − 1 ≤ 2 − 1
−4 < 𝑥 ≤ 1
Its solution can be represented as
Ensure learners understand the difference between
equations (solution is a point) and inequalities (solution is an
interval).
Use examples with negative coefficients, but not focusing
only on the rule of flipping the sign when multiplying by -1.
e.g.
3𝑥 + 1 > 4𝑥 – 2
3𝑥 – 4𝑥 > −2 − 1
−𝑥 > −3
𝑥 < 3
Encourage learners to use numbers to check the
equivalency.
Cambridge Lower Secondary Mathematics 0862 Progression Grid v1.2 26
For 𝑥 = 2(< 3)
3 × 2 + 1 > 4 × 2 − 2
6 + 1 > 8 – 2
7 > 6 (true)
For 𝑥 = 3
3 × 3 + 1 > 4 × 3 − 2
9 + 1 > 12 – 2
10 > 10 (false)
Cambridge Lower Secondary Mathematics 0862 Progression Grid v1.2 27
Algebra
Sequences, functions and graphs
Stage 7 Stage 8 Stage 9
7As.01 Understand term-to-term rules, and generate
sequences from numerical and spatial patterns (linear
and integers).
8As.01 Understand term-to-term rules, and generate
sequences from numerical and spatial patterns
(including fractions).
9As.01 Generate linear and quadratic sequences from
numerical patterns and from a given term-to-term rule
(any indices).
e.g.
Continue the sequence -4, -7, -10, -13, ….
The term-to-term rule is subtract 3 so the next term is -16.
A sequence has first term 3 and term-to-term rule add 5. The
next terms in the sequence can be found by applying the
term-to-term rule to the first term
3 + 5 = 8
8 + 5 = 13
13 + 5 = 18
The first four terms are: 3, 8, 13, 18.
The next patterns in the sequence
are
e.g.
A sequence has first term ½ and the term-to-term rule is add
1 ½. The first four terms in the sequence are ½, 2, 3½, 5.
A sequence has first term 2 and the term-to-term rule is
multiply by 3 and add 1. The next terms in the sequence can
be found by applying the term-to-term rule to the first term
2 × 3 + 1 = 6 + 1 = 7
7 × 3 + 1 = 21 + 1 = 22
22 × 3 + 1 = 66 + 1 = 67
67 × 3 + 1 = 201 + 1 = 202
The first five terms are: 2, 7, 22, 67, 202.
e.g.
A sequence has first term 2 and term-to-term rule square and
subtract 1. The next terms in the sequence can be found by
applying the term-to-term rule to the first term
22 − 1 = 4 − 1 = 3
32
− 1 = 9 − 1 = 8
82 − 1 = 64 − 1 = 63
The first four terms are: 2, 3, 8, 63.
7As.02 Understand and describe 𝑛th term rules
algebraically (in the form 𝑛 ± 𝑎, 𝑎 × 𝑛 where 𝑎 is a
whole number).
8As.02 Understand and describe 𝑛th term rules
algebraically (in the form 𝑛 ± 𝑎, 𝑎 × 𝑛, or
𝑎𝑛 ± 𝑏, where 𝑎 and 𝑏 are positive or negative
integers or fractions).
9As.02 Understand and describe 𝑛th term rules
algebraically (in the form 𝑎𝑛 ± 𝑏, where 𝑎 and 𝑏 are
positive or negative integers or fractions, and in the
form
𝑛
𝑎
, 𝑛2
, 𝑛3
or 𝑛2
± 𝑎, where a is a whole number).
If the nth term (position-to-term rule) for a sequence is given
as n-3. The 12th term can be found 12 - 3 = 9
Ensure learners understand how to find the nth term rule for
an easy linear sequence (in the form 𝑛 ± 𝑎, 𝑎 × 𝑛)
A sequence has nth term 20 −
1
2
𝑛. The 6th term can be found
by substituting n with 6:
20 −
1
2
× 6 = 20 − 3 = 17.
Examples can include generating sequences of the form
𝑛2
± 𝑎 . A sequence has nth term 𝑛2
+ 1. The 6th term of this
sequence can be found by replacing n with 6: 62
+ 1 = 36 +
1 = 37.
Cambridge Lower Secondary Mathematics 0862 Progression Grid v1.2 28
e.g
In the sequence 2, 4, 6, 8, … the nth term rule (position-to-
term rule) is 2n
2 × 1 = 2
2 × 2 = 4
2 × 3 = 6
2 × 4 = 8
⋮
2 × 𝑛 = 2𝑛
Ensure learners understand how to find the nth term rule for
a given linear sequence
e.g.
The nth term for the sequence:
1.4, 2.6, 3.8, 5.0 … is 1.2𝑛 + 0.2
In the sequence
the position-to-term rule (nth term rule) for the number of
matchsticks 3𝑛 + 1.
Learners should be able to identify if a number is part of a
sequence given by an nth term rule.
e.g. The nth term of a sequence is given by the rule 3n + 5.
Could the number 39 be a term in the sequence?
This could be done by generating terms of the sequence to
see if 39 is part of the sequence, or by solving the equation
3n + 5 = 39 to see if this gives an integer value.
Learners can explore patterns which occur in the difference
between terms and the difference between these differences
(second difference).
e.g. If the nth term of a sequence is given by the rule n2
+ 4,
the first 5 terms of the sequence will be: 5, 8, 13, 20, 29. The
difference between each pair of terms is 3, 5, 7, 9 and the
difference between each of these is 2, 2, 2
Sequences with nth term of the form n2
+ a can be identified
by comparing with the square number sequence (n2
)
e.g. In the sequence 3, 6, 11, 18, 27, … each term is two
more than its corresponding term in the square number
sequence and so the nth term for this sequence is given by
the rule n2
+ 2
Ensure learners understand how to find the nth term rule for
a given sequence
In the sequence
1
3
,
2
3
, 1,
4
3
… the nth term is
𝑛
3
Ensure learners recognise the sequence of square and cube
numbers and can give their nth term rule
e.g. For the sequence 1, 8, 27, 64,…, the nth term rule is 𝑛3
7As.03 Understand that a function is a relationship
where each input has a single output. Generate
outputs from a given function and identify inputs from a
given output by considering inverse operations (linear
and integers).
8As.03 Understand that a function is a relationship
where each input has a single output. Generate
outputs from a given function and identify inputs from a
given output by considering inverse operations
(including fractions).
9As.03 Understand that a function is a relationship
where each input has a single output. Generate
outputs from a given function and identify inputs from a
given output by considering inverse operations
(including indices).
Numerical and diagrammatic representations of functions
and algebraic representations of functions of the form
𝑦 = 𝑥 + 𝑐 or 𝑦 = 𝑚𝑥.
Functions machines (including inverse), mapping diagrams,
tables, etc. can be used to help learner understanding.
Ensure learners can understand and use different
representations of one-step functions.
Numerical and diagrammatic representations of functions
and algebraic representations of functions of the form
𝑦 = 𝑚𝑥 + 𝑐.
Functions machines (including inverse), mapping diagrams,
tables, etc. can be used to help learner understanding.
Numerical, algebraic and diagrammatic representations.
Functions machines (including inverse), mapping diagrams,
tables, etc. can be used to help learner understanding.
e.g.
Create a function machine for 𝑦 = 3𝑥2 and consider
different inputs such as 1, -1,
1
3
etc.
Cambridge Lower Secondary Mathematics 0862 Progression Grid v1.2 29
e.g. the function 𝑦 = 𝑥 + 2 can be represented by the
function machine
an input of 3 would give an output of 5
an input of -1 would give an output of 1
e.g. for the function 𝑦 = 𝑥 + 2 the inverse function machine
could be represented as
an output of 19 would give an input of 17
an output of 0 would give an input of -2
e.g. the function 𝑦 = 3𝑥 − 2 can be represented by the
function machine
an input of
1
2
would give an output of −
1
2
e.g. for the function 𝑦 = 3𝑥 − 2 the inverse function
machine could be represented as
This inverse function machine can be used to find the input
when the output is 2.5
2.5 + 2 = 4.5
4.5 ÷ 3 = 1.5
So the input was 1.5
e.g. For the function 𝑦 = 3𝑥2
if the output is 12, the possible
inputs are 2 and -2
7As.04 Understand that a situation can be represented
either in words or as a linear function in two variables
(of the form 𝑦 = 𝑥 + 𝑐 or 𝑦 = 𝑚𝑥), and move
between the two representations.
8As.04 Understand that a situation can be represented
either in words or as a linear function in two variables
(of the form 𝑦 = 𝑚𝑥 + 𝑐), and move between the two
representations.
9As.04 Understand that a situation can be represented
either in words or as a linear function in two variables
(of the form 𝑦 = 𝑚𝑥 + 𝑐 or 𝑎𝑥 + 𝑏𝑦 = 𝑐), and move
between the two representations.
Include examples with functions arising from real-life
problems
e.g. currency conversion
If 1 Thai Baht (𝑥) is exchanged for 3 Japanese Yen (𝑦) then
this can be represented by the function 𝑦 = 3𝑥
Use examples where the variables are letters other than x
and y. e.g. c = 2k
Include examples with functions arising from real-life
problems
e.g. cost of hiring a cement mixer with a $25 fixed cost and
additional charge of $10 per day can be represented by the
function 𝑦 = 10𝑥 + 25 where 𝑦 is the total cost and 𝑥 is the
number of days.
Use examples where the variables are letters other than x
and y. e.g. c = 2k + 5
Include examples with functions arising from real-life
problems
e.g. large tables seat 10 people and small tables seat 5
people, 200 people need to be seated.
This situation can be represented by the function 10𝑥 + 5𝑦 =
200 where 𝑥 is the number of large tables and 𝑦 is the
number of small tables
Use examples where the variables are letters other than x
and y. e.g. 2c + 5k = 10
Cambridge Lower Secondary Mathematics 0862 Progression Grid v1.2 30
7As.05 Use knowledge of coordinate pairs to construct
tables of values and plot the graphs of linear functions,
where 𝑦 is given explicitly in terms of 𝑥 (𝑦 = 𝑥 + 𝑐 or
𝑦 = 𝑚𝑥).
8As.05 Use knowledge of coordinate pairs to construct
tables of values and plot the graphs of linear functions,
where 𝑦 is given explicitly in terms of 𝑥 (𝑦 = 𝑚𝑥 + 𝑐).
9As.05 Use knowledge of coordinate pairs to construct
tables of values and plot the graphs of linear functions,
including where 𝑦 is given implicitly in terms of 𝑥
(𝑎𝑥 + 𝑏𝑦 = 𝑐), and quadratic functions of the form
𝑦 = 𝑥2
± 𝑎.
Numerical and graphic representations of functions
e.g. a completed table of values for 𝑦 = 𝑥 + 2
𝑥 -1 0 1 2 3
𝑦 1 2 3 4 5
gives us the coordinate pairs (-1,1), (0,2), (1,3), (2,4), (3,5) to
aid in plotting the graph of 𝑦 = 𝑥 + 2
e.g. 𝑦 = 𝑥 + 2
If the x coordinate is 12, the y coordinate is 14.
So (12,14) lies on the line
Include examples with functions arising from real-life
problems and learners have to draw and interpret their
graphs.
e.g. currency conversion
e.g. A document with 110 pages takes 5 minutes to print.
Draw a straight line graph to show how the time (t minutes)
to print a document varies with the number of pages (x).
Numerical and graphic representations of functions
e.g. a completed table of values for 𝑦 = 3𝑥 − 2
𝑥 -1 0 1 2 3
𝑦 -5 -2 1 4 7
gives us the coordinate pairs (-1,-5), (0,-2), (1,1), (2,4), (3,7)
to aid in plotting the graph of 𝑦 = 3𝑥 − 2
e.g. 𝑦 = 4𝑥 − 8
If the y coordinate is 0, the x coordinate is 2.
So (2, 0) lies on the line and this is where it crosses the x
axis.
If the x coordinate is 0, the y coordinate is -8.
So (0, -8) lies on the line and this is where it crosses the y
axis.
Include examples with functions arising from real-life
problems and learners have to draw and interpret their
graphs.
e.g. cost of hiring a cement mixer with a $25 fixed cost and
additional charge of $10 per day.
Numerical and graphic representations of functions
e.g. a completed table of values for 10𝑥 + 5𝑦 = 200
𝑥 0 5 10 15 20
𝑦 40 30 20 10 0
e.g. a completed table of values for 𝑦 = 𝑥2 + 5
𝑥 -1 0 1 2 3
𝑦 6 5 6 9 14
Include examples where learners have to draw and interpret
their graphs.
e.g. 4𝑥 + 3𝑦 = 12
If the y coordinate is 0, the x coordinate is 3.
So (3, 0) lies on the line and this is where it crosses the x
axis.
If the x coordinate is 0, the y coordinate is 4.
So (0, 4) lies on the line and this is where it crosses the y
axis.
7As.06 Recognise straight-line graphs parallel to the
𝑥- or 𝑦-axis.
8As.06 Recognise that equations of the form
𝑦 = 𝑚𝑥 + 𝑐 correspond to straight-line graphs, where
𝑚 is the gradient and 𝑐 is the 𝑦-intercept (integer
values of 𝑚).
9As.06 Understand that straight-line graphs can be
represented by equations. Find the equation in the
form 𝑦 = 𝑚𝑥 + 𝑐 or where 𝑦 is given implicitly in
terms of 𝑥 (fractional, positive and negative gradients).
Deduce that graphs of the form 𝑥 = 𝑎 will be parallel to the y-
axis and graphs of the form 𝑦 = 𝑏 will be parallel to the x-
axis
Ensure learners recognise the graph of the particular case
𝑦 = 𝑥.
Include examples which require learners to find the gradient
and y-intercept from a graph and deduce the equation of the
graph in the form 𝑦 = 𝑚𝑥 + 𝑐
Cambridge Lower Secondary Mathematics 0862 Progression Grid v1.2 31
e.g. recognise and label the graphs of
𝑥 = 5
For this graph the x coordinate of each point on the line will
always be 5, so the coordinates for this line will be (5,0),
(5,1), (5,2), (5,3) and so on.
𝑦 = −3
For this graph the y coordinate of each point on the line will
always be -3, so the coordinates for this line will be (0,-3),
(1,-3), (2,-3), (3,-3) and so on.
Learners should be able to plot and identify connections
between families of graphs.
e.g. after plotting the graphs of
𝑦 = 2𝑥 + 3
𝑦 = 2𝑥 + 1
𝑦 = 2𝑥 − 2
They should be able to identify that the three lines are
parallel to each other and all have the same gradient.
They should be able to identify that each graph has a
different y-intercept and that the y-intercept for each graph is
the same as the constant in the equation of the graph.
Learners should also be able to plot graphs with the same y-
intercept and notice what effect the value of the x coefficient
has on the gradient of the line.
Include examples with functions arising from real-life
problems and learners have to interpret the features of the
graph
e.g. cost of hiring a cement mixer with a $25 fixed cost and
additional charge of $10 per day.
𝑦 = 25 + 10𝑥
𝑦 is the total cost
𝑐 = 25 (y-intercept)
𝑚 = 10 (gradient)
𝑥 is the number of days
e.g. What is the gradient? What is the y-intercept?
What is the equation of this graph?
e.g. Tick the graph of 𝑦 = 2𝑥 + 1
Include examples which require learners to rearrange
equations to make y the subject and to identify the gradient
and the y-intercept.
e.g. the equation 3𝑦 + 2𝑥 − 7 = 26 can be rearranged to 𝑦 =
−
2
3
𝑥 + 11
Both equations represent the straight line graph with gradient
−
2
3
and y-intercept (0,11)
Cambridge Lower Secondary Mathematics 0862 Progression Grid v1.2 32
7As.07 Read and interpret graphs related to rates of
change. Explain why they have a specific shape.
8As.07 Read and interpret graphs with more than one
component. Explain why they have a specific shape
and the significance of intersections of the graphs.
9As.07 Read, draw and interpret graphs and use
compound measures to compare graphs.
e.g. line graphs (with a single line only), travel graphs
(distance-time), temperature graphs, graph showing depth of
water in a container over time when the container has a
variety of shapes and liquid is added at a constant rate:
Ensure learners understand:
 rate measures the change of a quantity in relation to time,
and therefore the faster something changes the higher the
rate
 positive, zero and negative gradients
 speed is a rate and represents a change in distance in
relation to time
e.g. travel graphs (distance-time) with more than one person;
a graph for phone bill against number of minutes used for
two different contracts.
Learners should not calculate further values/compound
values etc.
This includes calculating further values or compound values
from the graph
e.g.
Calculating the gradient to find a rate of change
Currency exchange rate
Price per unit
Speed from a distance time graph at various points
Cambridge Lower Secondary Mathematics 0862 Progression Grid v1.2 33
Geometry and Measure
Geometrical reasoning, shapes and measurements
Stage 7 Stage 8 Stage 9
7Gg.01 Identify, describe and sketch regular polygons,
including reference to sides, angles and symmetrical
properties.
8Gg.01 Identify and describe the hierarchy of
quadrilaterals.
e.g. understand the line symmetry and rotational symmetry
properties of regular polygons
The hierarchy includes seven quadrilaterals: kite,
parallelogram, rhombus, rectangle, square, trapezium,
isosceles trapezium.
Here a trapezium is defined as a 2D shape with at least one
pair of parallel sides.
Give learners the opportunity to investigate the necessary
and sufficient properties to define each specific type of
quadrilateral.
Ensure learners understand the hierarchy.
e.g. All squares are rectangles, all rectangles are
parallelograms etc.
Cambridge Lower Secondary Mathematics 0862 Progression Grid v1.2 34
7Gg.02 Understand that if two 2D shapes are
congruent, corresponding sides and angles are equal.
7Gg.03 Know the parts of a circle:
- centre
- radius
- diameter
- circumference
- chord
- tangent.
8Gg.02 Understand π as the ratio between a
circumference and a diameter. Know and use the
formula for the circumference of a circle.
9Gg.01 Know and use the formulae for the area and
circumference of a circle.
Recognise and label the parts of a circle.
Ensure learners understand that any length inside the circle
that does not pass through the centre is not a diameter, it is a
chord.
Know that the tangent and radius are perpendicular to each
other.
Learners could explore the ratio between the circumference
and diameter of circular objects by measuring.
Learners should understand that π can be approximated as
3.142,
22
7
and that there is a value of π stored on a scientific
calculator.
Circumference
C = 2𝜋𝑟 or 𝜋d.
e.g. The radius of a circle is 3.2cm, find the circumference.
Radius = 3.2cm
Diameter = 6.4cm
C = 6.4 x π = 20.11cm to 2 d.p.
e.g. The circumference of a circle is 20.8cm, find the
diameter of the circle.
d = 20.8 ÷ π =
6.62cm to 2 d.p.
Area
𝐴 = 𝜋𝑟2
e.g. The diameter of a circle is 10.8cm, find its area.
d = 10.8cm
r = 5.4cm
A = π x 5.42
=
91.69cm2
to 2d.p.
Include examples of finding the area and perimeter of semi-
circles.
Cambridge Lower Secondary Mathematics 0862 Progression Grid v1.2 35
7Gg.04 Understand the relationships and convert
between metric units of area, including hectares (ha),
square metres (m²), square centimetres (cm²) and
square millimetres (mm²).
8Gg.03 Know that distances can be measured in miles
or kilometres, and that a kilometre is approximately 5
8
of
a mile or a mile is 1.6 kilometres.
9Gg.02 Know and recognise very small or very large
units of length, capacity and mass.
e.g. The floor of a room measures 3m by 2.4m. Some tiles
measure 20cm by 20cm. Work out how many tiles are
needed to cover the floor of the room.
Learners should understand that one square centimetre is
10mm x 10mm and therefore
1cm2
= 100mm2
1ha = 10 000m2
1m2
= 10,000 cm2
1km2
= 1,000,000m2
e.g. recognise that 12450 cm2
is 1.245 m2
e.g. Which is longer, 85 km or 52 miles? 1 light year (ly - 9 460 730 472 580 800 metres),
1 micrometre (µm - one millionth of a metre),
1 nanometre (nm-one billionth of a metre),
milligram (mg - one thousandth of a gram), microgram (µg -
one millionth of a gram),
tonne (t - 1000kg).
microlitre (µl), megabyte (MB), gigabyte (GB), terabyte (TB).
7Gg.05 Derive and know the formula for the area of a
triangle. Use the formula to calculate the area of
triangles and compound shapes made from rectangles
and triangles.
8Gg.04 Use knowledge of rectangles, squares and
triangles to derive the formulae for the area of
parallelograms and trapezia. Use the formulae to
calculate the area of parallelograms and trapezia.
9Gg.03 Estimate and calculate areas of compound 2D
shapes made from rectangles, triangles and circles.
e.g. thinking of a triangle as half a rectangle
e.g. use what you know about triangles and rectangles to find
the area of this shape.
Area of a parallelogram = base x perpendicular height
Area of a trapezium
𝐴 =
1
2
(𝑎 + 𝑏)ℎ
e.g. find the area of this shape.
Cambridge Lower Secondary Mathematics 0862 Progression Grid v1.2 36
7Gg.06 Identify and describe the combination of
properties that determine a specific 3D shape.
8Gg.05 Understand and use Euler’s formula to
connect number of vertices, faces and edges of 3D
shapes.
Learners should understand that a ‘face’ is, by definition, flat.
If curved, it is described as a ‘curved surface’.
e.g. a 3D shape has 1 curved surface, no edges and no
vertices, so it must be a sphere
e.g. A pyramid will always have the same number of faces as
vertices.
Include less familiar properties such as:
 All pyramids have an even number of edges.
 The number of edges of a prism is a multiple of 3
Euler’s formula is
V + F – E = 2
Ensure learners know that Euler’s formula only applies to
polyhedra.
7Gg.07 Derive and use a formula for the volume of a
cube or cuboid. Use the formula to calculate the
volume of compound shapes made from cuboids, in
cubic metres (m3), cubic centimetres (cm3) and cubic
millimetres (mm3).
8Gg.06 Use knowledge of area and volume to derive
the formula for the volume of a triangular prism. Use
the formula to calculate the volume of triangular
prisms.
9Gg.04 Use knowledge of area and volume to derive
the formula for the volume of prisms and cylinders.
Use the formula to calculate the volume of prisms and
cylinders.
Introduce many examples of volume so that learners can find
the formula volume = length x width x height
Include examples of working backwards to find a side length
of a cuboid when given the volume and 2 dimensions.
e.g. The volume of a cuboid is 120cm3
. The height of the
cuboid is 10cm and the length is 4cm. Find the width.
Learners should be aware of the relationship between cubic
centimetres and litres.
Use properties of rectangles to calculate area of a triangle.
Volume of triangular prism = area of triangular cross section
x length
Use properties of circles to find the area of a circle.
Volume of cylinder = area of circular cross section x length
Generalise that for any prism:
Volume = area of cross section x length
7Gg.08 Visualise and represent front, side and top
view of 3D shapes.
8Gg.07 Represent front, side and top view of 3D
shapes to scale.
e.g. Draw the front, side and top view of this 3D shape Use knowledge of ratio and proportion to create scale
drawings of 3D shapes.
Cambridge Lower Secondary Mathematics 0862 Progression Grid v1.2 37
Front, side and top view can also be referred to as plans and
elevations.
Ensure learners understand that a 2D representation of a 3D
shape can be a scale drawing or not. When drawing
blueprints, for example, the proportions should be kept
e.g. 5m should be equivalent to 5cm for all parts.
7Gg.09 Use knowledge of area, and properties of
cubes and cuboids to calculate their surface area.
8Gg.08 Use knowledge of area, and properties of
cubes, cuboids, triangular prisms and pyramids to
calculate their surface area.
9Gg.05 Use knowledge of area, and properties of
cubes, cuboids, triangular prisms, pyramids and
cylinders to calculate their surface area.
Include reference to the formula for the surface area of a
cube (6s2
)
Learners should be able to use the net of a cuboid to
determine the rectangles that make up the faces of the
cuboid and work out its surface area.
e.g. Find the surface area of this cuboid
2 x (8 x 10) = 160
2 x (5 x 8) = 80
2 x (10 x 5) = 100
160 + 80 + 100 = 340cm2
Learners should be able to use the nets of shapes to help
them to determine the areas of each of the faces of the
shape.
Connect right-angled prisms to Pythagoras’ theorem.
e.g. Find the surface area of this triangular prism.
(Use Pythagoras theorem to find the missing length on the
sloping side)
7Gg.10 Identify reflective symmetry and order of
rotational symmetry of 2D shapes and patterns.
8Gg.09 Understand that the number of sides of a
regular polygon is equal to the number of lines of
symmetry and the order of rotation.
9Gg.06 Identify reflective symmetry in 3D shapes.
Cambridge Lower Secondary Mathematics 0862 Progression Grid v1.2 38
A picture of star showing three mirror lines or fold lines and
order five rotational symmetry
e.g. (isosceles) trapezium, kite, parallelogram, rhombus,
isosceles triangle, equilateral triangle, scalene triangle,
shapes that have curves
Some shapes can have rotational but not reflective
symmetry.
e.g. a regular pentagon has 5 lines of symmetry and
rotational symmetry order 5
e.g. find the number of planes of symmetry of a hexagonal
prism with a regular hexagon as cross-section
Ensure learners understand that in two dimensions, a shape
is divided into 2 congruent parts by a line of symmetry. In
three dimensions, a plane of symmetry divides a solid into
two congruent parts.
7Gg.11 Derive the property that the sum of the angles
in a quadrilateral is 360°, and use this to calculate
missing angles.
8Gg.10 Derive and use the fact that the exterior angle
of a triangle is equal to the sum of the two interior
opposite angles.
9Gg.07 Derive and use the formula for the sum of the
interior angles of any polygon.
e.g. draw the diagonal of a quadrilateral to form two triangles
and use the angle sum of these to show that the angle sum
of a quadrilateral is 2 x 180o
.
Include examples where learners have to apply their
knowledge of the properties of quadrilaterals including
reference to parallel sides, right angles, rotational and
reflective symmetry.
e.g.
Learners know that a parallelogram has rotation symmetry
order 2. So the top right angle is also 51°.
The remaining two angles are also equal:
360-51-51=258
258÷ 2 =129°
Interior angle sum of a triangle is 180°.
Exterior angle of a triangle is equal to the sum of the two
interior opposite angles.
Learners should be combining angle facts about straight
lines, triangles, around a point and quadrilaterals to find
missing angles in diagrams.
e.g. a polygon with n sides can be split into n – 2 triangles
each with an angle sum of 180°.
The sum of the interior angles of a polygon is (n-2) x 180.
For a regular polygon each of the interior angles will be
equal.
e.g. a regular pentagon has an interior angle sum of (5 - 2) x
180 = 540o
540 ÷ 5 = 108o
Each interior angle is 108o
Learners can use interior and exterior angles of regular
polygons to consider why some tessellate and some not.
Cambridge Lower Secondary Mathematics 0862 Progression Grid v1.2 39
e.g.
Learners know there is a horizontal line of reflection so angle
a=110°
Then angles in a quadrilateral add to 360°
360- 110- 110- 80 = 60
So b=60°
e.g. Find the size of angle e
7Gg.12 Know that the sum of the angles around a
point is 360º, and use this to calculate missing angles.
9Gg.08 Know that the sum of the exterior angles of
any polygon is 360°.
The exterior angles of a polygon create a journey around the
shape that totals 360o
e.g.
Learners can use interior and exterior angles of regular
polygons to consider why some tessellate and some not.
7Gg.13 Recognise the properties of angles on:
- parallel lines and transversals
- perpendicular lines
- intersecting lines.
8Gg.11 Recognise and describe the properties of
angles on parallel and intersecting lines, using
geometric vocabulary such as alternate, corresponding
and vertically opposite.
9Gg.09 Use properties of angles, parallel and
intersecting lines, triangles and quadrilaterals to
calculate missing angles.
Cambridge Lower Secondary Mathematics 0862 Progression Grid v1.2 40
e.g.
Find equal angles in a simple diagram with parallel lines and
a transversal
Find equal angles formed where two lines intersect
Identify parallel lines and equal angles in tessellating
parallelograms
e.g. find equal angles in more complex diagrams, and
explain why they are equal, with the correct geometrical
language alternate, corresponding, vertically opposite
e.g. include examples involving triangle, quadrilaterals and
parallel lines where a number of properties need to be
applied together.
Calculate the size of the angle marked x.
9Gg.10 Know and use Pythagoras’ theorem.
Learners should understand the relationship between the
sides of a right-angled triangle and be able to use two sides
of a right angled triangle to calculate the third side.
Learners should be able to solve problems in a range of
contexts
e.g.
Work out the length of the diagonal of the television screen
Cambridge Lower Secondary Mathematics 0862 Progression Grid v1.2 41
7Gg.14 Draw parallel and perpendicular lines, and
quadrilaterals.
8Gg.12 Construct triangles, midpoint and
perpendicular bisector of a line segment, and the
bisector of an angle.
9Gg.11 Construct 60º, 45º and 30º angles and regular
polygons.
Using ruler, set square, a protractor or digital technology. Using compass and ruler or digital technology.
Construct triangles
 given two sides and the included angle (SAS)
 or two angles and the included side (ASA)
 given three sides (SSS)
 given a right angle, hypotenuse and one side (RHS)
Use a pair of compasses to construct the perpendicular
bisector of a line segment, knowing to show all construction
lines
Use a pair of compasses to construct an angle bisector
knowing to show all construction lines
Using compass and ruler or digital technology.
Includes
Inscribed squares, equilateral triangles, and regular
hexagons and octagons in a circle.
e.g. construct a 45o
angle by constructing a perpendicular
bisector (90o
) and then constructing an angle bisector.
Cambridge Lower Secondary Mathematics 0862 Progression Grid v1.2 42
Geometry and Measure
Position and transformation
Stage 7 Stage 8 Stage 9
7Gp.01 Use knowledge of scaling to interpret maps
and plans.
8Gp.01 Understand and use bearings as a measure of
direction.
9Gp.01 Use knowledge of bearings and scaling to
interpret position on maps and plans.
Learners should be able to convert from a map measurement
to a real life distance and vice versa
e.g. a map has a scale of 1:100 000
The distance between two towns on the map is 3.4cm
What is the distance in real life?
3.4 x 100 000 =
340 000cm =
3400m =
3.4km
Bearings are angles measured clockwise from north (three
digits).
Include examples where learners need to measure a bearing
using a protractor or draw a bearing using a protractor
e.g. what is the bearing of A from B.
e.g. Draw a bearing of 035°
Ensure learners can use bearings to interpret all possible
locations or use two bearings to find the exact location.
e.g.
The diagram shows the position of two mountains, A and B.
A third mountain, C, is on a bearing of 145° from A and on a
bearing of 270° from B. Mark the position of C on the
diagram.
e.g. a tree is 40m from a house and is on a bearing of 056°
from the house.
Use the scale to mark the position of the tree on the map
below…
7Gp.02 Use knowledge of 2D shapes and coordinates
to find the distance between two coordinates that have
the same 𝑥 or 𝑦 coordinate (without the aid of a grid).
8Gp.02 Use knowledge of coordinates to find the
midpoint of a line segment.
9Gp.02 Use knowledge of coordinates to find points on
a line segment.
Cambridge Lower Secondary Mathematics 0862 Progression Grid v1.2 43
Ensure learners understand that (3, 1) and (6,1) belong to
the same horizontal line.
Similarly, ensure learners understand that for example, (1,3)
and (1,6) belong to the same vertical line. This is a
misconception as they see the x coordinates are the same
and incorrectly state that the coordinates belong to the
horizontal line.
Learners should be able to identify the coordinate of C as
(6,4)
Learners should be able to solve similar problems involving
squares and rectangles that are tilted, parallelograms,
isosceles triangles etc.
Learners should be encouraged to find the midpoint of a line
segment both geometrically by measuring and by calculation.
Learners should be able to solve problems where the
midpoint is given.
e.g.
Point M (4.9) is the midpoint of point A (2,1) and point B (?,?)
Find the coordinates of point B
One third of the distance of the y axis and one third of the
distance of the x axis
Find the point that lies one third of the way along the line
segment joining (0,0) and (6,12)
e.g. The origin O, point A, and point B are equally spaced
along the same line such that the distance OA is equal to the
distance AB.
A is the point (4, 3).
What are the coordinates of point B?
If the points continue along the line so that each subsequent
point is labelled with the next letter of the alphabet, what
would be the coordinates of point T?
7Gp.03 Use knowledge of translation of 2D shapes to
identify the corresponding points between the original
and the translated image, without the use of a grid.
8Gp.03 Translate points and 2D shapes using vectors,
recognising that the image is congruent to the object
after a translation.
9Gp.03 Transform points and 2D shapes by
combinations of reflections, translations and rotations.
e.g. The point A has coordinates (3,4). The point A is
translated 2 left and 2 up.
What are the new coordinates of the position of point A now?
Ensure learners understand the difference between a vector
and coordinate, including vector notation.
e.g. translating a shape using the vector (
2
5
) means the
shape moves right 2 and up 5
Ensure learners understand that if two 2D shapes are
congruent, corresponding sides and angles are equal
e.g. Reflect the shape in the line x=3 and then reflect the new
shape in the line y=5
e.g. Translate the shape by the vector (
2
5
) and then rotate
the new shape by 180o
around the point (2,1)
Cambridge Lower Secondary Mathematics 0862 Progression Grid v1.2 44
Understand that the image is congruent to the object after
these transformations (they preserve length and angles)
Ensure learners can identify the vector for a given translation
of an object to its image.
9Gp.04 Identify and describe a transformation
(reflections, translations, rotations and combinations of
these) given an object and its image.
Ensure learners understand what is needed to give a precise
description of a reflection, translation or rotation.
e.g. Reflection requires the equation of the mirror line,
translation requires a vector, rotation requires the angle and
direction of rotation (clockwise / anticlockwise)
e.g. Reflect shape A in the line x=2 and label it B. Reflect
shape B in the line y=1 and label it C.
What single transformation would take shape A to shape C?
9Gp.05 Recognise and explain that after any
combination of reflections, translations and rotations
the image is congruent to the object.
7Gp.04 Reflect 2D shapes on coordinate grids, in a
given mirror line (𝑥- or 𝑦-axis), recognising that the
image is congruent to the object after a reflection.
8Gp.04 Reflect 2D shapes and points in a given mirror
line on or parallel to the 𝑥- or 𝑦-axis, or 𝑦 = ± 𝑥 on
coordinate grids. Identify a reflection and its mirror line.
Includes identifying the equation of the mirror line for a given
object and its image.
Cambridge Lower Secondary Mathematics 0862 Progression Grid v1.2 45
Include examples where the sides of the shape are not
parallel or perpendicular to the mirror line (vertical, horizontal
and diagonal, including through the shape).
7Gp.05 Rotate shapes 90º and 180º around a centre
of rotation, recognising that the image is congruent to
the object after a rotation.
8Gp.05 Understand that the centre of rotation,
direction of rotation and angle are needed to identify
and perform rotations.
Learners should understand that for 90o
rotation, they will
need to consider if the rotation is clockwise or anticlockwise.
7Gp.06 Understand that the image is mathematically
similar to the object after enlargement. Use positive
integer scale factors to perform and identify
enlargements.
8Gp.06 Enlarge 2D shapes, from a centre of
enlargement (outside or on the shape) with a positive
integer scale factor. Identify an enlargement and scale
factor.
9Gp.06 Enlarge 2D shapes, from a centre of
enlargement (outside, on or inside the shape) with a
positive integer scale factor. Identify an enlargement,
centre of enlargement and scale factor.
Ensure learners understand that enlargements preserve
angles but not lengths. Sometimes the enlarged image can
surround or overlap the original image.
Learners should recognise the invariant properties when
carrying out an enlargement from a centre, and the effect on
the lengths and ratios of sides.
e.g. describe the transformation that maps the object onto its
image (enlargement, scale factor 3, centre of enlargement (1,
5))
Ensure learners understand what is needed to give a precise
description of an enlargement.
9Gp.07 Analyse and describe changes in perimeter
and area of squares and rectangles when side lengths
are enlarged by a positive integer scale factor.
e.g. a square with sides 2cm has perimeter 8cm and area
4cm2
. If you double the sides, the perimeter will double
(16cm) but the area will be times 4 (16cm2
).
Cambridge Lower Secondary Mathematics 0862 Progression Grid v1.2 46
e.g. the area of a rectangle is 38cm2
. The rectangle is
enlarged by a scale factor of 3. What will be the area of the
enlarged rectangle?
Cambridge Lower Secondary Mathematics 0862 Progression Grid v1.2 47
Statistics and Probability
Statistics
Stage 7 Stage 8 Stage 9
7Ss.01 Select and trial data collection and sampling
methods to investigate predictions for a set of related
statistical questions, considering what data to collect
(categorical, discrete and continuous data).
8Ss.01 Select, trial and justify data collection and
sampling methods to investigate predictions for a set of
related statistical questions, considering what data to
collect (categorical, discrete and continuous data).
9Ss.01 Select, trial and justify data collection and
sampling methods to investigate predictions for a set of
related statistical questions, considering what data to
collect, and the appropriateness of each type
(qualitative or quantitative; categorical, discrete or
continuous).
Ensure learners can identify whether data is categorical,
discrete or continuous data.
Learners should select how they will collect their data.
e.g. observation, questionnaire, interview, focus groups.
Learners should select how they will choose their sample.
e.g. drawing names out of a hat, using a random number
generator, picking every 3rd
person on the class register,
choosing the first 50 people in the lunch queue.
Ensure learners understand that there are some data
collection methods and sampling techniques that are more
suitable for a specific type of data.
Once a learner has selected their data collection and
sampling methods they should be able to justify the reasons
for their choice.
e.g.
“I put all the girls’ names in one hat and all the boys’ names
in another. Then I pulled out 20 boys’ names and 10 girls’
names. This was because there are double the number of
boys in my school than there are girls, so I wanted to ensure
my sample was representative of the boys and girls in the
population”
Ensure learners consider alternative data collection and
sampling techniques.
e.g.
“I could have given out a questionnaire instead of
interviewing. This would have taken me less time, but I
wouldn’t be as sure that people had understood the
questions”.
Include examples where learners need to decide what data
to collect in order to answer the question. Ensure learners
consider the appropriateness of each data type.
e.g.
“For word length I could measure the length of each word
with a ruler, or simply count the letters. Counting letters is
more appropriate as it is simpler/ easier, and for some fonts
the spaces between the letters is not consistent which
creates an extra source of variation, plus it is hard to
measure accurately which will also add a source of
variation.”
7Ss.02 Understand the effect of sample size on data
collection and analysis.
8Ss.02 Understand the advantages and disadvantages
of different sampling methods.
9Ss.02 Explain potential issues and sources of bias
with data collection and sampling methods, identifying
further questions to ask.
Cambridge Lower Secondary Mathematics 0862 Progression Grid v1.2 48
Ensure learners understand what a population and sample
are.
They should understand the importance of sample size prior
to starting an investigation.
e.g. if learners are collecting data for a whole country, the
sample size should be bigger than if they are collecting data
from the schools (in the latter, it could even be the whole
population).
Ensure learners understand that the larger the sample, the
longer it may take to collect and analyse the data. However,
if the sample is too small, it may not be representative of the
population. As the sample grows the proportions in the
sample reflect the population more closely, but there comes
a point where increasing the sample size does not
meaningfully improve the correspondence between
sample/population proportions (the proportions “stabilise”).
e.g. what sampling method could you use if you wanted to
ask learners in your school about school lunch. What would
be the advantages and disadvantages of each?
 Selecting 5 learners from each tutor group in the school
 Picking the first 50 from an alphabetical list of all learners
who attend the school
 Choosing 50 names out of a hat which contains the names
of all learners who attend the school
 Asking the first 50 people in the lunch queue.
e.g. if a population is made of 45% female and 55% male,
and the sample has 10% male and 90% female.
e.g. Standing outside a swimming pool asking people if they
like swimming.
e.g. Learners are using data from an outdated survey about
social media that included some that are not used anymore
and did not include current platforms.
Learners should understand the sources of bias may be
intentional. A biased sample may make the data appear
more positive e.g. on advertising campaigns.
They should identify further information required to determine
whether the data was collected in a fair way.
Stage 7 Stage 8 Stage 9
7Ss.03 Record, organise and represent categorical,
discrete and continuous data. Choose and explain
which representation to use in a given situation:
- Venn and Carroll diagrams
- tally charts, frequency tables and two-way
tables
- dual and compound bar charts
- waffle diagrams and pie charts
- frequency diagrams for continuous data
- line graphs
- scatter graphs
- infographics.
8Ss.03 Record, organise and represent categorical,
discrete and continuous data. Choose and explain
which representation to use in a given situation:
- Venn and Carroll diagrams
- tally charts, frequency tables and two-way
tables
- dual and compound bar charts
- pie charts
- frequency diagrams for continuous data
- line graphs and time series graphs
- scatter graphs
- stem-and-leaf diagrams
- infographics.
9Ss.03 Record, organise and represent categorical,
discrete and continuous data. Choose and explain
which representation to use in a given situation:
- Venn and Carroll diagrams
- tally charts, frequency tables and two-way
tables
- dual and compound bar charts
- pie charts
- line graphs, time series graphs and frequency
polygons
- scatter graphs
- stem-and-leaf and back-to-back stem-and-leaf
diagrams
- infographics.
Cambridge Lower Secondary Mathematics 0862 Progression Grid v1.2 49
Lists, tables,
tally
Representing data in two way tables: Tabulate discrete and continuous data, choosing
suitable class intervals where appropriate. Use of ≤, <
for continuous data intervals, e.g.
Continue to use tally charts, frequency tables and
two-way tables where appropriate and explain choice
of data representation.
Use examples that require learners to regroup data in
tables e.g. regroup intervals of 5 into intervals of 10 or
vice versa.
Venn and Carroll Use Venn and Carroll diagrams where appropriate
and explain choice of data representation.
Continue to use Venn and Carroll diagrams where
appropriate and explain choice of data representation.
Continue to use Venn and Carroll diagrams where
appropriate and explain choice of data representation.
Block graph,
pictogram, bar
chart
Introduce dual and compound bar charts with two
categories
e.g. dual bar chart:
Continue to use dual and compound bar charts where
appropriate and explain choice of data representation.
Include compound bar charts with more than two
categories for each bar.
Ensure learners are confident drawing bar charts with
more complicated scales.
Continue to use dual and compound bar charts where
appropriate and explain choice of data representation.
Ensure learners can convert information between dual
and compound bar charts.
Cambridge Lower Secondary Mathematics 0862 Progression Grid v1.2 50
e.g. compound bar chart:
Include bar charts with grouped discrete data in any
sized groups e.g. in 3s (1–3, 4–6, 7–9 etc.)
Waffle diagrams
and pie charts
Use examples where the total frequency is a factor of
360.
Use waffle diagrams that use more than 100 squares
so that learners calculate the percentage and
proportion of each colour, then apply this to pie
charts.
e.g.
Include pie charts that represent different totals to
compare proportion, e.g.
Ensure learners can draw pie charts where the total
frequency is not a factor of 360.
Ensure learners can convert information represented
in bar charts to pie charts and vice versa.
Cambridge Lower Secondary Mathematics 0862 Progression Grid v1.2 51
Frequency
diagrams
Continue to use frequency diagrams for continuous
data where appropriate and explain choice of data
representation.
Learners should be confident in drawing frequency
diagrams for continuous data from the beginning,
including choosing their own scales for frequency.
Continue to represent data as frequency diagrams for
continuous data where appropriate and explain choice
of representation.
Ensure learners can draw frequency diagrams from
tables which use ≤, < for continuous data intervals.
Line graphs Continue to use line graphs where appropriate and
explain choice of data representation.
Include curved lines that require interpretation
Introduce time series graphs to show a trend over
time, e.g.
Use frequency polygons to represent frequency of
grouped data
Cambridge Lower Secondary Mathematics 0862 Progression Grid v1.2 52
Ensure learners see the relationship between
frequency polygons and frequency diagrams for
continuous data, e.g.
Scatter graphs Continue to use scatter graphs where appropriate and
explain choice of data representation.
Use scales such as 1s, 2s, 5s, 10s or decimals such
as 0.5s or 0.1s.
Continue to use scatter graphs where appropriate and
explain choice of data representation.
Ensure learners can draw scatter graphs to compare
data. For example, plot boys’ and girls’ data on the
same graph using a key, or on different graphs, but
using the same scales.
Use examples that develop understanding of
correlation (positive, negative and zero correlation;
draw the line of best fit and use it as a model for the
relationship).
Ensure learners can also describe the strength of the
correlation as strong or weak.
Infographics Represent data as an infographic. Continue to use infographics where appropriate and
explain choice of data representation.
Continue to use infographics where appropriate and
explain choice of data representation.
Stem and leaf Introduce presenting data in stem-and-leaf diagrams Introduce presenting data in back-to-back stem-and-
leaf diagrams
Cambridge Lower Secondary Mathematics 0862 Progression Grid v1.2 53
Stage 7 Stage 8 Stage 9
7Ss.04 Use knowledge of mode, median, mean and
range to describe and summarise large data sets.
Choose and explain which one is the most appropriate
for the context.
8Ss.04 Use knowledge of mode, median, mean and
range to compare two distributions, considering the
interrelationship between centrality and spread.
9Ss.04 Use mode, median, mean and range to
compare two distributions, including grouped data.
Learners should be able to calculate summary statistics for
data presented in a frequency table.
At this stage they do not need to be able to calculate the
mean from a grouped frequency table.
e.g. This is the summary of how many pairs of shoes of each
size a shop sold last month.
Shoe size Frequency
4 4
5 9
6 14
7 11
8 2
Find the mean shoe size, the median shoe size, the modal
shoe size, and the range of the shoe sizes.
Ensure learners understand what each of these measures
mean for this context.
Understand that the median of a data set represents the
central value when the data is placed in order. The median
tends not to be affected by extreme values. The mean
calculation takes into account all data items and so can be
effected by extreme values. If someone with a shoe size of
14 was added to the above data set, consider how it would
affect the value of the mean, median, mode and range.
Learners should be able to compare summary data for two or
more distributions.
e.g. Spelling test results (out of 10)
Boys Girls
Mean 7.1 8.3
Mode 9 8
Median 6 8
Range 9 5
The mean and median suggests that the girls did better in
the spelling test.
The range suggests that the girls scores were closer together
and so more consistent.
Why might the median be a better summary statistic to use
for this data?
Use examples of:
 mode or modal class (include cases where there is no
mode)
 median (not from grouped data)
 mean (not from grouped data)
 range (not from grouped data).
Learners should be able to calculate an estimate for the
mean, the class interval where the median lies, the modal
class interval and an estimate for the range for grouped data.
e.g.
Test score Frequency
0 < t ≤ 20 4
20 < t ≤ 40 11
40 < t ≤ 60 15
60 < t ≤ 80 12
80 < t ≤ 100 8
Find an estimate for the mean, the interval where the median
test score lies, the modal class interval, and an estimate for
the range of the test scores.
Ensure learners understand that when calculating spread
and centrality of grouped data:
 The mean is an estimate
 A precise range cannot be found
 The modal class changes depending on how the data is
grouped (the mode may not lie in the modal class).
The ‘estimate for the range’ should be the maximum possible
value of the range.
0862_LowerSecondary_Mathematics_ProgressionGrid_tcm143-592637.docx

More Related Content

Similar to 0862_LowerSecondary_Mathematics_ProgressionGrid_tcm143-592637.docx

4 ma0 4hr_msc_20140821
4 ma0 4hr_msc_20140821 4 ma0 4hr_msc_20140821
4 ma0 4hr_msc_20140821 AnneRostom
 
Basic Math review sheet.pdf
Basic Math review sheet.pdfBasic Math review sheet.pdf
Basic Math review sheet.pdfNoraima2
 
2023 St Jospeh's College Geelong
2023 St Jospeh's College Geelong2023 St Jospeh's College Geelong
2023 St Jospeh's College GeelongAndrew Smith
 
Tech math 2 day 1 review
Tech math 2   day 1 reviewTech math 2   day 1 review
Tech math 2 day 1 reviewpdkiser
 
Module For Mathematics
Module For Mathematics Module For Mathematics
Module For Mathematics jrbt2014
 
12 practice paper_3_h_-_set_a_mark_scheme
12 practice paper_3_h_-_set_a_mark_scheme12 practice paper_3_h_-_set_a_mark_scheme
12 practice paper_3_h_-_set_a_mark_schemeclaire meadows-smith
 
Compute with scientific notation
Compute with scientific notationCompute with scientific notation
Compute with scientific notationJessica Garcia
 
123a ppt-all-2
123a ppt-all-2123a ppt-all-2
123a ppt-all-2math123a
 
Division algorithms (2)
Division algorithms (2)Division algorithms (2)
Division algorithms (2)Deepa Vanu
 
Mat120 syllabus
Mat120 syllabusMat120 syllabus
Mat120 syllabuschellc14
 
Business Mathematics
Business Mathematics Business Mathematics
Business Mathematics Seenleocario
 
Grade 8-math-quarter-1-pacing-guide (1)22
Grade 8-math-quarter-1-pacing-guide (1)22Grade 8-math-quarter-1-pacing-guide (1)22
Grade 8-math-quarter-1-pacing-guide (1)22raipa mamadaya
 
410629531-G9-WEEK-3 dll.doc
410629531-G9-WEEK-3 dll.doc410629531-G9-WEEK-3 dll.doc
410629531-G9-WEEK-3 dll.docJosephSPalileoJr
 
ACFrOgCUndx2gwZatyTMzxmPUupu5d_2sckQSqN9-E0_zASUZLVnHEnWwdepNxwkHzWB-cIgvYsw7...
ACFrOgCUndx2gwZatyTMzxmPUupu5d_2sckQSqN9-E0_zASUZLVnHEnWwdepNxwkHzWB-cIgvYsw7...ACFrOgCUndx2gwZatyTMzxmPUupu5d_2sckQSqN9-E0_zASUZLVnHEnWwdepNxwkHzWB-cIgvYsw7...
ACFrOgCUndx2gwZatyTMzxmPUupu5d_2sckQSqN9-E0_zASUZLVnHEnWwdepNxwkHzWB-cIgvYsw7...Jovi mcCall '
 
ix-number system-ppt(2).pptx
ix-number system-ppt(2).pptxix-number system-ppt(2).pptx
ix-number system-ppt(2).pptxRajkumarknms
 

Similar to 0862_LowerSecondary_Mathematics_ProgressionGrid_tcm143-592637.docx (20)

Real numbers system
Real numbers systemReal numbers system
Real numbers system
 
4 ma0 4hr_msc_20140821
4 ma0 4hr_msc_20140821 4 ma0 4hr_msc_20140821
4 ma0 4hr_msc_20140821
 
Msm1 fl ch01_03
Msm1 fl ch01_03Msm1 fl ch01_03
Msm1 fl ch01_03
 
Basic Math review sheet.pdf
Basic Math review sheet.pdfBasic Math review sheet.pdf
Basic Math review sheet.pdf
 
Mth10revsheets (1)
Mth10revsheets (1)Mth10revsheets (1)
Mth10revsheets (1)
 
2023 St Jospeh's College Geelong
2023 St Jospeh's College Geelong2023 St Jospeh's College Geelong
2023 St Jospeh's College Geelong
 
Tech math 2 day 1 review
Tech math 2   day 1 reviewTech math 2   day 1 review
Tech math 2 day 1 review
 
Module For Mathematics
Module For Mathematics Module For Mathematics
Module For Mathematics
 
12 practice paper_3_h_-_set_a_mark_scheme
12 practice paper_3_h_-_set_a_mark_scheme12 practice paper_3_h_-_set_a_mark_scheme
12 practice paper_3_h_-_set_a_mark_scheme
 
Compute with scientific notation
Compute with scientific notationCompute with scientific notation
Compute with scientific notation
 
Maths class x
Maths class xMaths class x
Maths class x
 
123a ppt-all-2
123a ppt-all-2123a ppt-all-2
123a ppt-all-2
 
Division algorithms (2)
Division algorithms (2)Division algorithms (2)
Division algorithms (2)
 
Mat120 syllabus
Mat120 syllabusMat120 syllabus
Mat120 syllabus
 
Business Mathematics
Business Mathematics Business Mathematics
Business Mathematics
 
Grade 8-math-quarter-1-pacing-guide (1)22
Grade 8-math-quarter-1-pacing-guide (1)22Grade 8-math-quarter-1-pacing-guide (1)22
Grade 8-math-quarter-1-pacing-guide (1)22
 
410629531-G9-WEEK-3 dll.doc
410629531-G9-WEEK-3 dll.doc410629531-G9-WEEK-3 dll.doc
410629531-G9-WEEK-3 dll.doc
 
ACFrOgCUndx2gwZatyTMzxmPUupu5d_2sckQSqN9-E0_zASUZLVnHEnWwdepNxwkHzWB-cIgvYsw7...
ACFrOgCUndx2gwZatyTMzxmPUupu5d_2sckQSqN9-E0_zASUZLVnHEnWwdepNxwkHzWB-cIgvYsw7...ACFrOgCUndx2gwZatyTMzxmPUupu5d_2sckQSqN9-E0_zASUZLVnHEnWwdepNxwkHzWB-cIgvYsw7...
ACFrOgCUndx2gwZatyTMzxmPUupu5d_2sckQSqN9-E0_zASUZLVnHEnWwdepNxwkHzWB-cIgvYsw7...
 
DLL week 1 G9.docx
DLL week 1 G9.docxDLL week 1 G9.docx
DLL week 1 G9.docx
 
ix-number system-ppt(2).pptx
ix-number system-ppt(2).pptxix-number system-ppt(2).pptx
ix-number system-ppt(2).pptx
 

Recently uploaded

ENGLISH6-Q4-W3.pptxqurter our high choom
ENGLISH6-Q4-W3.pptxqurter our high choomENGLISH6-Q4-W3.pptxqurter our high choom
ENGLISH6-Q4-W3.pptxqurter our high choomnelietumpap1
 
Barangay Council for the Protection of Children (BCPC) Orientation.pptx
Barangay Council for the Protection of Children (BCPC) Orientation.pptxBarangay Council for the Protection of Children (BCPC) Orientation.pptx
Barangay Council for the Protection of Children (BCPC) Orientation.pptxCarlos105
 
Computed Fields and api Depends in the Odoo 17
Computed Fields and api Depends in the Odoo 17Computed Fields and api Depends in the Odoo 17
Computed Fields and api Depends in the Odoo 17Celine George
 
ECONOMIC CONTEXT - PAPER 1 Q3: NEWSPAPERS.pptx
ECONOMIC CONTEXT - PAPER 1 Q3: NEWSPAPERS.pptxECONOMIC CONTEXT - PAPER 1 Q3: NEWSPAPERS.pptx
ECONOMIC CONTEXT - PAPER 1 Q3: NEWSPAPERS.pptxiammrhaywood
 
ISYU TUNGKOL SA SEKSWLADIDA (ISSUE ABOUT SEXUALITY
ISYU TUNGKOL SA SEKSWLADIDA (ISSUE ABOUT SEXUALITYISYU TUNGKOL SA SEKSWLADIDA (ISSUE ABOUT SEXUALITY
ISYU TUNGKOL SA SEKSWLADIDA (ISSUE ABOUT SEXUALITYKayeClaireEstoconing
 
Incoming and Outgoing Shipments in 3 STEPS Using Odoo 17
Incoming and Outgoing Shipments in 3 STEPS Using Odoo 17Incoming and Outgoing Shipments in 3 STEPS Using Odoo 17
Incoming and Outgoing Shipments in 3 STEPS Using Odoo 17Celine George
 
How to do quick user assign in kanban in Odoo 17 ERP
How to do quick user assign in kanban in Odoo 17 ERPHow to do quick user assign in kanban in Odoo 17 ERP
How to do quick user assign in kanban in Odoo 17 ERPCeline George
 
What is Model Inheritance in Odoo 17 ERP
What is Model Inheritance in Odoo 17 ERPWhat is Model Inheritance in Odoo 17 ERP
What is Model Inheritance in Odoo 17 ERPCeline George
 
Earth Day Presentation wow hello nice great
Earth Day Presentation wow hello nice greatEarth Day Presentation wow hello nice great
Earth Day Presentation wow hello nice greatYousafMalik24
 
Difference Between Search & Browse Methods in Odoo 17
Difference Between Search & Browse Methods in Odoo 17Difference Between Search & Browse Methods in Odoo 17
Difference Between Search & Browse Methods in Odoo 17Celine George
 
Proudly South Africa powerpoint Thorisha.pptx
Proudly South Africa powerpoint Thorisha.pptxProudly South Africa powerpoint Thorisha.pptx
Proudly South Africa powerpoint Thorisha.pptxthorishapillay1
 
How to Add Barcode on PDF Report in Odoo 17
How to Add Barcode on PDF Report in Odoo 17How to Add Barcode on PDF Report in Odoo 17
How to Add Barcode on PDF Report in Odoo 17Celine George
 
Full Stack Web Development Course for Beginners
Full Stack Web Development Course  for BeginnersFull Stack Web Development Course  for Beginners
Full Stack Web Development Course for BeginnersSabitha Banu
 
Science 7 Quarter 4 Module 2: Natural Resources.pptx
Science 7 Quarter 4 Module 2: Natural Resources.pptxScience 7 Quarter 4 Module 2: Natural Resources.pptx
Science 7 Quarter 4 Module 2: Natural Resources.pptxMaryGraceBautista27
 
Grade 9 Q4-MELC1-Active and Passive Voice.pptx
Grade 9 Q4-MELC1-Active and Passive Voice.pptxGrade 9 Q4-MELC1-Active and Passive Voice.pptx
Grade 9 Q4-MELC1-Active and Passive Voice.pptxChelloAnnAsuncion2
 

Recently uploaded (20)

ENGLISH6-Q4-W3.pptxqurter our high choom
ENGLISH6-Q4-W3.pptxqurter our high choomENGLISH6-Q4-W3.pptxqurter our high choom
ENGLISH6-Q4-W3.pptxqurter our high choom
 
Barangay Council for the Protection of Children (BCPC) Orientation.pptx
Barangay Council for the Protection of Children (BCPC) Orientation.pptxBarangay Council for the Protection of Children (BCPC) Orientation.pptx
Barangay Council for the Protection of Children (BCPC) Orientation.pptx
 
Computed Fields and api Depends in the Odoo 17
Computed Fields and api Depends in the Odoo 17Computed Fields and api Depends in the Odoo 17
Computed Fields and api Depends in the Odoo 17
 
ECONOMIC CONTEXT - PAPER 1 Q3: NEWSPAPERS.pptx
ECONOMIC CONTEXT - PAPER 1 Q3: NEWSPAPERS.pptxECONOMIC CONTEXT - PAPER 1 Q3: NEWSPAPERS.pptx
ECONOMIC CONTEXT - PAPER 1 Q3: NEWSPAPERS.pptx
 
ISYU TUNGKOL SA SEKSWLADIDA (ISSUE ABOUT SEXUALITY
ISYU TUNGKOL SA SEKSWLADIDA (ISSUE ABOUT SEXUALITYISYU TUNGKOL SA SEKSWLADIDA (ISSUE ABOUT SEXUALITY
ISYU TUNGKOL SA SEKSWLADIDA (ISSUE ABOUT SEXUALITY
 
Incoming and Outgoing Shipments in 3 STEPS Using Odoo 17
Incoming and Outgoing Shipments in 3 STEPS Using Odoo 17Incoming and Outgoing Shipments in 3 STEPS Using Odoo 17
Incoming and Outgoing Shipments in 3 STEPS Using Odoo 17
 
How to do quick user assign in kanban in Odoo 17 ERP
How to do quick user assign in kanban in Odoo 17 ERPHow to do quick user assign in kanban in Odoo 17 ERP
How to do quick user assign in kanban in Odoo 17 ERP
 
LEFT_ON_C'N_ PRELIMS_EL_DORADO_2024.pptx
LEFT_ON_C'N_ PRELIMS_EL_DORADO_2024.pptxLEFT_ON_C'N_ PRELIMS_EL_DORADO_2024.pptx
LEFT_ON_C'N_ PRELIMS_EL_DORADO_2024.pptx
 
What is Model Inheritance in Odoo 17 ERP
What is Model Inheritance in Odoo 17 ERPWhat is Model Inheritance in Odoo 17 ERP
What is Model Inheritance in Odoo 17 ERP
 
Earth Day Presentation wow hello nice great
Earth Day Presentation wow hello nice greatEarth Day Presentation wow hello nice great
Earth Day Presentation wow hello nice great
 
Difference Between Search & Browse Methods in Odoo 17
Difference Between Search & Browse Methods in Odoo 17Difference Between Search & Browse Methods in Odoo 17
Difference Between Search & Browse Methods in Odoo 17
 
YOUVE_GOT_EMAIL_PRELIMS_EL_DORADO_2024.pptx
YOUVE_GOT_EMAIL_PRELIMS_EL_DORADO_2024.pptxYOUVE_GOT_EMAIL_PRELIMS_EL_DORADO_2024.pptx
YOUVE_GOT_EMAIL_PRELIMS_EL_DORADO_2024.pptx
 
Model Call Girl in Tilak Nagar Delhi reach out to us at 🔝9953056974🔝
Model Call Girl in Tilak Nagar Delhi reach out to us at 🔝9953056974🔝Model Call Girl in Tilak Nagar Delhi reach out to us at 🔝9953056974🔝
Model Call Girl in Tilak Nagar Delhi reach out to us at 🔝9953056974🔝
 
Proudly South Africa powerpoint Thorisha.pptx
Proudly South Africa powerpoint Thorisha.pptxProudly South Africa powerpoint Thorisha.pptx
Proudly South Africa powerpoint Thorisha.pptx
 
How to Add Barcode on PDF Report in Odoo 17
How to Add Barcode on PDF Report in Odoo 17How to Add Barcode on PDF Report in Odoo 17
How to Add Barcode on PDF Report in Odoo 17
 
Full Stack Web Development Course for Beginners
Full Stack Web Development Course  for BeginnersFull Stack Web Development Course  for Beginners
Full Stack Web Development Course for Beginners
 
Raw materials used in Herbal Cosmetics.pptx
Raw materials used in Herbal Cosmetics.pptxRaw materials used in Herbal Cosmetics.pptx
Raw materials used in Herbal Cosmetics.pptx
 
Science 7 Quarter 4 Module 2: Natural Resources.pptx
Science 7 Quarter 4 Module 2: Natural Resources.pptxScience 7 Quarter 4 Module 2: Natural Resources.pptx
Science 7 Quarter 4 Module 2: Natural Resources.pptx
 
Grade 9 Q4-MELC1-Active and Passive Voice.pptx
Grade 9 Q4-MELC1-Active and Passive Voice.pptxGrade 9 Q4-MELC1-Active and Passive Voice.pptx
Grade 9 Q4-MELC1-Active and Passive Voice.pptx
 
TataKelola dan KamSiber Kecerdasan Buatan v022.pdf
TataKelola dan KamSiber Kecerdasan Buatan v022.pdfTataKelola dan KamSiber Kecerdasan Buatan v022.pdf
TataKelola dan KamSiber Kecerdasan Buatan v022.pdf
 

0862_LowerSecondary_Mathematics_ProgressionGrid_tcm143-592637.docx

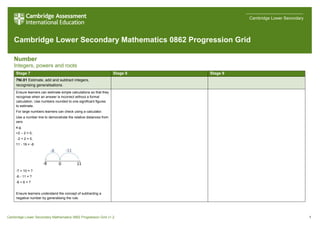
  • 1. Cambridge Lower Secondary Mathematics 0862 Progression Grid v1.2 1 Cambridge Lower Secondary Cambridge Lower Secondary Mathematics 0862 Progression Grid Number Integers, powers and roots Stage 7 Stage 8 Stage 9 7Ni.01 Estimate, add and subtract integers, recognising generalisations. Ensure learners can estimate simple calculations so that they recognise when an answer is incorrect without a formal calculation. Use numbers rounded to one significant figures to estimate. For large numbers learners can check using a calculator. Use a number line to demonstrate the relative distances from zero e.g. +2 – 2 = 0, -2 + 2 = 0, 11 - 19 = -8 -7 + 10 = ? -6 - 11 = ? -8 + 6 = ? Ensure learners understand the concept of subtracting a negative number by generalising the rule.
  • 2. Cambridge Lower Secondary Mathematics 0862 Progression Grid v1.2 2 7 - 2 = 5 7 - 1 = 6 7 - 0 = 7 7 - (-1) = 8 7 - (-2) = ? 7 - (-3) = ? Encourage learners to discuss calculations where a range of misconceptions have occurred. e.g. which of the following are incorrect? What mistakes have been made? 5 - 7 = 2 -5 - 4 = 9 5 - (-2) = -7 7Ni.02 Understand that brackets, positive indices and operations follow a particular order. 8Ni.01 Understand that brackets, indices (square and cube roots) and operations follow a particular order. The correct order of operations is: Brackets Indices Division/multiplication Addition/subtraction Start with any numbers inside brackets, going from left to right, then indices and so on. e.g. 15 - 22 = 15 – 4 because indices are calculated first and subtracted from 15 and not 15 – 22 = 132 Introduce examples with both addition and subtraction e.g. 9 - 3 + 4 =6 + 4 =10 NOT 9 – 3 + 4 = 9 - 7 = 2 The correct order of operations is: Brackets Indices, square and cube roots Division/multiplication Addition/subtraction Start with any numbers inside brackets, going from left to right, then indices and so on. e.g. 20 – 15 x √25 = 20 – 15 x 5 = 20 – 75 = -55 Use examples where learners have to explain the order of operations. e.g. Why are these different? A) √ (42 + 9) B) (√4 + 9)2
  • 3. Cambridge Lower Secondary Mathematics 0862 Progression Grid v1.2 3 Investigate situations where changing the operations in the question or inserting / removing brackets will change the answer. e.g. How many different answers can be found using four 4s and any combination of + - x ÷ and brackets? (4 + 4) - 4 + 4 = 8 Insert brackets to make this calculation correct 42 + 4 x 2 = 40 7Ni.03 Estimate, multiply and divide integers including where one integer is negative. 8Ni.02 Estimate, multiply and divide integers, recognising generalisations. Ensure learners can estimate simple calculations so that they recognise when an answer is incorrect without a formal calculation. For large numbers learners can check using a calculator. Use examples that use times tables so that learners are familiar with the numbers. e.g. 5 x ( – 6) = - 30 -30 ÷ 5 = - 6 At this stage do not use examples that multiply and divide negative integers by negative integers. Use calculations involving positive and negative numbers to list other calculations that can be derived e.g. If I know that -288 ÷ 24 = -12 What other calculations can I derive? (-12 x 24 = -228 and so on). Ensure learners can estimate simple calculations so that they recognise when an answer is incorrect without a formal calculation. For large numbers learners can check using a calculator. e.g. –7 × (–6); 48 ÷ (–8) Use many examples so that learners determine the rules for multiplication and division (similar to addition and subtraction) of positive and negative numbers without rote learning. Give learners a range of calculations, some of which are incorrect and ask them to identify the errors made. e.g. -8 x -9 = -72 (-10)2 = -100 7Ni.04 Understand lowest common multiple and highest common factor (numbers less than 100). 8Ni.03 Understand factors, multiples, prime factors, highest common factors and lowest common multiples. Include examples where a listing strategy can be used. e.g. e.g. Construct a factor tree and write a number as a product of its prime factors e.g. 500 = 22 × 53
  • 4. Cambridge Lower Secondary Mathematics 0862 Progression Grid v1.2 4 The multiples of 3 are 3, 6, 9, 12, 15, 18, 21, 24… The multiples of 4 are 4, 8, 12, 16, 20, 24 … The common multiples of 3 and 4 are 12, 24, … The lowest common multiple of 3 and 4 is 12. Note that the Highest Common Factor (HCF) is the same as the Greatest Common Divisor. e.g. Factors of 36 are: 1, 2, 3, 4, 6, 9, 12, 18, 36 Factors of 48 are: 1, 2, 3, 4, 6, 8, 12, 16, 24, 48 The HCF of 36 and 48 is 12. Use prime factorisation to find the LCM or HCF of two numbers e.g. 40 = 2 x 2 x 2 x 5 28 = 2 x 2 x 7 LCM = 2 x 2 x 2 x 5 x 7 = 280 HCF = 2 x 2 = 4 7Ni.05 Use knowledge of tests of divisibility to find factors of numbers greater than 100. Ensure learners are aware of the divisibility rules for numbers between 2 and 10 25 – last two digits are 00, 25, 50 or 75 100 – last 2 digits are 00 e.g. The number 162 is divisible by 9 and also divisible by 3 because 1 + 6 + 2 = 9 and nine is divisible by 3.
  • 5. Cambridge Lower Secondary Mathematics 0862 Progression Grid v1.2 5 8Ni.04 Understand the hierarchy of natural numbers, integers and rational numbers. 9Ni.01 Understand the difference between rational and irrational numbers. Learners should be able to represent the hierarchy in a Venn diagram. Ask questions such as: Write down a number from the list “-4, 0.5, 16.3, π, 10,000” that is: a) a rational number b) an integer c) a natural number Tick all the correct statements: a) 3 is a rational number b) -3 is a rational number c) 3 is a natural number d) -3 is a natural number e) 3 is an integer f) -3 is an integer Ensure learners understand that integers and natural numbers are rational and that fractions (with integer numerator and denominator), terminating decimals or recurring decimals are also rational. Ensure learners understand that some roots (e.g. √2, √3, √5) are irrational but some roots are rational (e.g. √4 is rational as it is equal to 2). Ensure learners understand that π is an example of an irrational number. Learners are expected to understand that negative roots do not belong to the set of rational or irrational numbers. Ask questions such as: Circle the number from the list below that is irrational: -4, 0.5, 16.3, π, 10,000, √25 Circle all the rational numbers: -4, 0.5, π, √2, 10, ½ Tick the correct boxes Rational Irrational 5 √25 √2 ½ Explore connections between rational and irrational numbers Ask learners to find: two irrational numbers whose product is rational e.g. use a calculator to work out √2 x √8 √3 x √12
  • 6. Cambridge Lower Secondary Mathematics 0862 Progression Grid v1.2 6 8Ni.05 Use positive and zero indices, and the index laws for multiplication and division. 9Ni.02 Use positive, negative and zero indices, and the index laws for multiplication and division. e.g. know that 70 = 1, 72 × 73 = 75 , (153 )2 = 156 1114 ÷ 1112 = 112 e.g. know that 2–3 = 1 23 , 1110 ÷ 1112 = 11–2 9Ni.03 Understand the standard form for representing large and small numbers. Standard form is the same as scientific notation. 2530000 = 2.53 x 10⁶ and not 253 x 104 or 25.3 x 10⁵ 0.00568 = 5.68 x 10⁻³ 7Ni.06 Understand the relationship between squares and corresponding square roots, and cubes and corresponding cube roots. 8Ni.06 Recognise squares of negative and positive numbers, and corresponding square roots. 9Ni.04 Use knowledge of square and cube roots to estimate surds. Positive squares only. Ensure learners can estimate simple calculations so that they recognise when an answer is incorrect without a formal calculation. Learners can check using a calculator where appropriate. Ensure learners use the notation for square, cube and square root. Ensure learners recognise the relationship between square and square roots (and cube and cube roots) as inverse operations. e.g. 25² = 625 and √625 = √252 = 25. 33 = 27 so 3 √27 = 3 Ensure learners can estimate simple calculations so that they recognise when an answer is incorrect without a formal calculation. Learners can check using a calculator where appropriate. Ensure learners recognise that the square root of a number may have positive or negative answers e.g. The square root of 25 is 5 or -5 because 5 x 5 = 52 = 25 and (-5) x (-5) = (-5)2 = 25 Ensure learners can estimate simple calculations so that they recognise when an answer is incorrect without a formal calculation. Learners can check using a calculator where appropriate. e.g. recognise that √9 < √10 < √16 so 3 < √10 < 4 Ensure learners know that when the answer to a square or cube root is irrational (e.g.√5 = 2.223606… or 3 √30 = 3.107232…) it is referred to as a surd. 8Ni.07 Recognise positive and negative cube numbers, and the corresponding cube roots. Ensure learners understand the equivalence of the notation 3 √-64 = 3 √(-4)3 = 3 √(-4) x (-4) x (-4) = -4
  • 7. Cambridge Lower Secondary Mathematics 0862 Progression Grid v1.2 7 Number Place value, ordering and rounding Stage 7 Stage 8 Stage 9 7Np.01 Use knowledge of place value to multiply and divide whole numbers and decimals by any positive power of 10. 8Np.01 Use knowledge of place value to multiply and divide integers and decimals by 0.1 and 0.01. 9Np.01 Multiply and divide integers and decimals by 10 to the power of any positive or negative number. e.g. 5 x 105 = 500 000 7 ÷ 103 = 0.007 Ensure learners recognise the notation for positive powers of 10 100 = 1 101 = 10 102 =100 103 = 1 000 104 = 10 000 105 = 100 000 etc. e.g. 0.235 ÷ 0.1 = 2.35 0.235 × 0.1 = 0.0235 Ensure learners understand the position of the decimal point when multiplying and dividing by 1 10 s (tenths). When dividing by 0.1 or 0.01 consider equivalent calculations 3.5 ÷ 0.1 is the same as 35 ÷ 1 43.7 ÷ 0.01 is the same as 437 ÷ 0.1 and 4 370 ÷ 1 e.g. 2.4 x 105 = 240 000 5.82 x 10-3 = 0.00582 Ensure learners understand the different representations of powers of ten: 0.1 = 1 10 = 10−1; 0.01 = 1 100 = 1 10 2 = 10−2 7Np.02 Round numbers to a given number of decimal places. 8Np.02 Round numbers to a given number of significant figures. 9Np.02 Understand that when a number is rounded there are upper and lower limits for the original number. e.g. round 5.6470299 to 2 decimal places (d.p.) (5.65) Use examples that give solutions to problems with an appropriate degree of accuracy. Learners can use calculators to find the answer to a question and then round the answer. e.g. round 34 627 to 2 significant figures (35 000) Round 2.8963 to 3 significant figures (2.90) With the number 593 247 the 5 is the most significant digit, because the number is 5 hundred thousand and something. If a number was rounded to the nearest 10 to be 460, learners understand that the original number could be any number between 455 (including) and 465 (excluding). Ensure learners can use inequality notation to describe the limits (bounds) on the original number, 𝑥. e.g. 455 ≤ 𝑥 < 465
  • 8. Cambridge Lower Secondary Mathematics 0862 Progression Grid v1.2 8 e.g. They use the calculator to find √62 = 7.874007874 ⋯ and round to 2 decimal places to get to 7.87 Then 9 is the next most significant, and so on. 593 247 correct to 1 significant figure is 600 000 With the number 0.0000057263, the 5 is the most significant digit, because it tells us that the number is 5 millionths and something. The 7 is the next most significant, and so on. 0.0000057263 rounded to 2 significant figures is 0.0000057 Use examples that give solutions to problems with an appropriate degree of accuracy Use examples where zero is used as a place holder e.g. Round 20 435 to 3 s.f. 20 400 0.2056 to 2 s.f. 0.21 40 505 to 2 s.f. 41 000 This will assist learners in their preparation for understanding and using bounds at IGCSE.
  • 9. Cambridge Lower Secondary Mathematics 0862 Progression Grid v1.2 9 Number Fractions, decimals, percentages, ratio and proportion Stage 7 Stage 8 Stage 9 7Nf.01 Recognise that fractions, terminating decimals and percentages have equivalent values. 8Nf.01 Recognise fractions that are equivalent to recurring decimals. 9Nf.01 Deduce whether fractions will have recurring or terminating decimal equivalents. Ensure learners understand that:  a percentage can be written as a fraction out of 100  place value can help to convert decimals into fractions with a denominator of 10, 100, 1000 and vice versa. e.g. 31% = 31 100 = 0.31 0.7 = 7 10 = 70% 0.43 = = 43% 0.047 = = 4.7% Use examples where learners are required to show the equivalence between fractions, decimals and percentages F D P 1 2 0.25 75% 1 10 0.3 1 5 23% 0.31 13.2% Ensure learners can interpret fractions as a division. e.g. 3 8 can be converted to a decimal by dividing 3 by 8 (3 ÷ 8 = 0.375) Ensure learners can interpret fractions as division and that some decimal representations of fractions will terminate and some will recur. e.g. 3 4 = 3 ÷ 4 =0.75 so this is terminating 1 3 = 1 ÷ 3 = 0.33333… 0. 3̇ so this is recurring Encourage learners to work systematically to convert unit fractions to decimal equivalents using a written method so they can notice patterns F D 1 2 1 3 1 4 1 5 1 6 1 7 1 8 1 9 1 10 1 11 1 12 e.g. Learners know 1 9 = 0. 1̇ So, 4 9 = 4 × 1 9 = 4 × 0. 1̇ = 0. 4̇ Ensure learners know that if 3 is a factor of the denominator of the fraction (when in its simplest form) then it will result in a recurring decimal. e.g. 1 9 must be recurring as 1 3 = 0. 3̇ and because 1 3 = 3 9 = 3 x 1 9 Consider which denominators result in recurring decimals. e.g. If the denominator is a multiple of 7 will it recur? Does 5 14 recur when converted to a fraction? What about 7 14 ? 100 43 1000 47
  • 10. Cambridge Lower Secondary Mathematics 0862 Progression Grid v1.2 10 Use examples that include improper fractions and mixed numbers. 1.245 = 124.5% = 249 200 Use examples where learners convert non-unit fractions to decimals e.g. 3 7 3÷7 = 0.428571… 7Nf.02 Estimate and add mixed numbers, and write the answer as a mixed number in its simplest form. 8Nf.02 Estimate and subtract mixed numbers, and write the answer as a mixed number in its simplest form. 9Nf.02 Estimate, add and subtract proper and improper fractions, and mixed numbers, using the order of operations. Use examples that add mixed numbers with the same and different denominators. Learners can use any method but should consider which is most efficient. e.g. Learners understand when the most effective point to regroup numbers is. 3 4 5 + 2 3 10 = 3 8 10 + 2 3 10 = 5 11 10 = 6 1 10 require regrouping of the mixed number rather than converting to improper fractions. Learners express answers greater than one as a mixed number, and reduce all fractions to their simplest form. Use examples that subtract mixed numbers with the same and different denominators. e.g 2 3 7 – 1 1 5 Learners can use any method but should consider which is most efficient. e.g. learners understand that they need to regroup the first number. 3 1 5 - 2 3 5 = 2 6 5 - 2 3 5 = 3 5 Learners express answers greater than one as a mixed number, and reduce all fractions to their simplest form. e.g. in 1 3 8 − ( 2 5 + 1 2 ) we calculate the fractions in the brackets first 1 3 8 – ( 9 10 ) = 55 40 – 36 40 = 19 40 Ensure learners are also able to apply learning from 9Nf.03 to use the order of operations with multiplication and division as well as addition and subtraction. e.g. 5 3 7 – 1 1 5 x 7 2 We calculate the multiplication first 5 3 7 - 4 1 5 = 1 8 35 e.g. (1 − 3 4 ) ÷ (1 − 1 8 ) 7Nf.03 Estimate, multiply and divide proper fractions. 8Nf.03 Estimate and multiply an integer by a mixed number, and divide an integer by a proper fraction. 9Nf.03 Estimate, multiply and divide fractions, interpret division as a multiplicative inverse, and cancel common factors before multiplying or dividing.
  • 11. Cambridge Lower Secondary Mathematics 0862 Progression Grid v1.2 11 e.g. 7 12 × 4 12 = 28 144 Learners should be able to simplify answers although some learners may do this in stages. e.g. 28 144 = 14 72 = 7 36 Learners become aware that fractions like 4 12 could be simplified before the fractions are multiplied and once fluent, learners may cross cancel before multiplying to improve efficiency. e.g. For multiplication: Ensure learners understand that, when an operator is less than one (proper fraction) the answer will be smaller than the original quantity. e.g. 3 4 x 1 6 = 1 8 and 1 8 is smaller than 3 4 and 1 6 For division: Ensure learners appreciate that for example dividing by 1 3 is the same as multiplying by 3 and develop the idea that for example dividing by 2 3 is the same as multiplying by 3 2 . Learners understand that dividing by a fraction is the same as multiplying by its reciprocal. Ensure learners understand that, when an operator is less than one (proper fraction) the answer will be bigger than the original quantity. e.g. 5/ Learners should be able to multiply integers by mixed numbers by partitioning e.g. 20 × 1 3 8 , 20 x 1 = 20 Learners should also understand that converting the mixed number to an improper fraction before multiplying will result in the same answer. Learners should be able to divide integers by unit fractions initially, understanding that, for example, dividing an integer by 1 2 is the same as multiplying by 2 as they are counting up how many halves are needed to make that integer. e.g. Learners should know that when they divide A by B it means how many lots of B are in A, rather than systematically learning a rule to calculate the answer. e.g. 12 ÷ 3 4 means how many 3 4 are there in 12. The answer is 16 Learners should understand that dividing an integer by a fraction is the same as multiplying by its reciprocal. e.g. e.g. Use examples that use a combination of proper and improper fractions with mixed numbers or integers. Learners will need to be able to change mixed numbers into improper fractions e.g. Ensure learners understand that proper and improper fractions, and mixed numbers can act as operators that either increase or decrease the original value. e.g. when a quantity is multiplied by a mixed number/improper fraction then the answer is larger than the original quantity. When a quantity is divided by a mixed number/improper fraction then the answer is smaller than the original quantity. e.g. 20 × 1 1 2 = 30 20 ÷ 1 1 2 = 13 1 3 27 7 9 1 3 7 9 4 12 7     6 5 24 20 3 4 8 5 4 3 8 5      2 1 7 8 4 7 8 60 8 3 20     2 1 27 2 1 7 20   10 2 5 2 1 5     63 9 7 9 1 7     16 3 48 3 4 12 16 4 3 12      10 3 1 10 13 2 13 5 1 22 13 5 11 22 13 5 1 2        5 2 3 4 1 1 
  • 12. Cambridge Lower Secondary Mathematics 0862 Progression Grid v1.2 12 and 5 6 is bigger than 5 8 7Nf.04 Use knowledge of common factors, laws of arithmetic and order of operations to simplify calculations containing decimals or fractions. 8Nf.04 Use knowledge of the laws of arithmetic and order of operations (including brackets) to simplify calculations containing decimals or fractions. 9Nf.04 Use knowledge of the laws of arithmetic, inverse operations, equivalence and order of operations (brackets and indices) to simplify calculations containing decimals and fractions. Encourage learners to work mentally where appropriate to select an efficient strategy for the problem. Use examples with decimals only or proper fractions only, not combined, and of multiplying decimals by integers (not decimal x decimal) e.g. 0.5 x 7 x 10 = 0.5 x 10 x 7 =5 x 7 = 35 4.7 × 9 = 4.7 × (10 – 1) = 47 – 4.7 = 42.3 3 5 x 2 3 + 4 5 = 11 5 Encourage learners to work mentally where appropriate to select an efficient strategy for the problem. Use examples - with decimals only or fractions only, not combined. 3 5 x ( 2 3 + 4 5 ) = 66 75 = 22 25 - that use one or more of the four operations. (0.3 + 0.1) x 1.2=0.48 - of multiplying decimals by decimals. 4 × 7.6 × 2.5 = 4 × 2.5 × 7.6 = 10 × 7.6 = 76 4.7 × 9.9 = 4.7 × (10 – 0.1) = 47 – 0.47 = 46.53 Encourage learners to work mentally where appropriate to select an efficient strategy for the problem. Use examples that use one or more of the four operations and a mix of fractions and decimals e.g. ( 1 2 + 6.5) 2 –1 = 48 2.5 × 2.5 × 12 = 5 2 × 5 2 × 12 = 5 × 5 × 3 = 75 3.64 × 52 = 364 100 × 25 = 364 100 × 100 4 = 364 ÷ 4= 91 7Nf.05 Recognise percentages of shapes and whole numbers, including percentages less than 1 or greater than 100. 8Nf.05 Understand percentage increase and decrease, and absolute change. 9Nf.05 Understand compound percentages. e.g. 1 2 % is half of 1% 1 2 % of 400 = 2 e.g. finding 1 2 % or 0.5% of a quantity can be confused with finding 50% e.g. 2 1 2 = 2.5 = 250% Express any quantity as a percentage of another. e.g. increase $300 by 20% Ensure learners can use multipliers to increase and decrease by a percentage Increase $300 by 20% $300 x 1.2=$360 Decrease £200 by 15% £200 x 0.85 = £170 e.g. If an item priced at $200 has a 10% increase in price then the new price is $220. If this price is followed by a 10% decrease (a decrease of $22), the final price will be $198, not the original price of $200. e.g. If a new car which costs $11,000 decreases in price by 10% each year, how many years will it be before the car is worth less than $6,000? What situations could these calculations represent? A) 600 x 1.047
  • 13. Cambridge Lower Secondary Mathematics 0862 Progression Grid v1.2 13 If I have a block of wood that is 25 centimetres long and I cut a piece from it that is 19 centimetres long, what percentage did I cut? What percentage will be left? Understand the multiplicative relationship of percentage e.g. 300% is an increase by a factor of 3, 300% of 50 is 150 (which is a 200% increase) If the price of a packet of sweets increases from $1.50 to $4.50 then this is 300% of the original amount since this is the new price is three times the original price and this represents a 200% increase. Ensure learners understand that if the price of an item increases by 10% then the final price is 110% of the initial price (100% + 10% = 110%) Use examples that require learners to understand percentage decrease and absolute change e.g. 120 decreased by 200% = -120 and absolute change is - 120 -120 = - 240 An increase of 800% means the final amount is 9 times the original (100% + 800% = 900% = 9 times as large). B) 800 x 0.953 7Nf.06 Understand the relative size of quantities to compare and order decimals and fractions, using the symbols =, ≠, > and <. 8Nf.06 Understand the relative size of quantities to compare and order decimals and fractions (positive and negative), using the symbols =, ≠, >, <, ≤ and ≥. e.g. order proper fractions and improper fractions 3 4 , 2 3 , 4 3 and 3 2 e.g. order from smallest to largest 3 5 , 11 20 , 5 8 and 8 15 Using the symbols =, ≠, > and < ask learners to order and compare values. e.g. given that 3.164 < x < 3.167 write down a possible value for x. e.g. given that 3 1 5 < 𝑥 < 3 1 4 write down a possible value for x. e.g. compare a mark of 43 out of 55 to a mark of 80% Using the symbols =, ≠, >, <, ≤ and ≥ ask learners to order and compare values. e.g. Understand that 4.17≤ 𝑥 < 4.34 x represents any value in the range 4.17 inclusive to 4.34 exclusive. Ensure learners understand that when they are ordering and comparing fractions:  For the same denominator, the larger the numerator the larger the fraction.  For the same numerator, the larger the denominator the smaller the fraction e.g. insert the correct symbol (< or >) 11 7 11 8
  • 14. Cambridge Lower Secondary Mathematics 0862 Progression Grid v1.2 14 Ensure learners understand that to compare 37 65 with 48 4 decimals or percentages are more efficient than fractions. e.g. decide the better buy between a 500 g packet of rice at $0.35, or a packet with 500 g + 25% extra at $0.39 7Nf.07 Estimate, add and subtract positive and negative numbers with the same or different number of decimal places. e.g. Three children took part in a long jump competition. John jumped 1.2m, Mary jumped 0.15m further than John, Fatima jumped 0.3m less than Mary. How far did Fatima jump? Ensure learners can calculate with negative numbers and decimals e.g. –7.18 + 3.9 1.208 – (0.7 + 2.41) 7Nf.08 Estimate, multiply and divide decimals by whole numbers. 8Nf.07 Estimate and multiply decimals by integers and decimals. 9Nf.06 Estimate, multiply and divide decimals by integers and decimals. e.g. 13.27 × 10⁸ 4.132 ÷ 5 5.025 ÷ 25 Ensure learners can continue a division to a specified number of decimal places. e.g. Write 12.55 ÷ 7 to 1 d.p 12.55 ÷ 7 = 1.79… So 12.55 ÷ 7=1.8 to 1d.p. Use examples with positive decimals and positive and negative integers. e.g. -2 x 0.4 = -0.8 0.45 x 0.56 Consider patterns to develop an understanding of where to place the decimal point e.g. 0.2 x 3 = 0.6 0.2 x 0.3 = 0.06 Use examples with both positive and negative decimals and integers. e.g.  2.34 × 2.9  43.32 ÷ 0.12  –2.7 ÷ 3  –3 × –6 × –0.5 e.g. If we know that 2.88÷0.24=12 What other calculations can you deduce? 37 23 41 23
  • 15. Cambridge Lower Secondary Mathematics 0862 Progression Grid v1.2 15 0.2 x 0.03 = 0.006 (12 x 0.24 = 2.88 and so on) Ensure learners recognise the effects of multiplying and dividing by decimals between 0 and 1. e.g. Learners should be able to recognise, without doing a calculation, whether the answer to 3.784 ÷ 0.916 will be bigger or smaller than 3.784 8Nf.08 Estimate and divide decimals by numbers with one decimal place. Use examples with positive decimals and positive and negative integers. e.g. -2 x 0.4 = -0.8 4 ÷ 0.5 = 8 0.45 x 0.56 5.21 ÷ 0.2 Consider equivalent calculations to develop understanding e.g. 4.8 ÷ 0.6 is equivalent to 48 ÷ 6 7Nf.09 Understand and use the unitary method to solve problems involving ratio and direct proportion in a range of contexts. 8Nf.09 Understand and use the relationship between ratio and direct proportion. 9Nf.07 Understand the relationship between two quantities when they are in direct or inverse proportion. Ensure learners understand that once the value of 1 unit is known, the value of multiple units can be found by multiplying e.g. if 12 tins of paint weigh 30kg, how much will 5 tins weigh? The first step in solving this is to find what ONE tin weighs. This will be 30 12 so 2.5kg. Scaling this back up for 5 tins gives 5 x 2.5 = 12.5kg Include examples in context. e.g. - Recipes: When A and B share money in the ratio 4:3, it means that A gets 4 7 of the money and B gets 3 7 Ensure learners can express a given ratio as proportion. e.g. The ratio of red to blue counters in a bag is 5:4 What proportion are red? ( 5 9 ) Hannah says she thinks there are 64 counters in the bag altogether. Is she correct? Ensure learners can identify and give examples of both direct and indirect proportion and understand the difference between them. Use simple examples of inverse proportion. e.g. An athlete runs a race and takes 120 seconds to finish. If he runs double the speed, how long will it take him? e.g. It takes 12 builders 2 weeks to build a garage. How long would it take 6 builders to do the same job?
  • 16. Cambridge Lower Secondary Mathematics 0862 Progression Grid v1.2 16 300g of sugar makes 12 biscuits. How much sugar is needed for 5 biscuits? - Currencies: David exchanged 350 Euros and received $400. How much is 1 Euro worth in dollars? Ben received $6000. How many Euros did he pay? Ensure learners can express given proportions as a ratio. e.g. There are some blue and red beads on a bracelet. 2 5 of the beads are blue. What is the ratio of blue to red beads? (2:3) Ensure learners can also use equivalence to compare proportions. e.g. A has yellow and red sweets in the ratio 20:480 B has yellow and red sweets in the ratio 15:385 Who has the greater proportion of yellow sweets? 7Nf.10 Use knowledge of equivalence to simplify and compare ratios (same units). 8Nf.10 Use knowledge of equivalence to simplify and compare ratios (different units). Ensure learners understand that the simplest form contains no decimals or fractions so 1:1.5 in its simplest form is 2:3 Ensure learners understand that when simplifying a ratio the relationship between the parts of the ratio does not change but the quantities may increase or decrease. e.g. 10:25 simplifies to 2:5 If 10 changes to 2 (5 times less) then 25 must change to 5 in the same relationship (5 times less). Use examples with the same units e.g. cm and cm A model of a house is 30cm tall. The house is 500cm tall. Write the ratio of the model height to the house height in its simplest form. 30cm:500cm 3:50 Ensure learners can use equivalence to compare ratios to solve a problem. e.g. 30 biscuits cost $1 Use examples with different units e.g. m and cm A model of a house is 30cm tall. The house is 5m tall. Write the ratio of the model height to the house height in its simplest form. 30cm:5m 30cm:500cm 3:50 Ensure learners can use equivalence to compare ratios to solve a problem including different units of measure. e.g. 3 cups hold 1300ml 4 mugs hold 1.5L Which will hold more liquid, one cup or one mug?
  • 17. Cambridge Lower Secondary Mathematics 0862 Progression Grid v1.2 17 45 biscuits cost $1.80 Which is best value? 30:$1 is the same as 15:50p 45:$1.80 is the same as 15:60c 7Nf.11 Understand how ratios are used to compare quantities to divide an amount into a given ratio with two parts. 8Nf.11 Understand how ratios are used to compare quantities to divide an amount into a given ratio with two or more parts. 9Nf.08 Use knowledge of ratios and equivalence for a range of contexts. Ensure learners can share a quantity into a given ratio (two parts). e.g. Share 70 sweets between A and B, in the ratio 6:4 Use a table or diagram to assist learners. A 6 42 B 4 28 Total 10 70 Consider the fraction of the sweets each person will get A will get 6 10 ( 42 70 ) and B will get 4 10 ( 28 70 ). Use examples of simplifying ratios with more than 2 parts. e.g. 18:27:63 simplified to 2:3:7 Ensure learners can share a quantity into a given ratio (include examples with more than two parts). E.g., the angles in a triangle are in the ratio 2:7:9. Find the size of the smallest angle. Use examples of sharing in a ratio where learners have to work backwards and use knowledge of the relative size of the parts of a ratio. e.g. Some sweets are shared in the ratio 5:4:2 between A, B, and C. B gets 48. How many sweets were there altogether? e.g. A & B share money in the ratio 8:5. A gets $21 more than B. Find out how much B gets. e.g. Two numbers are in the ratio 5 : 2 one of the numbers is 0.8 find two possible values for the other number.
  • 18. Cambridge Lower Secondary Mathematics 0862 Progression Grid v1.2 18 Algebra Expressions, equations and formulae Stage 7 Stage 8 Stage 9 7Ae.01 Understand that letters can be used to represent unknown numbers, variables or constants. 8Ae.01 Understand that letters have different meanings in expressions, formulae and equations. Ensure learners understand the meaning of unknown, constant, coefficient and term. e.g. in 3𝑥 − 2 = 7, 𝑥 is the unknown, 3 is the coefficient of 𝑥, 2 and 7 are constants, 2𝑛 is a term, 3𝑛 + 5 is an expression containing two terms (3𝑛 and 5), 4𝑛 – 5 = 11 is an equation containing an unknown 𝑛 and there is only one possible value of 𝑛. In some cases, constants are given as numbers and in other cases as letters because they represent a relationship. e.g.  constant as numbers in 5𝑥 + 9 = 17, the constants are 9 and 17  constant as letters 𝜋 is the ratio of a circle's circumference to its diameter ≈ 3.14 Use examples that relate to real situations  John is x years old, Anne is y years old. What might the expression x + y mean?  What would the expression 2x mean?  What would the expression x - y mean? Is this the same as y - x?  What could the equation x + 3 = y mean? Ensure learners understand the difference between a variable and an unknown, and the meaning of formula and subject of a formula. e.g.  In the formula 𝑣 = 𝑢 + 𝑎𝑡, the letters are variables related by the formula. 𝑣 is the subject of the formula.  𝑦 = 5𝑥 + 4 is a formula but also a linear function in two variables (x and y). For each individual value of 𝑥, the value of 𝑦 can be calculated (𝑦 varies according to the value of 𝑥)  In the linear equation 4𝑛 − 5 = 11, there is only one possible value of 𝑛. 𝑛 is an “unknown” but the equation can be solved to find what 𝑛 is.  In the expression 5𝑥 + 4, 𝑥 is a variable, 4 is a constant, 5𝑥 and 4 are terms of the expression. 5 is the coefficient of 𝑥. The expression is not equal to anything so cannot be solved. The emphasis in Stage 8 is on the difference between equations, expressions and formulae. e.g. which of the following is an expression? V=IR 3x + 4 = 19 10p + 15 Which one is an equation?
  • 19. Cambridge Lower Secondary Mathematics 0862 Progression Grid v1.2 19 7Ae.02 Understand that the laws of arithmetic and order of operations apply to algebraic terms and expressions (four operations). 8Ae.02 Understand that the laws of arithmetic and order of operations apply to algebraic terms and expressions (four operations, squares and cubes). 9Ae.01 Understand that the laws of arithmetic and order of operations apply to algebraic terms and expressions (four operations and integer powers). e.g. in 5 + 𝑎 2 the division is calculated first; in 9 − 4𝑏 the multiplication is calculated first 𝑎 + 𝑏 = 𝑏 + 𝑎 (commutative) 𝑎𝑏 = 𝑏𝑎 Use examples with no brackets e.g. Find the value of 5 + 𝑎 2 when 𝑎 = 6, 5 + 6 2 = 5 + 3 =8 Find the value of 3a + 5 when a = 7 Find the value of a + bc when a = 3, b = 1 and c = 10 Examples can include brackets e.g. In 2𝑎3 the power is calculated first; in 4(𝑑 − 3) the bracket is calculated first; in 3𝑎+5 2 the numerator is calculated first. e.g. Find the value of 3𝑥2 + 4 when 𝑥 = −2, 3(−2)2 + 4 = 3(4) + 4 =12+4 =16 e.g. Calculate the following if a=3, b=5 and c=6  a(b + c)  ab + c  (a + b)2  a2 + b2 Examples can include brackets and all operations e.g. In the expression, 3(𝑥 + 8) − 𝑥2 4 + 5, the brackets are solved first, then the power of two, then the multiplication and division, and then the addition and subtraction from left to right. In order to solve this expression for 𝑥 = 2, following the order of operations: 3(2 + 8) − 22 4 + 5 3(10) − 22 4 + 5 3(10) − 4 4 + 5 30 − 1 + 5 29 + 5 = 34 7Ae.03 Understand how to manipulate algebraic expressions including: - collecting like terms - applying the distributive law with a constant. 8Ae.03 Understand how to manipulate algebraic expressions including: - applying the distributive law with a single term (squares and cubes) - identifying the highest common factor to factorise. 9Ae.02 Understand how to manipulate algebraic expressions including: - expanding the product of two algebraic expressions - applying the laws of indices - simplifying algebraic fractions. Use and interpret algebraic notation (convention), including:  3𝑦 in place of 𝑦 + 𝑦 + 𝑦 and 3 × 𝑦 and y3  𝑎𝑏 in place of 𝑎 × 𝑏  𝑎2 in place of 𝑎 × 𝑎, 𝑎3 in place of 𝑎 × 𝑎 × 𝑎; 𝑎2 𝑏 in place of 𝑎 × 𝑎 × 𝑏  𝑎 𝑏 in place of 𝑎 ÷ 𝑏 Collect like terms 𝑎 + 𝑎 + 𝑎 + 𝑎 = 4𝑎 Expanding Distributive law with a single term 3𝑎(𝑎 − 3) = 3𝑎2 − 9𝑎 5𝑏2 (𝑏 − 2𝑎) = 5𝑏3 − 10𝑎𝑏2 Ensure learners understand that factorising means identifying common factors in algebraic expressions. Link with multiples and factors and prime numbers. Expanding two brackets to form trinomials where the coefficient of x is 1: (𝑥 + 3)(𝑥 + 2) = 𝑥2 + 5𝑥 + 6 (𝑦 − 1)(𝑦 + 3) = 𝑦2 + 2𝑦 − 3 Ensure learners recognise the generalisations: (𝑥 + 𝑎)(𝑥 − 𝑎) = 𝑥2 − 𝑎2 (difference of two squares) (𝑥 + 𝑎)2 = 𝑥2 + 2𝑎𝑥 + 𝑎2
  • 20. Cambridge Lower Secondary Mathematics 0862 Progression Grid v1.2 20 3𝑎2 − 𝑎2 + 4𝑎2 = 6𝑎2 3𝑐 + 5 − 2𝑐 = 𝑐 + 5 Include examples with fractional coefficients 3𝑏 + 𝑏 2 = 6𝑏+𝑏 2 = 7𝑏 2 𝑜𝑟 7 2 𝑏 3𝑏 8 + 𝑏 4 = 3𝑏+2𝑏 8 = 5𝑏 8 𝑜𝑟 5 8 𝑏 Distributive law with a constant 5(2𝑎 − 3) = 10𝑎 − 15 5(2𝑎 − 3 + 5c) = 10𝑎 − 15 + 25𝑐 Include examples from other strands, for example area and perimeter of a rectangle Find an expression for the area of the rectangle. Find an expression for the perimeter of the rectangle. Factorising By identifying the highest common factor 4𝑐 − 8 = 4(𝑐 − 2) 3𝑎𝑏 + 2𝑎 = 𝑎(3𝑏 + 2) 3𝑎2 − 12𝑎 = 3𝑎(𝑎 − 4) Ensure learners recognise the relationship between expanding and factorising. Include examples from other strands, for example area and perimeter of a rectangle e.g. An expression for the area of this rectangle is 2b2 + 14b. Find an expression for the width of the rectangle. (perfect squares) Laws of indices 𝑥5 × 𝑥4 = 𝑥5+4 = 𝑥9 𝑦8 ÷ 𝑦3 = 𝑦8−3 = 𝑦5 𝑧3 × 3𝑧 = 1𝑧3 × 3𝑧1 = 3𝑧3+1 = 3𝑧4 4𝑧5 ÷ 2𝑧2 = 2𝑧5−2 = 2𝑧3 (𝑎3)2 = 𝑎3×2 = 𝑎6 3𝑛2 − 2𝑛2 = 𝑛2 Algebraic fractions Ensure learners understand that ‘cancelling’ does not mean ‘crossing out what is similar’. e.g. The first example is incorrect 6𝑥+3 3 = 6𝑥, because learners need to factorise first as shown here: 6𝑥 + 3 3 = 3(2𝑥 + 1) 3 = 2𝑥 + 1 7Ae.04 Understand that a situation can be represented either in words or as an algebraic expression, and move between the two representations (linear with integer coefficients). 8Ae.04 Understand that a situation can be represented either in words or as an algebraic expression, and move between the two representations (linear with integer or fractional coefficients). 9Ae.03 Understand that a situation can be represented either in words or as an algebraic expression, and move between the two representations (including squares, cubes and roots). Use examples with one or two steps and no brackets e.g. 7 more than double a number can be represented by 2𝑛 + 7. Encourage learners to evaluate them by substituting a given value for each variable. Use examples with more than two steps, more than one variable and with brackets e.g. a triangle has three sides, the shortest side has length 𝑥, the second side is twice as long as the shortest side and the longest side is 3 units longer than the second side. The expression for the perimeter of the triangle is 𝑥 + 2𝑥 + 2𝑥 + 3 = 5𝑥 + 3 Use examples with more than one variable and with brackets e.g. I think of a number, 𝑛, multiply it by 2, square and then subtract 3. My number is represented by the expression (2𝑛)2 − 3
  • 21. Cambridge Lower Secondary Mathematics 0862 Progression Grid v1.2 21 e.g. In the example above, if my number is 3. 2 × 3 + 7 = 6 + 7 = 13 (the double of my number is 6. 7 more than 6 is 13) If my number is 5. 2 × 5 + 7 = 10 + 7 = 17 (the double of my number is 10. 7 more than 10 is 17) Use examples where learners have to do the opposite: write an algebraic expression in words e.g. one step: 2𝑥 = the double of a number two step: 3𝑛 + 8 = I have a number. I triple it and add eight. 𝑥 represents the shortest side, 2𝑥 represents the second side and 2𝑥 + 3 represents the longest side. The area of a rectangle with side lengths 3𝑎 and 1 2 𝑏 is represented by 3𝑎 × 1 2 𝑏 = 3 2 𝑎𝑏 Angelique has 𝑚 marbles, Eva has 5 more marbles than Angelique, Carlos has twice as many marbles as Eva. Eva has 𝑚 + 5 Carlos has 2(𝑚 + 5) = 2𝑚 + 10 marbles. Encourage learners to evaluate them by substituting a given value for each variable. e.g. If Angelique has 5 marbles (𝑚 = 5), Eva will have 𝑚 + 5 = 5 + 5 = 10 and Carlos 2 × 5 + 10 = 10 + 10 = 20. (20 is twice as many as 10, and 10 is 5 more than 5) If Angelique has 7 marbles, Eva will have 12 and Carlos will have 24. (24 is twice as many as 12, and 12 is five more than 7) A rectangle has width 𝑥. The length of the rectangle is 3 more than twice the width. 𝑊𝑖𝑑𝑡ℎ = 𝑥 𝐿𝑒𝑛𝑔𝑡ℎ = 2𝑥 + 3 The area of this triangle is represented by 𝐴𝑟𝑒𝑎 = 𝑤𝑖𝑑𝑡ℎ × 𝑙𝑒𝑛𝑔𝑡ℎ 𝑥(2𝑥 + 3) = 2𝑥2 + 3𝑥 Encourage learners to evaluate them by substituting a given value for the variables. e.g. In the example above, if the width is 3, the length is 2 × 3 + 3 = 6 + 3 = 9 (6 is twice the width, and 9 is 3 more than 6). The area, therefore, needs to be 3 × 9 = 27. 2𝑥2 + 3𝑥 = 2 × 32 + 3 × 3 = 2 × 9 + 9 = 18 + 9 = 27, which shows that the expression for the area is correct. A square has sides length 𝑥. Using Pythagoras, learners are able to represent its diagonal as √2𝑥. 7Ae.05 Understand that a situation can be represented either in words or as a formula (single operation), and move between the two representations. 8Ae.05 Understand that a situation can be represented either in words or as a formula (mixed operations), and manipulate using knowledge of inverse operations to change the subject of a formula. 9Ae.04 Understand that a situation can be represented either in words or as a formula (including squares and cubes), and manipulate using knowledge of inverse operations to change the subject of a formula. Use examples where learners have to derive the formulae such as to convert hours to minutes (𝑚 = 60ℎ); to convert centimetres to metres (𝑚 = 𝑐 100 ) Ensure learners use knowledge of inverse operations to manipulate formulae. Use examples where learners have to derive the formulae such as to convert degrees Celsius (°𝐶) to degrees Fahrenheit (°𝐹) (𝐹 = 𝐶 × 1.8 + 32); to find the sum of the interior angles of a polygon of 𝑛 sides (𝑠 = 180(𝑛 – 2)); cost of a taxi journey based on a $5 fixed charge and $2 per kilometre (𝑐 = 2𝑘 + 5); area of a trapezium (𝐴 = 𝑎+𝑏 2 ℎ), which is also covered in Geometry and Measure; Ensure learners understand the fixed and variable components of formulae, and that they use knowledge of e.g. Euler’s formula for the relationship between the number of faces, vertices and edges in a polyhedron covered in Geometry and measure (𝐹 + 𝑉 − 𝐸 = 2); Ensure learners use knowledge of inverse operations to manipulate formulae. e.g. Rearrange 𝑅 = 7𝑐+3 5 to make 𝑐 the subject of the formula 𝑅 = 7𝑐 + 3 5 5𝑅 = 7𝑐 + 3
  • 22. Cambridge Lower Secondary Mathematics 0862 Progression Grid v1.2 22 inverse operations to manipulate formulae (rearranging up to two steps). e.g. Rearrange 𝑅 = 7𝑐 + 3 to make 𝑐 the subject of the formula 𝑅 = 7𝑐 + 3 𝑅 − 3 = 7𝑐 𝑅 − 3 7 = 𝑐 𝑐 = 𝑅 − 3 7 5𝑅 − 3 = 7𝑐 5𝑅 − 3 7 = 𝑐 𝑐 = 5𝑅 − 3 7 e.g. A rectangle has width 𝑥, length 𝑦, and diagonal 𝑑. Using Pythagoras, learners are able to represent its diagonal 𝑑 𝑑2 = 𝑥2 + 𝑦2. 𝑑 = √𝑥2 + 𝑦2. 7Ae.06 Understand that a situation can be represented either in words or as an equation. Move between the two representations and solve the equation (integer coefficients, unknown on one side). 8Ae.06 Understand that a situation can be represented either in words or as an equation. Move between the two representations and solve the equation (integer or fractional coefficients, unknown on either or both sides). 9Ae.05 Understand that a situation can be represented either in words or as an equation. Move between the two representations and solve the equation (including those with an unknown in the denominator). e.g. 2𝑥 = 8, 3𝑥 + 5 = 14, 9 – 2𝑥 = 7, 11 = 3𝑥 + 5 I think of a number, double it and add 5, my answer is 13. The equation that represents this statement is 2𝑛 + 5 = 13 Ensure learners understand that “taking or moving to the other side” means performing inverse operations. e.g. for the equation 𝑥 – 3 = 11, we add the inverse to each expression. 𝑥 – 3 = 11 + 3 = +3 𝑥 + 0 = 14 e.g. 4𝑥 + 5 = 2𝑥 + 11 2𝑥 = 4(𝑥 − 3) 4(2𝑥 + 1) − 2(𝑥 − 5) = 2 3 4 𝑥 = 16 3 ( 7 8 𝑥 + 2) = −18𝑥 To work out the sizes of the angles in the isosceles triangle below 2𝑥 + 10 is equal to 3𝑥 − 6 due to the characteristics of an isosceles triangle. e.g. 15 𝑧 = 5 15 = 5z 3 = z e.g. 2 𝑥 + 1 = 16 There are x students in room A. There are 3 more students in room B than in room A. I share 100 sweets equally between all the students in room B and they receive 20 each. This problem can be represented by the equation 100 𝑥+3 = 20, where 𝑥 is the number of students in room A. 2𝑥 + 10° 3𝑥 − 6°
  • 23. Cambridge Lower Secondary Mathematics 0862 Progression Grid v1.2 23 That gives us −3 + 3 = 0 on the left and 11 + 3 = 14 on the right, so the solution of the equation is 𝑥 = 14 Therefore, 2𝑥 + 10 = 3𝑥 − 6 2𝑥 – 3𝑥 = −6 – 10 −𝑥 = −16 𝑥 = 16 Substituting: 2 × 16 + 10 = 32 + 10 = 42 180 – (42 + 42) = 180 – 84 = 96 The angles are 42°, 42°, 96° Solving gives 𝑥 = 2, so there are 2 students in room A and 5 students in room B 9Ae.06 Understand that the solution of simultaneous linear equations: - is the pair of values that satisfy both equations - can be found algebraically (eliminating one variable) - can be found graphically (point of intersection). Use examples with a pair of equations, including with decimal answers (approximate solutions). e.g. The graph shows the lines 𝑦 = 𝑥 + 1 and 𝑥 + 𝑦 = 3
  • 24. Cambridge Lower Secondary Mathematics 0862 Progression Grid v1.2 24 The point of intersection is (1, 2) and therefore the solution of the simultaneous equations is 𝑥 = 1, 𝑦 = 2. The same solution to the set of simultaneous linear equations 𝑦 = 𝑥 + 1 𝑥 + 𝑦 = 3 can also be found algebraically. Using substitution: x + y = 3 𝑥 + 𝑥 + 1 = 3 (substituting x+1 for y) 2𝑥 + 1 = 3 2𝑥 = 2 𝑥 = 1 𝑦 = 𝑥 + 1 𝑦 = 1 + 1 = 2 A pair of simultaneous equations can also be solved using elimination: 6𝑥 + 5𝑦 = 38 2𝑥 + 5𝑦 = 26 Subtract to reach 4𝑥 = 12 𝑥 = 3 2𝑥 + 5𝑦 = 26 6 + 5𝑦 = 26 5𝑦 = 20 𝑦 = 4
  • 25. Cambridge Lower Secondary Mathematics 0862 Progression Grid v1.2 25 7Ae.07 Understand that letters can represent an open interval (one term). 8Ae.07 Understand that letters can represent open and closed intervals (two terms). 9Ae.07 Understand that a situation can be represented either in words or as an inequality. Move between the two representations and solve linear inequalities. Ensure learners understand that 𝑥 < 3 is represented as which means that the 3 does not belong to the interval and that the interval goes to negative infinity (x can assume any number below 3) This uses their knowledge of rational numbers and builds to solve inequalities in later stages. e.g. 𝑥 ≤ 2 (x can assume any number below 2, including 2) −2 < 𝑥 ≤ 2 (x can assume any number between -2 and 2, excluding -2 and including 2) Use examples that require learners to use equivalence of intervals 𝑥 > 3 is equivalent to 2𝑥 > 6 If 𝑥 > 3, 𝑥 – 4 > 3 – 4 𝑥 – 4 > −1 e.g. The inequality 3𝑥 + 1 > −5 is true for any 𝑥 > −2 The inequality −3 < 𝑥 + 1 ≤ 2 is true when −3 − 1 < 𝑥 + 1 − 1 ≤ 2 − 1 −4 < 𝑥 ≤ 1 Its solution can be represented as Ensure learners understand the difference between equations (solution is a point) and inequalities (solution is an interval). Use examples with negative coefficients, but not focusing only on the rule of flipping the sign when multiplying by -1. e.g. 3𝑥 + 1 > 4𝑥 – 2 3𝑥 – 4𝑥 > −2 − 1 −𝑥 > −3 𝑥 < 3 Encourage learners to use numbers to check the equivalency.
  • 26. Cambridge Lower Secondary Mathematics 0862 Progression Grid v1.2 26 For 𝑥 = 2(< 3) 3 × 2 + 1 > 4 × 2 − 2 6 + 1 > 8 – 2 7 > 6 (true) For 𝑥 = 3 3 × 3 + 1 > 4 × 3 − 2 9 + 1 > 12 – 2 10 > 10 (false)
  • 27. Cambridge Lower Secondary Mathematics 0862 Progression Grid v1.2 27 Algebra Sequences, functions and graphs Stage 7 Stage 8 Stage 9 7As.01 Understand term-to-term rules, and generate sequences from numerical and spatial patterns (linear and integers). 8As.01 Understand term-to-term rules, and generate sequences from numerical and spatial patterns (including fractions). 9As.01 Generate linear and quadratic sequences from numerical patterns and from a given term-to-term rule (any indices). e.g. Continue the sequence -4, -7, -10, -13, …. The term-to-term rule is subtract 3 so the next term is -16. A sequence has first term 3 and term-to-term rule add 5. The next terms in the sequence can be found by applying the term-to-term rule to the first term 3 + 5 = 8 8 + 5 = 13 13 + 5 = 18 The first four terms are: 3, 8, 13, 18. The next patterns in the sequence are e.g. A sequence has first term ½ and the term-to-term rule is add 1 ½. The first four terms in the sequence are ½, 2, 3½, 5. A sequence has first term 2 and the term-to-term rule is multiply by 3 and add 1. The next terms in the sequence can be found by applying the term-to-term rule to the first term 2 × 3 + 1 = 6 + 1 = 7 7 × 3 + 1 = 21 + 1 = 22 22 × 3 + 1 = 66 + 1 = 67 67 × 3 + 1 = 201 + 1 = 202 The first five terms are: 2, 7, 22, 67, 202. e.g. A sequence has first term 2 and term-to-term rule square and subtract 1. The next terms in the sequence can be found by applying the term-to-term rule to the first term 22 − 1 = 4 − 1 = 3 32 − 1 = 9 − 1 = 8 82 − 1 = 64 − 1 = 63 The first four terms are: 2, 3, 8, 63. 7As.02 Understand and describe 𝑛th term rules algebraically (in the form 𝑛 ± 𝑎, 𝑎 × 𝑛 where 𝑎 is a whole number). 8As.02 Understand and describe 𝑛th term rules algebraically (in the form 𝑛 ± 𝑎, 𝑎 × 𝑛, or 𝑎𝑛 ± 𝑏, where 𝑎 and 𝑏 are positive or negative integers or fractions). 9As.02 Understand and describe 𝑛th term rules algebraically (in the form 𝑎𝑛 ± 𝑏, where 𝑎 and 𝑏 are positive or negative integers or fractions, and in the form 𝑛 𝑎 , 𝑛2 , 𝑛3 or 𝑛2 ± 𝑎, where a is a whole number). If the nth term (position-to-term rule) for a sequence is given as n-3. The 12th term can be found 12 - 3 = 9 Ensure learners understand how to find the nth term rule for an easy linear sequence (in the form 𝑛 ± 𝑎, 𝑎 × 𝑛) A sequence has nth term 20 − 1 2 𝑛. The 6th term can be found by substituting n with 6: 20 − 1 2 × 6 = 20 − 3 = 17. Examples can include generating sequences of the form 𝑛2 ± 𝑎 . A sequence has nth term 𝑛2 + 1. The 6th term of this sequence can be found by replacing n with 6: 62 + 1 = 36 + 1 = 37.
  • 28. Cambridge Lower Secondary Mathematics 0862 Progression Grid v1.2 28 e.g In the sequence 2, 4, 6, 8, … the nth term rule (position-to- term rule) is 2n 2 × 1 = 2 2 × 2 = 4 2 × 3 = 6 2 × 4 = 8 ⋮ 2 × 𝑛 = 2𝑛 Ensure learners understand how to find the nth term rule for a given linear sequence e.g. The nth term for the sequence: 1.4, 2.6, 3.8, 5.0 … is 1.2𝑛 + 0.2 In the sequence the position-to-term rule (nth term rule) for the number of matchsticks 3𝑛 + 1. Learners should be able to identify if a number is part of a sequence given by an nth term rule. e.g. The nth term of a sequence is given by the rule 3n + 5. Could the number 39 be a term in the sequence? This could be done by generating terms of the sequence to see if 39 is part of the sequence, or by solving the equation 3n + 5 = 39 to see if this gives an integer value. Learners can explore patterns which occur in the difference between terms and the difference between these differences (second difference). e.g. If the nth term of a sequence is given by the rule n2 + 4, the first 5 terms of the sequence will be: 5, 8, 13, 20, 29. The difference between each pair of terms is 3, 5, 7, 9 and the difference between each of these is 2, 2, 2 Sequences with nth term of the form n2 + a can be identified by comparing with the square number sequence (n2 ) e.g. In the sequence 3, 6, 11, 18, 27, … each term is two more than its corresponding term in the square number sequence and so the nth term for this sequence is given by the rule n2 + 2 Ensure learners understand how to find the nth term rule for a given sequence In the sequence 1 3 , 2 3 , 1, 4 3 … the nth term is 𝑛 3 Ensure learners recognise the sequence of square and cube numbers and can give their nth term rule e.g. For the sequence 1, 8, 27, 64,…, the nth term rule is 𝑛3 7As.03 Understand that a function is a relationship where each input has a single output. Generate outputs from a given function and identify inputs from a given output by considering inverse operations (linear and integers). 8As.03 Understand that a function is a relationship where each input has a single output. Generate outputs from a given function and identify inputs from a given output by considering inverse operations (including fractions). 9As.03 Understand that a function is a relationship where each input has a single output. Generate outputs from a given function and identify inputs from a given output by considering inverse operations (including indices). Numerical and diagrammatic representations of functions and algebraic representations of functions of the form 𝑦 = 𝑥 + 𝑐 or 𝑦 = 𝑚𝑥. Functions machines (including inverse), mapping diagrams, tables, etc. can be used to help learner understanding. Ensure learners can understand and use different representations of one-step functions. Numerical and diagrammatic representations of functions and algebraic representations of functions of the form 𝑦 = 𝑚𝑥 + 𝑐. Functions machines (including inverse), mapping diagrams, tables, etc. can be used to help learner understanding. Numerical, algebraic and diagrammatic representations. Functions machines (including inverse), mapping diagrams, tables, etc. can be used to help learner understanding. e.g. Create a function machine for 𝑦 = 3𝑥2 and consider different inputs such as 1, -1, 1 3 etc.
  • 29. Cambridge Lower Secondary Mathematics 0862 Progression Grid v1.2 29 e.g. the function 𝑦 = 𝑥 + 2 can be represented by the function machine an input of 3 would give an output of 5 an input of -1 would give an output of 1 e.g. for the function 𝑦 = 𝑥 + 2 the inverse function machine could be represented as an output of 19 would give an input of 17 an output of 0 would give an input of -2 e.g. the function 𝑦 = 3𝑥 − 2 can be represented by the function machine an input of 1 2 would give an output of − 1 2 e.g. for the function 𝑦 = 3𝑥 − 2 the inverse function machine could be represented as This inverse function machine can be used to find the input when the output is 2.5 2.5 + 2 = 4.5 4.5 ÷ 3 = 1.5 So the input was 1.5 e.g. For the function 𝑦 = 3𝑥2 if the output is 12, the possible inputs are 2 and -2 7As.04 Understand that a situation can be represented either in words or as a linear function in two variables (of the form 𝑦 = 𝑥 + 𝑐 or 𝑦 = 𝑚𝑥), and move between the two representations. 8As.04 Understand that a situation can be represented either in words or as a linear function in two variables (of the form 𝑦 = 𝑚𝑥 + 𝑐), and move between the two representations. 9As.04 Understand that a situation can be represented either in words or as a linear function in two variables (of the form 𝑦 = 𝑚𝑥 + 𝑐 or 𝑎𝑥 + 𝑏𝑦 = 𝑐), and move between the two representations. Include examples with functions arising from real-life problems e.g. currency conversion If 1 Thai Baht (𝑥) is exchanged for 3 Japanese Yen (𝑦) then this can be represented by the function 𝑦 = 3𝑥 Use examples where the variables are letters other than x and y. e.g. c = 2k Include examples with functions arising from real-life problems e.g. cost of hiring a cement mixer with a $25 fixed cost and additional charge of $10 per day can be represented by the function 𝑦 = 10𝑥 + 25 where 𝑦 is the total cost and 𝑥 is the number of days. Use examples where the variables are letters other than x and y. e.g. c = 2k + 5 Include examples with functions arising from real-life problems e.g. large tables seat 10 people and small tables seat 5 people, 200 people need to be seated. This situation can be represented by the function 10𝑥 + 5𝑦 = 200 where 𝑥 is the number of large tables and 𝑦 is the number of small tables Use examples where the variables are letters other than x and y. e.g. 2c + 5k = 10
  • 30. Cambridge Lower Secondary Mathematics 0862 Progression Grid v1.2 30 7As.05 Use knowledge of coordinate pairs to construct tables of values and plot the graphs of linear functions, where 𝑦 is given explicitly in terms of 𝑥 (𝑦 = 𝑥 + 𝑐 or 𝑦 = 𝑚𝑥). 8As.05 Use knowledge of coordinate pairs to construct tables of values and plot the graphs of linear functions, where 𝑦 is given explicitly in terms of 𝑥 (𝑦 = 𝑚𝑥 + 𝑐). 9As.05 Use knowledge of coordinate pairs to construct tables of values and plot the graphs of linear functions, including where 𝑦 is given implicitly in terms of 𝑥 (𝑎𝑥 + 𝑏𝑦 = 𝑐), and quadratic functions of the form 𝑦 = 𝑥2 ± 𝑎. Numerical and graphic representations of functions e.g. a completed table of values for 𝑦 = 𝑥 + 2 𝑥 -1 0 1 2 3 𝑦 1 2 3 4 5 gives us the coordinate pairs (-1,1), (0,2), (1,3), (2,4), (3,5) to aid in plotting the graph of 𝑦 = 𝑥 + 2 e.g. 𝑦 = 𝑥 + 2 If the x coordinate is 12, the y coordinate is 14. So (12,14) lies on the line Include examples with functions arising from real-life problems and learners have to draw and interpret their graphs. e.g. currency conversion e.g. A document with 110 pages takes 5 minutes to print. Draw a straight line graph to show how the time (t minutes) to print a document varies with the number of pages (x). Numerical and graphic representations of functions e.g. a completed table of values for 𝑦 = 3𝑥 − 2 𝑥 -1 0 1 2 3 𝑦 -5 -2 1 4 7 gives us the coordinate pairs (-1,-5), (0,-2), (1,1), (2,4), (3,7) to aid in plotting the graph of 𝑦 = 3𝑥 − 2 e.g. 𝑦 = 4𝑥 − 8 If the y coordinate is 0, the x coordinate is 2. So (2, 0) lies on the line and this is where it crosses the x axis. If the x coordinate is 0, the y coordinate is -8. So (0, -8) lies on the line and this is where it crosses the y axis. Include examples with functions arising from real-life problems and learners have to draw and interpret their graphs. e.g. cost of hiring a cement mixer with a $25 fixed cost and additional charge of $10 per day. Numerical and graphic representations of functions e.g. a completed table of values for 10𝑥 + 5𝑦 = 200 𝑥 0 5 10 15 20 𝑦 40 30 20 10 0 e.g. a completed table of values for 𝑦 = 𝑥2 + 5 𝑥 -1 0 1 2 3 𝑦 6 5 6 9 14 Include examples where learners have to draw and interpret their graphs. e.g. 4𝑥 + 3𝑦 = 12 If the y coordinate is 0, the x coordinate is 3. So (3, 0) lies on the line and this is where it crosses the x axis. If the x coordinate is 0, the y coordinate is 4. So (0, 4) lies on the line and this is where it crosses the y axis. 7As.06 Recognise straight-line graphs parallel to the 𝑥- or 𝑦-axis. 8As.06 Recognise that equations of the form 𝑦 = 𝑚𝑥 + 𝑐 correspond to straight-line graphs, where 𝑚 is the gradient and 𝑐 is the 𝑦-intercept (integer values of 𝑚). 9As.06 Understand that straight-line graphs can be represented by equations. Find the equation in the form 𝑦 = 𝑚𝑥 + 𝑐 or where 𝑦 is given implicitly in terms of 𝑥 (fractional, positive and negative gradients). Deduce that graphs of the form 𝑥 = 𝑎 will be parallel to the y- axis and graphs of the form 𝑦 = 𝑏 will be parallel to the x- axis Ensure learners recognise the graph of the particular case 𝑦 = 𝑥. Include examples which require learners to find the gradient and y-intercept from a graph and deduce the equation of the graph in the form 𝑦 = 𝑚𝑥 + 𝑐
  • 31. Cambridge Lower Secondary Mathematics 0862 Progression Grid v1.2 31 e.g. recognise and label the graphs of 𝑥 = 5 For this graph the x coordinate of each point on the line will always be 5, so the coordinates for this line will be (5,0), (5,1), (5,2), (5,3) and so on. 𝑦 = −3 For this graph the y coordinate of each point on the line will always be -3, so the coordinates for this line will be (0,-3), (1,-3), (2,-3), (3,-3) and so on. Learners should be able to plot and identify connections between families of graphs. e.g. after plotting the graphs of 𝑦 = 2𝑥 + 3 𝑦 = 2𝑥 + 1 𝑦 = 2𝑥 − 2 They should be able to identify that the three lines are parallel to each other and all have the same gradient. They should be able to identify that each graph has a different y-intercept and that the y-intercept for each graph is the same as the constant in the equation of the graph. Learners should also be able to plot graphs with the same y- intercept and notice what effect the value of the x coefficient has on the gradient of the line. Include examples with functions arising from real-life problems and learners have to interpret the features of the graph e.g. cost of hiring a cement mixer with a $25 fixed cost and additional charge of $10 per day. 𝑦 = 25 + 10𝑥 𝑦 is the total cost 𝑐 = 25 (y-intercept) 𝑚 = 10 (gradient) 𝑥 is the number of days e.g. What is the gradient? What is the y-intercept? What is the equation of this graph? e.g. Tick the graph of 𝑦 = 2𝑥 + 1 Include examples which require learners to rearrange equations to make y the subject and to identify the gradient and the y-intercept. e.g. the equation 3𝑦 + 2𝑥 − 7 = 26 can be rearranged to 𝑦 = − 2 3 𝑥 + 11 Both equations represent the straight line graph with gradient − 2 3 and y-intercept (0,11)
  • 32. Cambridge Lower Secondary Mathematics 0862 Progression Grid v1.2 32 7As.07 Read and interpret graphs related to rates of change. Explain why they have a specific shape. 8As.07 Read and interpret graphs with more than one component. Explain why they have a specific shape and the significance of intersections of the graphs. 9As.07 Read, draw and interpret graphs and use compound measures to compare graphs. e.g. line graphs (with a single line only), travel graphs (distance-time), temperature graphs, graph showing depth of water in a container over time when the container has a variety of shapes and liquid is added at a constant rate: Ensure learners understand:  rate measures the change of a quantity in relation to time, and therefore the faster something changes the higher the rate  positive, zero and negative gradients  speed is a rate and represents a change in distance in relation to time e.g. travel graphs (distance-time) with more than one person; a graph for phone bill against number of minutes used for two different contracts. Learners should not calculate further values/compound values etc. This includes calculating further values or compound values from the graph e.g. Calculating the gradient to find a rate of change Currency exchange rate Price per unit Speed from a distance time graph at various points
  • 33. Cambridge Lower Secondary Mathematics 0862 Progression Grid v1.2 33 Geometry and Measure Geometrical reasoning, shapes and measurements Stage 7 Stage 8 Stage 9 7Gg.01 Identify, describe and sketch regular polygons, including reference to sides, angles and symmetrical properties. 8Gg.01 Identify and describe the hierarchy of quadrilaterals. e.g. understand the line symmetry and rotational symmetry properties of regular polygons The hierarchy includes seven quadrilaterals: kite, parallelogram, rhombus, rectangle, square, trapezium, isosceles trapezium. Here a trapezium is defined as a 2D shape with at least one pair of parallel sides. Give learners the opportunity to investigate the necessary and sufficient properties to define each specific type of quadrilateral. Ensure learners understand the hierarchy. e.g. All squares are rectangles, all rectangles are parallelograms etc.
  • 34. Cambridge Lower Secondary Mathematics 0862 Progression Grid v1.2 34 7Gg.02 Understand that if two 2D shapes are congruent, corresponding sides and angles are equal. 7Gg.03 Know the parts of a circle: - centre - radius - diameter - circumference - chord - tangent. 8Gg.02 Understand π as the ratio between a circumference and a diameter. Know and use the formula for the circumference of a circle. 9Gg.01 Know and use the formulae for the area and circumference of a circle. Recognise and label the parts of a circle. Ensure learners understand that any length inside the circle that does not pass through the centre is not a diameter, it is a chord. Know that the tangent and radius are perpendicular to each other. Learners could explore the ratio between the circumference and diameter of circular objects by measuring. Learners should understand that π can be approximated as 3.142, 22 7 and that there is a value of π stored on a scientific calculator. Circumference C = 2𝜋𝑟 or 𝜋d. e.g. The radius of a circle is 3.2cm, find the circumference. Radius = 3.2cm Diameter = 6.4cm C = 6.4 x π = 20.11cm to 2 d.p. e.g. The circumference of a circle is 20.8cm, find the diameter of the circle. d = 20.8 ÷ π = 6.62cm to 2 d.p. Area 𝐴 = 𝜋𝑟2 e.g. The diameter of a circle is 10.8cm, find its area. d = 10.8cm r = 5.4cm A = π x 5.42 = 91.69cm2 to 2d.p. Include examples of finding the area and perimeter of semi- circles.
  • 35. Cambridge Lower Secondary Mathematics 0862 Progression Grid v1.2 35 7Gg.04 Understand the relationships and convert between metric units of area, including hectares (ha), square metres (m²), square centimetres (cm²) and square millimetres (mm²). 8Gg.03 Know that distances can be measured in miles or kilometres, and that a kilometre is approximately 5 8 of a mile or a mile is 1.6 kilometres. 9Gg.02 Know and recognise very small or very large units of length, capacity and mass. e.g. The floor of a room measures 3m by 2.4m. Some tiles measure 20cm by 20cm. Work out how many tiles are needed to cover the floor of the room. Learners should understand that one square centimetre is 10mm x 10mm and therefore 1cm2 = 100mm2 1ha = 10 000m2 1m2 = 10,000 cm2 1km2 = 1,000,000m2 e.g. recognise that 12450 cm2 is 1.245 m2 e.g. Which is longer, 85 km or 52 miles? 1 light year (ly - 9 460 730 472 580 800 metres), 1 micrometre (µm - one millionth of a metre), 1 nanometre (nm-one billionth of a metre), milligram (mg - one thousandth of a gram), microgram (µg - one millionth of a gram), tonne (t - 1000kg). microlitre (µl), megabyte (MB), gigabyte (GB), terabyte (TB). 7Gg.05 Derive and know the formula for the area of a triangle. Use the formula to calculate the area of triangles and compound shapes made from rectangles and triangles. 8Gg.04 Use knowledge of rectangles, squares and triangles to derive the formulae for the area of parallelograms and trapezia. Use the formulae to calculate the area of parallelograms and trapezia. 9Gg.03 Estimate and calculate areas of compound 2D shapes made from rectangles, triangles and circles. e.g. thinking of a triangle as half a rectangle e.g. use what you know about triangles and rectangles to find the area of this shape. Area of a parallelogram = base x perpendicular height Area of a trapezium 𝐴 = 1 2 (𝑎 + 𝑏)ℎ e.g. find the area of this shape.
  • 36. Cambridge Lower Secondary Mathematics 0862 Progression Grid v1.2 36 7Gg.06 Identify and describe the combination of properties that determine a specific 3D shape. 8Gg.05 Understand and use Euler’s formula to connect number of vertices, faces and edges of 3D shapes. Learners should understand that a ‘face’ is, by definition, flat. If curved, it is described as a ‘curved surface’. e.g. a 3D shape has 1 curved surface, no edges and no vertices, so it must be a sphere e.g. A pyramid will always have the same number of faces as vertices. Include less familiar properties such as:  All pyramids have an even number of edges.  The number of edges of a prism is a multiple of 3 Euler’s formula is V + F – E = 2 Ensure learners know that Euler’s formula only applies to polyhedra. 7Gg.07 Derive and use a formula for the volume of a cube or cuboid. Use the formula to calculate the volume of compound shapes made from cuboids, in cubic metres (m3), cubic centimetres (cm3) and cubic millimetres (mm3). 8Gg.06 Use knowledge of area and volume to derive the formula for the volume of a triangular prism. Use the formula to calculate the volume of triangular prisms. 9Gg.04 Use knowledge of area and volume to derive the formula for the volume of prisms and cylinders. Use the formula to calculate the volume of prisms and cylinders. Introduce many examples of volume so that learners can find the formula volume = length x width x height Include examples of working backwards to find a side length of a cuboid when given the volume and 2 dimensions. e.g. The volume of a cuboid is 120cm3 . The height of the cuboid is 10cm and the length is 4cm. Find the width. Learners should be aware of the relationship between cubic centimetres and litres. Use properties of rectangles to calculate area of a triangle. Volume of triangular prism = area of triangular cross section x length Use properties of circles to find the area of a circle. Volume of cylinder = area of circular cross section x length Generalise that for any prism: Volume = area of cross section x length 7Gg.08 Visualise and represent front, side and top view of 3D shapes. 8Gg.07 Represent front, side and top view of 3D shapes to scale. e.g. Draw the front, side and top view of this 3D shape Use knowledge of ratio and proportion to create scale drawings of 3D shapes.
  • 37. Cambridge Lower Secondary Mathematics 0862 Progression Grid v1.2 37 Front, side and top view can also be referred to as plans and elevations. Ensure learners understand that a 2D representation of a 3D shape can be a scale drawing or not. When drawing blueprints, for example, the proportions should be kept e.g. 5m should be equivalent to 5cm for all parts. 7Gg.09 Use knowledge of area, and properties of cubes and cuboids to calculate their surface area. 8Gg.08 Use knowledge of area, and properties of cubes, cuboids, triangular prisms and pyramids to calculate their surface area. 9Gg.05 Use knowledge of area, and properties of cubes, cuboids, triangular prisms, pyramids and cylinders to calculate their surface area. Include reference to the formula for the surface area of a cube (6s2 ) Learners should be able to use the net of a cuboid to determine the rectangles that make up the faces of the cuboid and work out its surface area. e.g. Find the surface area of this cuboid 2 x (8 x 10) = 160 2 x (5 x 8) = 80 2 x (10 x 5) = 100 160 + 80 + 100 = 340cm2 Learners should be able to use the nets of shapes to help them to determine the areas of each of the faces of the shape. Connect right-angled prisms to Pythagoras’ theorem. e.g. Find the surface area of this triangular prism. (Use Pythagoras theorem to find the missing length on the sloping side) 7Gg.10 Identify reflective symmetry and order of rotational symmetry of 2D shapes and patterns. 8Gg.09 Understand that the number of sides of a regular polygon is equal to the number of lines of symmetry and the order of rotation. 9Gg.06 Identify reflective symmetry in 3D shapes.
  • 38. Cambridge Lower Secondary Mathematics 0862 Progression Grid v1.2 38 A picture of star showing three mirror lines or fold lines and order five rotational symmetry e.g. (isosceles) trapezium, kite, parallelogram, rhombus, isosceles triangle, equilateral triangle, scalene triangle, shapes that have curves Some shapes can have rotational but not reflective symmetry. e.g. a regular pentagon has 5 lines of symmetry and rotational symmetry order 5 e.g. find the number of planes of symmetry of a hexagonal prism with a regular hexagon as cross-section Ensure learners understand that in two dimensions, a shape is divided into 2 congruent parts by a line of symmetry. In three dimensions, a plane of symmetry divides a solid into two congruent parts. 7Gg.11 Derive the property that the sum of the angles in a quadrilateral is 360°, and use this to calculate missing angles. 8Gg.10 Derive and use the fact that the exterior angle of a triangle is equal to the sum of the two interior opposite angles. 9Gg.07 Derive and use the formula for the sum of the interior angles of any polygon. e.g. draw the diagonal of a quadrilateral to form two triangles and use the angle sum of these to show that the angle sum of a quadrilateral is 2 x 180o . Include examples where learners have to apply their knowledge of the properties of quadrilaterals including reference to parallel sides, right angles, rotational and reflective symmetry. e.g. Learners know that a parallelogram has rotation symmetry order 2. So the top right angle is also 51°. The remaining two angles are also equal: 360-51-51=258 258÷ 2 =129° Interior angle sum of a triangle is 180°. Exterior angle of a triangle is equal to the sum of the two interior opposite angles. Learners should be combining angle facts about straight lines, triangles, around a point and quadrilaterals to find missing angles in diagrams. e.g. a polygon with n sides can be split into n – 2 triangles each with an angle sum of 180°. The sum of the interior angles of a polygon is (n-2) x 180. For a regular polygon each of the interior angles will be equal. e.g. a regular pentagon has an interior angle sum of (5 - 2) x 180 = 540o 540 ÷ 5 = 108o Each interior angle is 108o Learners can use interior and exterior angles of regular polygons to consider why some tessellate and some not.
  • 39. Cambridge Lower Secondary Mathematics 0862 Progression Grid v1.2 39 e.g. Learners know there is a horizontal line of reflection so angle a=110° Then angles in a quadrilateral add to 360° 360- 110- 110- 80 = 60 So b=60° e.g. Find the size of angle e 7Gg.12 Know that the sum of the angles around a point is 360º, and use this to calculate missing angles. 9Gg.08 Know that the sum of the exterior angles of any polygon is 360°. The exterior angles of a polygon create a journey around the shape that totals 360o e.g. Learners can use interior and exterior angles of regular polygons to consider why some tessellate and some not. 7Gg.13 Recognise the properties of angles on: - parallel lines and transversals - perpendicular lines - intersecting lines. 8Gg.11 Recognise and describe the properties of angles on parallel and intersecting lines, using geometric vocabulary such as alternate, corresponding and vertically opposite. 9Gg.09 Use properties of angles, parallel and intersecting lines, triangles and quadrilaterals to calculate missing angles.
  • 40. Cambridge Lower Secondary Mathematics 0862 Progression Grid v1.2 40 e.g. Find equal angles in a simple diagram with parallel lines and a transversal Find equal angles formed where two lines intersect Identify parallel lines and equal angles in tessellating parallelograms e.g. find equal angles in more complex diagrams, and explain why they are equal, with the correct geometrical language alternate, corresponding, vertically opposite e.g. include examples involving triangle, quadrilaterals and parallel lines where a number of properties need to be applied together. Calculate the size of the angle marked x. 9Gg.10 Know and use Pythagoras’ theorem. Learners should understand the relationship between the sides of a right-angled triangle and be able to use two sides of a right angled triangle to calculate the third side. Learners should be able to solve problems in a range of contexts e.g. Work out the length of the diagonal of the television screen
  • 41. Cambridge Lower Secondary Mathematics 0862 Progression Grid v1.2 41 7Gg.14 Draw parallel and perpendicular lines, and quadrilaterals. 8Gg.12 Construct triangles, midpoint and perpendicular bisector of a line segment, and the bisector of an angle. 9Gg.11 Construct 60º, 45º and 30º angles and regular polygons. Using ruler, set square, a protractor or digital technology. Using compass and ruler or digital technology. Construct triangles  given two sides and the included angle (SAS)  or two angles and the included side (ASA)  given three sides (SSS)  given a right angle, hypotenuse and one side (RHS) Use a pair of compasses to construct the perpendicular bisector of a line segment, knowing to show all construction lines Use a pair of compasses to construct an angle bisector knowing to show all construction lines Using compass and ruler or digital technology. Includes Inscribed squares, equilateral triangles, and regular hexagons and octagons in a circle. e.g. construct a 45o angle by constructing a perpendicular bisector (90o ) and then constructing an angle bisector.
  • 42. Cambridge Lower Secondary Mathematics 0862 Progression Grid v1.2 42 Geometry and Measure Position and transformation Stage 7 Stage 8 Stage 9 7Gp.01 Use knowledge of scaling to interpret maps and plans. 8Gp.01 Understand and use bearings as a measure of direction. 9Gp.01 Use knowledge of bearings and scaling to interpret position on maps and plans. Learners should be able to convert from a map measurement to a real life distance and vice versa e.g. a map has a scale of 1:100 000 The distance between two towns on the map is 3.4cm What is the distance in real life? 3.4 x 100 000 = 340 000cm = 3400m = 3.4km Bearings are angles measured clockwise from north (three digits). Include examples where learners need to measure a bearing using a protractor or draw a bearing using a protractor e.g. what is the bearing of A from B. e.g. Draw a bearing of 035° Ensure learners can use bearings to interpret all possible locations or use two bearings to find the exact location. e.g. The diagram shows the position of two mountains, A and B. A third mountain, C, is on a bearing of 145° from A and on a bearing of 270° from B. Mark the position of C on the diagram. e.g. a tree is 40m from a house and is on a bearing of 056° from the house. Use the scale to mark the position of the tree on the map below… 7Gp.02 Use knowledge of 2D shapes and coordinates to find the distance between two coordinates that have the same 𝑥 or 𝑦 coordinate (without the aid of a grid). 8Gp.02 Use knowledge of coordinates to find the midpoint of a line segment. 9Gp.02 Use knowledge of coordinates to find points on a line segment.
  • 43. Cambridge Lower Secondary Mathematics 0862 Progression Grid v1.2 43 Ensure learners understand that (3, 1) and (6,1) belong to the same horizontal line. Similarly, ensure learners understand that for example, (1,3) and (1,6) belong to the same vertical line. This is a misconception as they see the x coordinates are the same and incorrectly state that the coordinates belong to the horizontal line. Learners should be able to identify the coordinate of C as (6,4) Learners should be able to solve similar problems involving squares and rectangles that are tilted, parallelograms, isosceles triangles etc. Learners should be encouraged to find the midpoint of a line segment both geometrically by measuring and by calculation. Learners should be able to solve problems where the midpoint is given. e.g. Point M (4.9) is the midpoint of point A (2,1) and point B (?,?) Find the coordinates of point B One third of the distance of the y axis and one third of the distance of the x axis Find the point that lies one third of the way along the line segment joining (0,0) and (6,12) e.g. The origin O, point A, and point B are equally spaced along the same line such that the distance OA is equal to the distance AB. A is the point (4, 3). What are the coordinates of point B? If the points continue along the line so that each subsequent point is labelled with the next letter of the alphabet, what would be the coordinates of point T? 7Gp.03 Use knowledge of translation of 2D shapes to identify the corresponding points between the original and the translated image, without the use of a grid. 8Gp.03 Translate points and 2D shapes using vectors, recognising that the image is congruent to the object after a translation. 9Gp.03 Transform points and 2D shapes by combinations of reflections, translations and rotations. e.g. The point A has coordinates (3,4). The point A is translated 2 left and 2 up. What are the new coordinates of the position of point A now? Ensure learners understand the difference between a vector and coordinate, including vector notation. e.g. translating a shape using the vector ( 2 5 ) means the shape moves right 2 and up 5 Ensure learners understand that if two 2D shapes are congruent, corresponding sides and angles are equal e.g. Reflect the shape in the line x=3 and then reflect the new shape in the line y=5 e.g. Translate the shape by the vector ( 2 5 ) and then rotate the new shape by 180o around the point (2,1)
  • 44. Cambridge Lower Secondary Mathematics 0862 Progression Grid v1.2 44 Understand that the image is congruent to the object after these transformations (they preserve length and angles) Ensure learners can identify the vector for a given translation of an object to its image. 9Gp.04 Identify and describe a transformation (reflections, translations, rotations and combinations of these) given an object and its image. Ensure learners understand what is needed to give a precise description of a reflection, translation or rotation. e.g. Reflection requires the equation of the mirror line, translation requires a vector, rotation requires the angle and direction of rotation (clockwise / anticlockwise) e.g. Reflect shape A in the line x=2 and label it B. Reflect shape B in the line y=1 and label it C. What single transformation would take shape A to shape C? 9Gp.05 Recognise and explain that after any combination of reflections, translations and rotations the image is congruent to the object. 7Gp.04 Reflect 2D shapes on coordinate grids, in a given mirror line (𝑥- or 𝑦-axis), recognising that the image is congruent to the object after a reflection. 8Gp.04 Reflect 2D shapes and points in a given mirror line on or parallel to the 𝑥- or 𝑦-axis, or 𝑦 = ± 𝑥 on coordinate grids. Identify a reflection and its mirror line. Includes identifying the equation of the mirror line for a given object and its image.
  • 45. Cambridge Lower Secondary Mathematics 0862 Progression Grid v1.2 45 Include examples where the sides of the shape are not parallel or perpendicular to the mirror line (vertical, horizontal and diagonal, including through the shape). 7Gp.05 Rotate shapes 90º and 180º around a centre of rotation, recognising that the image is congruent to the object after a rotation. 8Gp.05 Understand that the centre of rotation, direction of rotation and angle are needed to identify and perform rotations. Learners should understand that for 90o rotation, they will need to consider if the rotation is clockwise or anticlockwise. 7Gp.06 Understand that the image is mathematically similar to the object after enlargement. Use positive integer scale factors to perform and identify enlargements. 8Gp.06 Enlarge 2D shapes, from a centre of enlargement (outside or on the shape) with a positive integer scale factor. Identify an enlargement and scale factor. 9Gp.06 Enlarge 2D shapes, from a centre of enlargement (outside, on or inside the shape) with a positive integer scale factor. Identify an enlargement, centre of enlargement and scale factor. Ensure learners understand that enlargements preserve angles but not lengths. Sometimes the enlarged image can surround or overlap the original image. Learners should recognise the invariant properties when carrying out an enlargement from a centre, and the effect on the lengths and ratios of sides. e.g. describe the transformation that maps the object onto its image (enlargement, scale factor 3, centre of enlargement (1, 5)) Ensure learners understand what is needed to give a precise description of an enlargement. 9Gp.07 Analyse and describe changes in perimeter and area of squares and rectangles when side lengths are enlarged by a positive integer scale factor. e.g. a square with sides 2cm has perimeter 8cm and area 4cm2 . If you double the sides, the perimeter will double (16cm) but the area will be times 4 (16cm2 ).
  • 46. Cambridge Lower Secondary Mathematics 0862 Progression Grid v1.2 46 e.g. the area of a rectangle is 38cm2 . The rectangle is enlarged by a scale factor of 3. What will be the area of the enlarged rectangle?
  • 47. Cambridge Lower Secondary Mathematics 0862 Progression Grid v1.2 47 Statistics and Probability Statistics Stage 7 Stage 8 Stage 9 7Ss.01 Select and trial data collection and sampling methods to investigate predictions for a set of related statistical questions, considering what data to collect (categorical, discrete and continuous data). 8Ss.01 Select, trial and justify data collection and sampling methods to investigate predictions for a set of related statistical questions, considering what data to collect (categorical, discrete and continuous data). 9Ss.01 Select, trial and justify data collection and sampling methods to investigate predictions for a set of related statistical questions, considering what data to collect, and the appropriateness of each type (qualitative or quantitative; categorical, discrete or continuous). Ensure learners can identify whether data is categorical, discrete or continuous data. Learners should select how they will collect their data. e.g. observation, questionnaire, interview, focus groups. Learners should select how they will choose their sample. e.g. drawing names out of a hat, using a random number generator, picking every 3rd person on the class register, choosing the first 50 people in the lunch queue. Ensure learners understand that there are some data collection methods and sampling techniques that are more suitable for a specific type of data. Once a learner has selected their data collection and sampling methods they should be able to justify the reasons for their choice. e.g. “I put all the girls’ names in one hat and all the boys’ names in another. Then I pulled out 20 boys’ names and 10 girls’ names. This was because there are double the number of boys in my school than there are girls, so I wanted to ensure my sample was representative of the boys and girls in the population” Ensure learners consider alternative data collection and sampling techniques. e.g. “I could have given out a questionnaire instead of interviewing. This would have taken me less time, but I wouldn’t be as sure that people had understood the questions”. Include examples where learners need to decide what data to collect in order to answer the question. Ensure learners consider the appropriateness of each data type. e.g. “For word length I could measure the length of each word with a ruler, or simply count the letters. Counting letters is more appropriate as it is simpler/ easier, and for some fonts the spaces between the letters is not consistent which creates an extra source of variation, plus it is hard to measure accurately which will also add a source of variation.” 7Ss.02 Understand the effect of sample size on data collection and analysis. 8Ss.02 Understand the advantages and disadvantages of different sampling methods. 9Ss.02 Explain potential issues and sources of bias with data collection and sampling methods, identifying further questions to ask.
  • 48. Cambridge Lower Secondary Mathematics 0862 Progression Grid v1.2 48 Ensure learners understand what a population and sample are. They should understand the importance of sample size prior to starting an investigation. e.g. if learners are collecting data for a whole country, the sample size should be bigger than if they are collecting data from the schools (in the latter, it could even be the whole population). Ensure learners understand that the larger the sample, the longer it may take to collect and analyse the data. However, if the sample is too small, it may not be representative of the population. As the sample grows the proportions in the sample reflect the population more closely, but there comes a point where increasing the sample size does not meaningfully improve the correspondence between sample/population proportions (the proportions “stabilise”). e.g. what sampling method could you use if you wanted to ask learners in your school about school lunch. What would be the advantages and disadvantages of each?  Selecting 5 learners from each tutor group in the school  Picking the first 50 from an alphabetical list of all learners who attend the school  Choosing 50 names out of a hat which contains the names of all learners who attend the school  Asking the first 50 people in the lunch queue. e.g. if a population is made of 45% female and 55% male, and the sample has 10% male and 90% female. e.g. Standing outside a swimming pool asking people if they like swimming. e.g. Learners are using data from an outdated survey about social media that included some that are not used anymore and did not include current platforms. Learners should understand the sources of bias may be intentional. A biased sample may make the data appear more positive e.g. on advertising campaigns. They should identify further information required to determine whether the data was collected in a fair way. Stage 7 Stage 8 Stage 9 7Ss.03 Record, organise and represent categorical, discrete and continuous data. Choose and explain which representation to use in a given situation: - Venn and Carroll diagrams - tally charts, frequency tables and two-way tables - dual and compound bar charts - waffle diagrams and pie charts - frequency diagrams for continuous data - line graphs - scatter graphs - infographics. 8Ss.03 Record, organise and represent categorical, discrete and continuous data. Choose and explain which representation to use in a given situation: - Venn and Carroll diagrams - tally charts, frequency tables and two-way tables - dual and compound bar charts - pie charts - frequency diagrams for continuous data - line graphs and time series graphs - scatter graphs - stem-and-leaf diagrams - infographics. 9Ss.03 Record, organise and represent categorical, discrete and continuous data. Choose and explain which representation to use in a given situation: - Venn and Carroll diagrams - tally charts, frequency tables and two-way tables - dual and compound bar charts - pie charts - line graphs, time series graphs and frequency polygons - scatter graphs - stem-and-leaf and back-to-back stem-and-leaf diagrams - infographics.
  • 49. Cambridge Lower Secondary Mathematics 0862 Progression Grid v1.2 49 Lists, tables, tally Representing data in two way tables: Tabulate discrete and continuous data, choosing suitable class intervals where appropriate. Use of ≤, < for continuous data intervals, e.g. Continue to use tally charts, frequency tables and two-way tables where appropriate and explain choice of data representation. Use examples that require learners to regroup data in tables e.g. regroup intervals of 5 into intervals of 10 or vice versa. Venn and Carroll Use Venn and Carroll diagrams where appropriate and explain choice of data representation. Continue to use Venn and Carroll diagrams where appropriate and explain choice of data representation. Continue to use Venn and Carroll diagrams where appropriate and explain choice of data representation. Block graph, pictogram, bar chart Introduce dual and compound bar charts with two categories e.g. dual bar chart: Continue to use dual and compound bar charts where appropriate and explain choice of data representation. Include compound bar charts with more than two categories for each bar. Ensure learners are confident drawing bar charts with more complicated scales. Continue to use dual and compound bar charts where appropriate and explain choice of data representation. Ensure learners can convert information between dual and compound bar charts.
  • 50. Cambridge Lower Secondary Mathematics 0862 Progression Grid v1.2 50 e.g. compound bar chart: Include bar charts with grouped discrete data in any sized groups e.g. in 3s (1–3, 4–6, 7–9 etc.) Waffle diagrams and pie charts Use examples where the total frequency is a factor of 360. Use waffle diagrams that use more than 100 squares so that learners calculate the percentage and proportion of each colour, then apply this to pie charts. e.g. Include pie charts that represent different totals to compare proportion, e.g. Ensure learners can draw pie charts where the total frequency is not a factor of 360. Ensure learners can convert information represented in bar charts to pie charts and vice versa.
  • 51. Cambridge Lower Secondary Mathematics 0862 Progression Grid v1.2 51 Frequency diagrams Continue to use frequency diagrams for continuous data where appropriate and explain choice of data representation. Learners should be confident in drawing frequency diagrams for continuous data from the beginning, including choosing their own scales for frequency. Continue to represent data as frequency diagrams for continuous data where appropriate and explain choice of representation. Ensure learners can draw frequency diagrams from tables which use ≤, < for continuous data intervals. Line graphs Continue to use line graphs where appropriate and explain choice of data representation. Include curved lines that require interpretation Introduce time series graphs to show a trend over time, e.g. Use frequency polygons to represent frequency of grouped data
  • 52. Cambridge Lower Secondary Mathematics 0862 Progression Grid v1.2 52 Ensure learners see the relationship between frequency polygons and frequency diagrams for continuous data, e.g. Scatter graphs Continue to use scatter graphs where appropriate and explain choice of data representation. Use scales such as 1s, 2s, 5s, 10s or decimals such as 0.5s or 0.1s. Continue to use scatter graphs where appropriate and explain choice of data representation. Ensure learners can draw scatter graphs to compare data. For example, plot boys’ and girls’ data on the same graph using a key, or on different graphs, but using the same scales. Use examples that develop understanding of correlation (positive, negative and zero correlation; draw the line of best fit and use it as a model for the relationship). Ensure learners can also describe the strength of the correlation as strong or weak. Infographics Represent data as an infographic. Continue to use infographics where appropriate and explain choice of data representation. Continue to use infographics where appropriate and explain choice of data representation. Stem and leaf Introduce presenting data in stem-and-leaf diagrams Introduce presenting data in back-to-back stem-and- leaf diagrams
  • 53. Cambridge Lower Secondary Mathematics 0862 Progression Grid v1.2 53 Stage 7 Stage 8 Stage 9 7Ss.04 Use knowledge of mode, median, mean and range to describe and summarise large data sets. Choose and explain which one is the most appropriate for the context. 8Ss.04 Use knowledge of mode, median, mean and range to compare two distributions, considering the interrelationship between centrality and spread. 9Ss.04 Use mode, median, mean and range to compare two distributions, including grouped data. Learners should be able to calculate summary statistics for data presented in a frequency table. At this stage they do not need to be able to calculate the mean from a grouped frequency table. e.g. This is the summary of how many pairs of shoes of each size a shop sold last month. Shoe size Frequency 4 4 5 9 6 14 7 11 8 2 Find the mean shoe size, the median shoe size, the modal shoe size, and the range of the shoe sizes. Ensure learners understand what each of these measures mean for this context. Understand that the median of a data set represents the central value when the data is placed in order. The median tends not to be affected by extreme values. The mean calculation takes into account all data items and so can be effected by extreme values. If someone with a shoe size of 14 was added to the above data set, consider how it would affect the value of the mean, median, mode and range. Learners should be able to compare summary data for two or more distributions. e.g. Spelling test results (out of 10) Boys Girls Mean 7.1 8.3 Mode 9 8 Median 6 8 Range 9 5 The mean and median suggests that the girls did better in the spelling test. The range suggests that the girls scores were closer together and so more consistent. Why might the median be a better summary statistic to use for this data? Use examples of:  mode or modal class (include cases where there is no mode)  median (not from grouped data)  mean (not from grouped data)  range (not from grouped data). Learners should be able to calculate an estimate for the mean, the class interval where the median lies, the modal class interval and an estimate for the range for grouped data. e.g. Test score Frequency 0 < t ≤ 20 4 20 < t ≤ 40 11 40 < t ≤ 60 15 60 < t ≤ 80 12 80 < t ≤ 100 8 Find an estimate for the mean, the interval where the median test score lies, the modal class interval, and an estimate for the range of the test scores. Ensure learners understand that when calculating spread and centrality of grouped data:  The mean is an estimate  A precise range cannot be found  The modal class changes depending on how the data is grouped (the mode may not lie in the modal class). The ‘estimate for the range’ should be the maximum possible value of the range.