Interview Study – Successful Career Change Strategies
VHC survey
1. VHC Employee Survey
Katie Schumacher
0
1
2
3
4
5
6
7
8
9
Iam
happyatwork
Ifeelm
o
vated
to
do
agood
job
Iorganize
m
ydesk/area/m
aterialsatw
ork
Ifeelconnnected
to
otherem
ployeesthatIwork
Iw
antto
be
susccessfulatVHC
Ifeelabenefitin
m
ylife
from
w
orkingatVHC
Ilike
goingto
workeveryday
Iwantotherem
ployeesaround
m
e
to
succeed
Iknow
who
to
talkto
ifIhave
aques
on
on
the
job
Ifeelcom
fortable
com
m
unica
ngwith
m
ysupervisor
Im
ake
an
effortto
com
m
unicate
Ifeelknow
edgeable
aboutm
yposi
on
atVHC
Icould
explain
m
ethodsofdoingm
yjob
to
anyone
Iam
knowledgable
aobutVHC
Iknow
how
to
com
m
unicate
w
ith
cow
orkers
Iputin
m
ybesteffortw
hile
atwork
Scale1-9
Ques ons
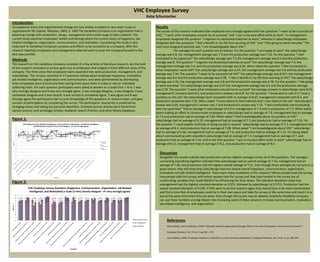
VHC Employee Survey Ques ons (Happiness, Communica on, Organiza on, Job Related
Intelligence, and Mo va on) x Scale (1=Very stronly disagree - 9= very strongly agree)
Avg. Sales/Architects
Avg. Management
Avg. Produc on
Introduction
Occupational stress and organizational change are now widely accepted as two major issues in
organizational life (Vakola, Nikolaou, 2005, p. 160) The Vandehey Company is an organization that is
balancing change with production, design, management and a wide range of sales material. The
current study examines employees’ beliefs and feelings about the current status of happiness, job
related intelligence, organization, communication, and motivation. Completing this study is very
important to Vandehey Company’s purpose and efforts to be successful as a company. With this
research hopefully employees and management alike will work to push the company forward in the
best way possible.
Methods
The research on the Vandehey Company consisted of a few articles of literature research, but the bulk
of the research consisted of surveys given out to employees that ranged in three different areas of the
company. The three areas that employees were separated into were production, management, and
sales/design. The surveys consisted of 17 questions talking about employee happiness, motivation,
job related intelligence, organization and communication, and were administered by distributing
when employees were around and then having them place them in a box or into an individual
collecting them. For each question participants were asked to answer on a scale from 1 to 9. 1 was
very strongly disagree and 9 was very strongly agree. 2 was strongly disagree, 3 was disagree, 4 was
somewhat disagree and 5 was neutral. 6 was scored as somewhat agree, 7 was agree and 8 was
strongly agree.The participants had no prior knowledge of the questions or research topic, and gave
consent of participation by completing the survey. The participants’ anonymity is protected by
changing names and taking out personal identifiers. Scholarly journal articles were found from
various sources such as Google Scholar, Academic Search Premier, and other library databases.
Figure 1:
Results
The results of this research indicated that employees very strongly agreed with the questions “I want to be successful at
VHC,” “I want other employees around me to succeed,” and “I put in my best effort while at work.” In management
employees disagreed the question “I organize my desk/area/materials at work,” whereas in sales/design employees
disagreed with the questions “I feel a benefit in my life from working at VHC” and “I like going to work everyday.” The
next most disagreed question was “I am knowledgeable about VHC.”
The averages for each question are as follows: For the question “I am happy at work” the sales/design
average was 6.8, the management average was 7.2 and the production average was 7.22. For the question “I feel
motivated to do a good job” the sales/design average was 7.2 the management average was 8.3 and the production
average was 8. The question “I organize my desk/area/materials at work” the sales/design average was 7.4, the
management average was 5.4, and the production average was 6.56. When asked the question “I feel connected to
other employees I work with” the sales/design average was 6.67, the management average was 5.8 and the production
average was 7.44. The question “I want to be successful at VHC” the sales/design average was 8.267; the management
average was 8.6 and the production average was 6.78. “I feel a benefit in my life from working at VHC” the sales/design
average was 5.93, the management average was 6.8 and the production average was 6.78. For the question “I like going
to work everyday” the sales/design average was 6.07 the management average was 6.6 and the production average
was 6.78. The question “I want other employees around me to succeed” the average answers in sales/design were 8.53,
management’s answers were 8.2, and production’s answers were 8. For the question “I know who to talk to if I have a
question on the job” the sales/design team answered with an average of 6.67, management answered with 8.4, and
production answered with 7.33. When asked “I know where to find materials that I may need on the job” sales/design’s
answer was 6.64, management’s answer was 7 and production’s answer was 7.33. “I feel comfortable communicating
with my supervisor” had an average in sales/design of 6.8 in management of 7.4 and in production of 7.4. When asked
about making an effort to communicate employees in sales/design had an average of 7.8, management had an average
of 7.4 and production had an average of 7.89. When asked “I feel knowledgeable about my position at VHC”
sales/design had an average of 6.79, management had an average of 7.2 and production had an average of 7.33. For
the question “I could explain methods of doing my job to anyone” sales/design had an average of 7.3, management had
an average of 8.2, and production had an average of 7.89. When asked “I am knowledgeable about VHC” sales/design
had an average of 6.36, management had an average of 7.4, and production had an average of 7.33. For being asked
about communicating with coworkers sales/design had an average of 7.4, management had an average of 7, and
production had an average of 7.44. And in the final question “I put in my best effort while at work” sales/design had an
average of 8.13, management had an average of 8.2, and production had an average of 8.4.
Discussion
Altogether the results indicate that production had the highest averages across all of the questions. The averages
connecting everything together indicated that sales/design had an overall average of 7.10, management had an
average of 7.36, and production had the highest overall average of 7.51. Even though these averages do not vary to a
great extent, they still show that sales/design have the lowest overall happiness, communication, organization,
motivation and job related intelligence. There were many limitations in this research! Where people took the survey,
how people took the survey, with whom people took the survey and how they handed in the survey are all
confounding variables that could GREATLY be influencing the final values. The standard deviations show that
management had the highest standard deviation at 0.573, followed by sales/design at 0.5712. Production had the
lowest standard deviation of 0.530. If VHC were to do this research again they should have it be more standardized
and find a time that all employees could be in their own space and take the survey at the same time and hand it in a
box at the same time when they are done. Even though the results may be skewed, hopefully Vandehey Company
can use these numbers and dig deeper into increasing some of these values to increase communication, motivation,
job related intelligence, and organization!
References
Maria Vakola, Ioannis Nikolaou, (2005) "Attitudes towards organizational change: What is the role of employees’ stress and commitment?",
Employee Relations, Vol. 27 Iss: 2, pp.160 – 174
Harry Matlay, (1999) “Employee relations in small firms: A micro-business perspective”, Employee Relations, Vol. 21 Iss: 3, pp. 285-295
Figure 2:
6.8
7.2
7.4
6.666666667
8.266666667
5.9333333336.066666667
8.533333333
6.6666666676.642857143
6.8
7.8
6.785714286
7.266666667
6.357142857
7.4
8.133333333
7.2
8.3
5.4
5.8
8.6
6.8
6.6
8.2
8.4
7
7.4 7.4
7.2
8.2
7.4
7
8.2
7.222222222
8
6.555555556
7.444444444
8.555555556
6.6666666676.777777778
8
7.3333333337.3333333337.444444444
7.888888889
7.333333333
7.888888889
7.3333333337.444444444
8.388888889
0
1
2
3
4
5
6
7
8
9
I am
happy at w
ork
I feel m
o
vated
to
do
a good
job
I organize
m
y desk/area/m
aterials at w
ork
I feel connnected
to
other em
ployees that I w
ork w
ith
I w
ant to
be
susccessful at VHC
I feel a
benefit in
m
y life
from
w
orking at VHC
I like
going to
w
ork everyday
I w
ant other em
ployees around
m
e
to
succeed
I know
w
ho
to
talk to
if I have
a
ques
on
on
the
job
I know
w
here
to
find
m
aterials that m
ay need
on
the
job
I feel com
fortable
com
m
unica
ng w
ith
m
y supervisor
I m
ake
an
effort to
com
m
unicate
I feel know
edgeable
about m
y posi
on
at VHC
I could
explain
m
ethods of doing m
y job
to
anyone
I am
know
ledgable
aobut VHC
I know
how
to
com
m
unicate
w
ith
cow
orkers
I put in
m
y best effort w
hile
at w
ork
Scale1-9
Ques ons
VHC Employee Survey Ques ons (Happiness, Communica on, Organiza on, Job Related Intelligence,
and Mo va on) x Scale (1=Very stronly disagree - 9= very strongly agree)
Avg. Sales/
Architects
Avg.
Management
Avg.
Produc on