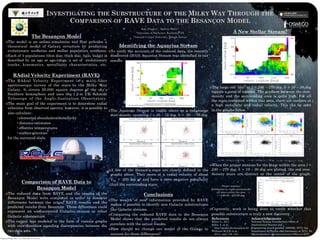
1. A New Stellar Stream?
The large red “eye” at l = 240 – 270 deg, b = 10 – 30 deg
signals a point of interest. The gradient between the over-
density and the surrounding area is quite high. For all
the stars contained within this area, there are outliers at
a high metallicty and radial velocity. This can be seen
in the graphs below.
When the proper motions for the stars within the area l =
240 – 270 deg, b = 10 – 30 deg are plotted, the red over-
density stars are distinct at the center of the graph.
Currently, work is being done to verify whether this
possible substructure is truly a new discovery.
INVESTIGATING THE SUBSTRUCTURE OF THE MILKY WAY THROUGH THE
COMPARISON OF RAVE DATA TO THE BESANÇON MODEL
Kate Hughes1, Andreas Ritter2
1University of Rochester, Rochester, NY
2National Central University, Jhongli,Taiwan
Background Image: http://www.hudsonfla.com/1hst.htm
Acknowledgements
National Science Foundation's Office of
International Science and
Engineering award number 1065093, NCU, the
Department of Physics and Astronomy at NCU, Dr.
Shashi Kanbur, the International Office at NCU
The Besançon Model
The model is an online simulation tool that provides a
theoretical model of Galaxy structure by predicting
evolutionary scenarios and stellar population synthesis.
Each of 4 populations (thin disc, thick disc, halo, bulge) is
described by an age or age-range, a set of evolutionary
tracks, kinematics, metallicity characteristics, etc.
RAdial Velocity Experiment (RAVE)
The RAdial Velocity Experiment is a multi-fiber
spectroscopic survey of the stars in the Milky Way
Galaxy. It covers 20,000 square degrees of the sky’s
Southern hemisphere and uses the 1.2-m UK Schmidt
Telescope of the Anglo-Australian Observatory.
The main goal of the experiment is to determine radial
velocities from observed spectra; however, it is possible to
also calculate:
• elemental abundances/metallicity
• distance estimates
• effective temperatures
• surface gravities
for the surveyed stars.
Comparison of RAVE Data to
Besançon Model
The reduced data from RAVE and the results of the
Besançon Model were compared in order to discover
differences between the actual RAVE results and the
predicted results from Besançon. These differences could
represent an undiscovered Galactic stream or other
Galactic substructure.
The output was modeled in the form of various graphs
with over-densities signaling discrepancies between the
two data sets.
Identifying the Aquarius Stream
To verify the accuracy of the reduced data, the recently
discovered (2010) Aquarius Stream was identified in our
results.
The Aquarius Stream is visible above as a red-orange
over-density spanning l = 30 – 75 deg, b = -50 – -70 deg.
A few of the Stream’s stars are clearly defined in the
graphs above. They move at a radial velocity of about
Vlos = -200 km s-1 and have a more negative metallicity
than the surrounding stars.
Conclusions
The wealth of new information provided by RAVE
makes it possible to identify new Galactic substructures
like Galactic streams.
Comparing the reduced RAVE data to the Besançon
Model shows that the predicted results do not always
correlate with the actual results.
How should we change our model of the Galaxy to
account for these differences?
l = 245 – 250 deg,b = 5 – 10 deg l = 250 – 255 deg,b = 5 – 10 degl = 240 – 245 deg,b = 5 – 10 deg
Proper motions,
declination vs. right ascension for
all stars within the area
l = 240.00 – 255.00 deg.
References
Ritter A., 2011
Robin A. et al.,
http://model.obs-besancon.fr/
Williams M.E.K et al.,
2011, ApJ, 728, 102