1. Visuomotor coordination in a continuous tracking paradigm
Katherine Snyder, Lawrence Cormack, Mary Hayhoe
University of Texas at Austin, Center for Perceptual Systems
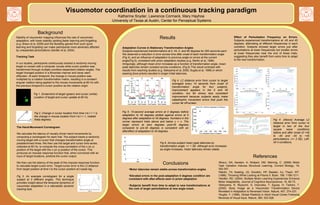
Effect of Perturbation Frequency on Errors.
Subjects experienced transformations at -45 and 45
degrees, alternating at different frequencies in each
condition. Subjects showed larger errors just after
perturbations at lower frequencies but smaller errors
at lower frequencies near the end of these trials,
suggesting they also benefit from extra time to adapt
to the new transformation.
Fig 4. (Above) Average L2
distance error from cursor to
target in two of the four
square wave conditions
before and after onset of +45
to -45 and -45 to +45
perturbations. (+/- 2 SE). Left:
All 4 conditions.
Background
Fig 4. L2 distance error from cursor to target
averaged every 10 seconds from onset of
transformation angle for four subjects.
Improvement appears in the 0 and 45
condition, but 90 shows less consistent
improvement because subjects easily make
catastrophic movement errors that push the
cursor far off-screen.
Fig 5. 10-second average errors at 0 degrees before
adaptation to 45 degrees plotted against errors at 0
degrees after adaptation to 45 degrees. Numbers in the
corner represent trials above and below y = x. The
larger errors at zero degrees post-45 degrees
compared to pre-45 degrees is consistent with an
aftereffect of adaptation to 45 degrees.
Stability of visuomotor mapping influences the rate of visuomotor
adaptation, with lower stability yielding faster learning and forgetting
(e.g. Braun et al, 2009) and the flexibility gained from such quick
learning and forgetting can make participants more adversely affected
by unexpected perturbations (Seidler et al, 2004).
Tracking Task
In our studies, participants continuously tracked a randomly moving
target on screen with a computer mouse while cursor position was
transformed through multiple condition-dependent rotation angles. The
target changed position in a Brownian manner and never went
offscreen. At each timepoint, the change in mouse position was
multiplied by a rotation transformation matrix, resulting in a constant
angular rotation being applied to the mouse movements at 60 Hz with
the previous timepoint’s cursor position as the rotation origin.
Fig 1. Screenshot of target (green) and cursor (white).
Location of target and cursor update at 60 Hz.
Adaptation Curves in Stationary Transformation Angles
Subjects experienced transformations at 0, 45, 0, and 90 degrees for 200 seconds each.
We observed a reduction in error across time after onset of each transformation angle
(Fig 4), and an influence of adaptation to previous angle on errors at the current
angle(Fig 5), consistent with prism adaptation studies (e.g. Martin et al, 1996)
Intriguingly, although mean error increases as a function of transformation angle, mean
peak latencies remain constant across conditions. (Fig 6) This result contrasts with
results from reaching studies (e.g. Sekiyama et al, 2000; Sugita et al, 1996) in which
wearing dove prisms resulted in longer initial latencies.
Fig 6. Across-subject mean peak latencies by
transformation angle, +/- 1 SE. Although error increases
as angle increases, motor latencies remain stable.
Conclusions
•Motor latencies remain stable across transformation angles
•Elevated errors in the post-adaptation 0 degrees condition are
consistent with after-effects seen in prism adaptation
•Subjects benefit from time to adapt to new transformations at
the cost of larger perturbations at new angle onset.
Fig 2. Change in cursor location from time t to t + 1 is
the change in mouse location from t to t + 1, rotated
theta degrees.
The Hand-Movement Correlogram
We calculate the latency of visually-driven hand movements by
computing a correlogram for each trial. The subject tracks a randomly
moving target with a cursor that changes transformation angle at
predetermined times. We then use the target and cursor time series,
collected at 60 Hz, to compute the cross-correlation of the x (or y)
position of the target with the x (or y) position of the cursor. This
produces an impulse response function that, when convolved with an
input of target locations, predicts the cursor output.
We then use the latency of the peak of this impulse response function
to calculate target-cursor error. Target-cursor error is the L2 distance
from target position at time t to the cursor position at t+peak lag.
Fig 3. An example correlogram for a single
subject at 3 different angles. This technique
provides insight about the temporal dynamics of
visuomotor adaptation in a naturalistic dynamic
tracking task.
References
•Braun, DA; Aersten, A; Wolpert, DM; Mehring, C. (2009) Motor
Task Variation Induces Structural Learning. Current Biology, 19,
352-357.
•Martin, TA; Keating, JG; Goodkin, HP; Bastian, AJ; Thach, WT.
(1996). Throwing While Looking at Prisms II. Brain, 199, 1199-1211.
•Seidler, RD. (2004). Multiple Motor Learning Experiences Enhance
Motor Adaptability. Journal of Cognitive Neuroscience, 16, 65-73.
•Sekiyama, K; Miyauchi, S; Imaruoka, T; Egusa, H; Tashiro, T.
(2000). Body Image as a Visuomotor Transformation Device
Revelaed in Adaptation to Reversed Vision. Nature, 407, 374-337.
•Sugita, Y. (1996). Global Plasticity in Adult Visual Cortex Following
Reversal of Visual Input. Nature, 380, 523-526.
Results