Academic Overview - Board Training (Lake Superior State University)
Teacher Rating 2012-2013
1. 75+15+10
REACH is intended to encourage reflection and professional growth in teachers. This report summarizes your teacher practice and
student growth measures for the 2012-13 school year. As a former teacher and principal, I know that all teachers continually strive to
improve and embrace the growth process as they strive to become great teachers.
It's important to balance celebrations (the areas where your practice is strong), with concentrations (the areas where practice can still
improve). I hope that you will utilize this report as an opportunity to improve your practice. Every child in Chicago Public Schools should
have a teacher who encourages that child to achieve at the highest levels. We hope that the REACH evaluation process is useful in
pursuit of our mission that all CPS students graduate prepared for success in college, career and life.
Barbara Byrd-Bennett
CEO, Chicago Public Schools
Teaching Practice: 75%
CPS Framework for Teaching
Student Growth: 15%
REACH Performance Tasks
Student Growth: 10%
Value-Added based on NWEA
MAP
Overall Scores
Summary Report
2012–2013
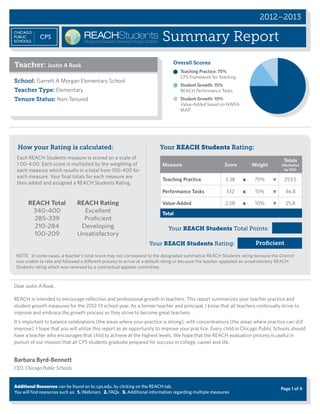
School: Garrett A Morgan Elementary School
Teacher Type: Elementary
Tenure Status: Non-Tenured
Teacher: Justin A Rook
Page 1 of 4Additional Resources can be found on kc.cps.edu, by clicking on the REACH tab.
You will find resources such as: 1. Webinars 2. FAQs 3. Additional information regarding multiple measures
Your REACH Students Rating:
Your REACH Students Total Points:
Proficient
Measure Score Weight
Totals
(Multiplied
by 100)
Teaching Practice 3.38 x 75% = 253.5
Performance Tasks 3.12 x 15% = 46.8
Value-Added 2.58 x 10% = 25.8
Total
Each REACH Students measure is scored on a scale of
1.00-4.00. Each score is multiplied by the weighting of
each measure which results in a total from 100-400 for
each measure. Your final totals for each measure are
then added and assigned a REACH Students Rating.
How your Rating is calculated: Your REACH Students Rating:
Dear Justin A Rook,
REACH Total REACH Rating
340-400 Excellent
285-339 Proficient
210-284 Developing
100-209 Unsatisfactory
NOTE: In some cases, a teacher's total score may not correspond to the designated summative REACH Students rating because the District
was unable to rate and followed a different process to arrive at a default rating or because the teacher appealed an unsatisfactory REACH
Students rating which was reversed by a contractual appeals committee.
2. 75+15+10This page provides you with a summary of your 2012-13 Teaching Practice data. Teaching Practice is measured by classroom observations
and is aligned and rated using the CPS Framework for Teaching.
Observation Data Scoring Calculations
Your observations were scored using the following scale:
Unsatisfactory = 1, Basic = 2, Proficient = 3, Distinguished = 4
Classroom
Teacher
Informal
Classroom
Teacher
Informal
Classroom
Teacher
Formal
Classroom
Teacher
Formal
Component
Average
Domain
Average
Weighting
Weighted
Domain Scores
Date of Observation 1/15/13 2/14/13 4/1/13 4/26/13
Domain1
Planning and
Preparation
25%
1a: Demonstrating Knowledge of Content and Pedagogy 3 4 3.5
3.3 x 25% = 0.83
1b: Demonstrating Knowledge of Students 3 4 3.5
1c: Selecting Instructional Outcomes 2 4 3
1d: Designing Coherent Instruction 3 4 3.5
1e: Designing Student Assessments 2 4 3
Domain2
The Classroom
Environment
25%
2a: Creating an Environment of Respect and Rapport 4 3 3 4 3.5
3.38 x 25% = 0.85
2b: Establishing a Culture for Learning 4 3 3 3 3.25
2c: Managing Classroom Procedures 3 3 3 4 3.25
2d: Managing Student Behavior 4 3 3 4 3.5
Domain3
Instruction 40%
3a: Communicating with Students 4 2 4 3.33
3.33 x 40% = 1.33
3b: Using Questioning and Discussion Techniques 3 3 4 3.33
3c: Engaging Students in Learning 4 3 3 3.33
3d: Using Assessment in Instruction 4 2 4 3.33
3e: Demonstrating Flexibility and Responsiveness 3 3 4 3.33
Domain4
Professional
Responsibilities*
10%
4a: Reflecting on Teaching and Learning 3 4 3.5
3.7 x 10% = 0.37
4b: Maintaining Accurate Records 3
4c: Communicating with Families 4
4d: Growing and Developing Professionally 4
4e: Demonstrating Professionalism 4
For more information regarding observations, visit kc.cps.edu and click on Teaching Practice under REACH. Page 2 of 4
Your REACH Students Teaching Practice score:
Your Teaching Practice: CPS Framework for Teaching scores:
School: Garrett A Morgan Elementary School Teacher Type: Elementary
Tenure Status: Non-Tenured
Teacher: Justin A Rook
3.38(sum of all weighted Domains)
Teaching Practice: 75%
Performance Tasks: 15%
Value-Added: 10%
* Domain components 4B - 4E are rated one time per year
at the end of the school year.
Teaching Practice: CPS Framework for Teaching
3. This page provides you with a summary of your 2012-13 REACH Students Performance Task (PT) data and your Value-Added data.
The percentage of your students that count towards making
Performance Task growth and your adjusted REACH Students
Performance Task score is shown to the right. Teachers whom
did not score at least one student's PT in both BOY and
EOY will receive the median proficient score (3.12). Please
note, roster verification data was used to assign students to
courses. Additional information can be found on kc.cps.edu.
For more information regarding Performance Tasks, visit kc.cps.edu and click on REACH Performance Tasks under Assessments.
For more information regarding Value-Added, visit kc.cps.edu and click on Student Growth under REACH.
Page 3 of 4
Student Growth
Your REACH Students
Performance Task score: 3.12
Your Performance Task score:
Your percentage of students who
count as making PT growth:
The page below shows your value-added results based
on your school's value-added reading scores. Teachers
who teach subjects other than math or reading receive
their school's value-added reading scores. Also, teachers
who taught fewer than 10 students in reading or math
also receive their school's value-added reading scores.
Your REACH Students
Value-Added score: 2.58
Your Value-Added score:
Your Value-Added Results: 0.16
75+15+10
Teaching Practice: 75%
Performance Tasks: 15%
Value-Added: 10%
75+15+10
Teaching Practice: 75%
Performance Tasks: 15%
Value-Added: 10%
School: Garrett A Morgan Elementary School Teacher Type: Elementary
Tenure Status: Non-Tenured
Teacher: Justin A Rook
Subject
Number of
Students
Percentile
Margin of
Error
Value-Added
Result
Reading 101 58 ± 0.78 0.16
Math
4. Page 4 of 4
Value-Added is reported on a standardized scale where scores fall between -3 and +3 and represent a normal “bell curve.” The District average is 0.
Your results represent how many standard deviations your students were from the district average. Below you will find definitions to help interpret
your value-added results.
Number of Students: This is the number of students included
in the calculation.
Percentile: the percent of the scores in the District that are lower
than your score. Percentiles range from 0 to 99.
Margin of Error: Value-Added is a statistical estimation and therefore
is reported with a margin of error. We are 95% confident that your
Value-Added score falls within the margin of error.
Value-Added Result Color: The red, yellow or green represents whether your students
are growing faster, at the same pace, or slower than similar students.
Green indicates that your students are growing at a faster pace than similar students.
Yellow indicates that your students are growing at the same pace as similar students.
Red indicates that your students are growing at a slower pace than similar students.
Glossary
Value-Added Result:
REACH Students Adjusted Value-Added Score:
REACH Performance Task growth scores are based on two parallel assessments: Beginning of Year (BOY) and End of Year (EOY). Performance Tasks
are scored from 0–3. The REACH Performance Task score that counts toward a teacher’s summative REACH rating is based on the percentage of
students who grow. Below are examples of a teacher’s classroom and how students count towards PT growth:
REACH Performance Tasks are scored on a scale of 0-3 and are based on the percentage of students who count as making growth. The REACH Students
Performance Tasks score uses the same scale as all other REACH. To calculate the Adjusted REACH Students score for PTs, the following formula is applied:
Students who count as making growth Students who do not count as making growth
Any point increase in a REACH Performance Task score
counts as growth
Negative REACH Performance Task growth from BOY
to EOY counts as no growth
Examples: BOY: 1 EOY: 2 BOY: 2 EOY: 1
BOY: 1 EOY: 3 BOY: 3 EOY: 1
Mastery scores of 3 on both BOY and EOY REACH
Performance Tasks counts as growth
The same REACH Performance Task score in both BOY and
EOY counts as no growth, except for mastery scores of 3.
Examples: BOY: 3 EOY: 3 BOY: 0 EOY: 0
BOY: 1 EOY: 1
BOY: 2 BOY: 2
How to interpret your Performance Tasks results
How to Interpret Your Value-Added Results:
% of Students who showed PT Growth:
REACH Students Adjusted PT Score:
0%
1.00
50%25% 75%
2.521.76 3.27
100%
4.00
-3.00
1.00
0-1.50 1.50
2.501.75 3.25
3.00
4.00
Below you will find a glossary to help you interpret your Performance Tasks and Value-Added Results.
(Your value-added result ÷ 2) + 2.5 = Adjusted REACH Score
% of Students who Showed PT Growth multiplied by (100 divided by 33) plus 1 = Adjusted REACH Score
Additional Resources can be found on kc.cps.edu, by clicking on the REACH tab.
You will find resources such as: 1. Webinars 2. FAQs 3. Additional information regarding multiple measures
For more information regarding Value-Added, visit kc.cps.edu and click on Student Growth under REACH.