Framework_for_Great_Schools_Report_2016_K147-2
•
0 likes•41 views

This document summarizes survey response rates, student outcomes, framework elements, and essential supports for P.S. 147 Isaac Remsen elementary school. It includes data from the 2014-2015 school year on teacher and parent survey response rates, student achievement levels, quality review ratings, and survey results on areas like rigorous instruction, collaborative teachers, and supportive environment.

Recommended
Recommended
More Related Content
What's hot
What's hot (19)
Similar to Framework_for_Great_Schools_Report_2016_K147-2
Similar to Framework_for_Great_Schools_Report_2016_K147-2 (20)
Framework_for_Great_Schools_Report_2016_K147-2
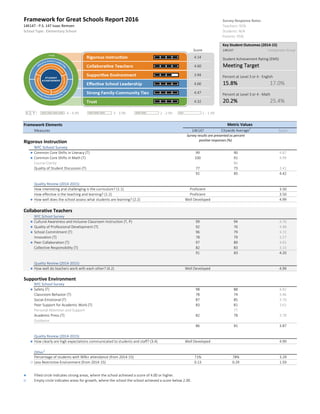
- 1. Framework for Great Schools Report 2016 Survey Response Rates Teachers: 92% School Type: Elementary School Students: N/A Parents: 95% Key Student Outcomes (2014-15) Score 14K147 Comparison Group 4.14 Student Achievement Rating (EMS) 4.60 Meeting Target 3.94 Percent at Level 3 or 4 - English 4.66 15.8% 17.0% 4.47 Percent at Level 3 or 4 - Math 4.32 20.2% 25.4% Framework Elements Measures 14K147 Citywide Average 1 Score Rigorous Instruction NYC School Survey ● Common Core Shifts in Literacy (T) 99 90 4.87 ● Common Core Shifts in Math (T) 100 91 4.99 Course Clarity 86 Quality of Student Discussion (T) 77 73 3.41 92 85 4.42 Quality Review (2014-2015) How interesting and challenging is the curriculum? (1.1) Proficient 3.50 How effective is the teaching and learning? (1.2) Proficient 3.50 ● How well does the school assess what students are learning? (2.2) Well Developed 4.99 Collaborative Teachers NYC School Survey ● Cultural Awareness and Inclusive Classroom Instruction (T, P) 99 94 4.76 ● Quality of Professional Development (T) 92 76 4.48 ● School Commitment (T) 96 79 4.72 Innovation (T) 78 79 3.27 ● Peer Collaboration (T) 97 89 4.65 Collective Responsibility (T) 82 83 3.33 91 83 4.20 Quality Review (2014-2015) ● How well do teachers work with each other? (4.2) Well Developed 4.99 Supportive Environment NYC School Survey ● Safety (T) 98 88 4.82 Classroom Behavior (T) 78 74 3.46 Social-Emotional (T) 87 85 3.70 Peer Support for Academic Work (T) 83 81 3.61 Personal Attention and Support 77 Academic Press (T) 82 78 3.78 Guidance 86 81 3.87 Quality Review (2014-2015) ● How clearly are high expectations communicated to students and staff? (3.4) Well Developed 4.99 Other 2 Percentage of students with 90%+ attendance (from 2014-15) 71% 78% 3.29 ○ Less Restrictive Environment (from 2014-15) 0.13 0.29 1.93 ● Filled circle indicates strong areas, where the school achieved a score of 4.00 or higher. ○ Empty circle indicates areas for growth, where the school the school achieved a score below 2.00. 14K147 - P.S. 147 Isaac Remsen Metric Values Survey results are presented as percent positive responses (%). 4 - 4.99 3 - 3.99 2 - 2.99 1 - 1.99KEY:
- 2. Essential Supports Measures 14K147 Citywide Average 1 Score Effective School Leadership NYC School Survey ● Inclusive Leadership (P) 97 93 4.33 ● Teacher Influence (T) 91 78 4.40 ● Program Coherence (T) 99 83 4.92 ● Instructional Leadership (T) 100 86 4.99 97 85 4.66 Strong Family-Community Ties NYC School Survey ● Outreach to Parents (T, P) 98 94 4.56 ● Parent Involvement in School (P) 94 87 4.37 96 91 4.47 Trust NYC School Survey ● Teacher-Parent Trust (P) 98 95 4.27 ● Parent-Principal Trust (P) 97 93 4.37 Student-Teacher Trust 83 ● Teacher-Principal Trust (T) 99 81 4.93 Teacher-Teacher Trust (T) 88 87 3.70 96 88 4.32 Notes 1 The citywide averages are among the same school type only (not among all school types). 2 QR S Question-level results for the NYC School Survey will be available later in the summer. ● Filled circle indicates strong areas, where the school achieved a score of 4.00 or higher. ○ Empty circle indicates areas for growth, where the school the school achieved a score below 2.00. Links Framework Report Technical Guide http://schools.nyc.gov/NR/rdonlyres/545A70F8-38FD-430C-948B-3F6067665420/0/FrameworkReportTechnicalGuide692016.pdf School Quality Guide http://schools.nyc.gov/OA/SchoolReports/2014-15/School_Quality_Guide_2015_EMS_K147.pdf * Key Student Outcomes (2013-14) 14K147 school target 1 N/A FALSE FALSE FALSE FALSE FALSE FALSE Student Progress Rating (EMS) Meeting Target Percent at Level 3 or 4 - English N/A N/A Percent at Level 3 or 4 - Math N/A N/A For the School Quality Guides, the percentage of students with 90%+ attendance and least restrictive environment metrics are calculated separately for EMS grades and HS grades. In this Framework Report, if a school spans both EMS and HS grades, the EMS and HS values (and scores) are averaged into one school value (and score). Quality Review data are not available for all schools at the time of report publication. A school's most recent published ratings are included if the review took place after August 2013. Schools that opened within the last three years and schools whose most recent review took place before August 2013 may not have updated data. Quality Review reports published after May 19, 2016 were not available to be included in the production of this Framework Report. The 2015-16 School Quality Reports, scheduled to be released in Fall 2016, will include this additional 2015-16 Quality Review data. Metric Values Survey results are presented as percent positive responses (%).