Recommended

Recommended
More Related Content
What's hot
What's hot (20)
Similar to Research Project Poster
Similar to Research Project Poster (20)
Research Project Poster
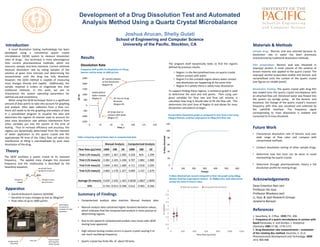
- 1. A novel dissolution testing methodology has been developed using a commercial quartz crystal microbalance (QCM) system to measure dissolution rates of drugs. Our technique is more advantageous than current pharmaceutical methods, which are resource, sample, and time intensive. Current methods measure dissolution rate by taking samples of the solution at given time intervals and determining the concentration until the drug has fully dissolved. However, the QCM method is capable of measuring mass changes directly and rapidly. Additionally, the sample required is orders of magnitude less than traditional methods. In this work, we aim to characterize the system operating parameters for optimal use and consistency. When using the QCM technique there is a significant amount of data points to take into account for graphing and analysis. After data collection from a flow run, there still needs to be the graphing and analysis of data in a spreadsheet program to visualize the data and determine the regions of interest used to account for total mass dissolution rate without interference from other variables put into the system at the time of testing. Thus to increase efficiency and accuracy, the regions are dynamically determined from the moment of water application to the quartz crystal and the approximate fill time of the 150uL flow cell when the interference of filling is overshadowed by pure mass dissolution of the drug. Dean Emeritus Ravi Jain Professor Xin Guo Professor Bhaskara Jasti Li, Guo, & Jasti Research Groups Janpierre Bonoan Development of a Drug Dissolution Test and Automated Analysis Method Using a Quartz Crystal Microbalance Joshua Arucan, Shelly Gulati School of Engineering and Computer Science University of the Pacific, Stockton, CAIntroduction Acknowledgements Dissolution Rate Theory The QCM oscillates a quartz crystal to its resonant frequency. The applied mass changes this resonant frequency and the relationship is described by the Sauerbrey equation, Materials & Methods References 1. Sauerbrey, G. Z.Phys. 1959,755, 206. 2. Frequency of a quartz microbalance in contact with liquid Kanazawa, K. and Gordon, J. Analytical Chemistry 1985 57 (8), 1770-1771 3. Drug dissolution rate measurements – evaluation of the rotating disc method. Kaunisto, E. et al. Pharmaceutical Development and Technology. 2009 14:4, 400-408 Δfm = Cf Δm frequency change sensitivity factor (property of quartz) change in mass per unit area Apparatus • Stanford Research Systems QCM200 • Sensitive to mass changes as low as 18ng/cm2 • Flow rates of up to 1000 μl/min Syringe pump drives flow Flow cell Quartz crystal with drug film inside housing QCM system connected to computer for data acquisition -1500 -1000 -500 0 500 1000 1500 2000 2500 0 25 50 75 100 125 150 ∆F,Hz Time, s ΔF drops due to contact with water (Region II) ΔF rises as drug dissolves (Region III) ΔF reaches plateau at full dissolution (Region III) Stable before water contact (Region I) Frequency shift profile for dissolution of 150 μg benzoic acid by water at 1000 μL/min Results Sample drug: Benzoic acid was selected because its dissolution rate in water has been previously characterized by traditional dissolution methods. Film preparation: Benzoic acid was dissolved in isopropyl alcohol. A small volume of the solution of known molarity was applied to the quartz crystal. The isopropyl alcohol evaporated readily and benzoic acid recrystallized onto the surface of the quartz crystal (see figures on middle panel). Dissolution Testing: The quartz crystal with drug film was loaded onto the quartz crystal microbalance with an attached flow cell. Deionized water was flowed into the system via syringe pump. As the benzoic acid dissolved, the change of the quartz crystal’s resonant frequency with time was visualized and collected by the LabVIEW interface. The frequency signal corresponding to mass dissolution is isolated and converted to % mass dissolved. Future Work • Characterize dissolution rate of benzoic acid over wide range of flow rates and compare with conventional methods. • Conduct dissolution testing of other sample drugs. • Determine how fast tests can be done to avoid overworking the quartz crystal. • Determine through pharmacokinetic theory a full dissolution profile for testing drugs The program itself dynamically looks to find the regions defined by previous results: To support finding these regions, a resistance graph is used to determine the start and end points. Then using user given variables for flow rate and flow cell volume, it calculates how long it should take to fill the flow cell. This determines the start time of Region III and allows for mass dissolution calculations to begin. • Region I is the Recrystallized mass on quartz crystal before contact with water • Region II is the unstable region where water contact and dissolution are happening at the same time • Region III is where there is solely mass dissolution 0 20 40 60 80 100 120 0 100 200 300 400 500 600 %MassDissolved Time(s) Percent Mass Dissolution graph as compared to time from a test using 150μg of Benzoic acid/2μL Isopropanol at 100μL/min flow rate 0 0.5 1 1.5 2 2.5 3 3.5 4 4.5 5 0 200 400 600 800 1000 1200 %mass/s Flow Rate (μL/min) Manual Analysis Computerized Analysis % Mass dissolved per second compared to flow rate graph using 100μg Benzoic Acid/2μL Isopropanol solution. At 1000μL/min, both data points occupy the same % mass/s value. Manual Analysis Computerized Analysis Flow Rate (μL/min) 1000 100 50 1000 100 50 Trial 1 (% mass/s) 4.805 1.367 2.005 3.528 N/A 2.299 Trial 2 (% mass/s) 4.382 3.105 1.248 3.707 1.882 1.880 Trial 3 (% mass/s) 3.844 2.455 1.680 4.711 2.018 2.020 Trial 4 (% mass/s) 3.083 1.178 1.327 4.069 1.157 1.679 Average (% mass/s) 4.029 2.026 1.565 4.0038 1.6857 1.9695 STD 0.743 0.913 0.348 0.522 0.463 0.260 Table comparing original thesis data to computerized data. • Computerized analysis data matches Manual Analysis data. • Manual analysis data contained higher standard deviation values, which indicates that the computerized analysis is more precise at determining regions. • Due to the speed of computerized analysis new issues with QCM testing have appeared. • High volume testing creates errors in quartz crystal causing it to not reach oscillating frequency. • Quartz crystal has finite life of about 50 tests. Summary of Findings