
Recommended
More Related Content
Similar to Oregon Transportation Report
Similar to Oregon Transportation Report (20)
More from Jonathan Hunt
More from Jonathan Hunt (9)
Recently uploaded
Recently uploaded (20)
Oregon Transportation Report
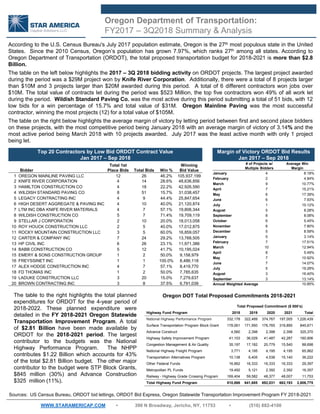
- 1. Sources: US Census Bureau, ORDOT bid lettings, ORDOT Bid Express, Oregon Statewide Transportation Improvement Program FY 2018-2021 WWW.STARAMERICAP.COM • 390 N Broadway, Jericho, NY, 11753 • (516) 882-4100 Oregon Department of Transportation: FY2017 – 3Q2018 Summary & Analysis According to the U.S. Census Bureau's July 2017 population estimate, Oregon is the 27th most populous state in the United States. Since the 2010 Census, Oregon’s population has grown 7.97%, which ranks 27th among all states. According to Oregon Department of Transportation (ORDOT), the total proposed transportation budget for 2018-2021 is more than $2.8 Billion. The table on the left below highlights the 2017 – 3Q 2018 bidding activity on ORDOT projects. The largest project awarded during the period was a $29M project won by Knife River Corporation. Additionally, there were a total of 8 projects larger than $10M and 3 projects larger than $20M awarded during this period. A total of 6 different contractors won jobs over $10M. The total value of contracts let during the period was $523 Million, the top five contractors won 49% of all work let during the period. Wildish Standard Paving Co. was the most active during this period submitting a total of 51 bids, with 12 low bids for a win percentage of 15.7% and total value of $31M. Oregon Mainline Paving was the most successful contractor, winning the most projects (12) for a total value of $105M. The table on the right below highlights the average margin of victory by letting period between first and second place bidders on these projects, with the most competitive period being January 2018 with an average margin of victory of 3.14% and the most active period being March 2018 with 10 projects awarded. July 2017 was the least active month with only 1 project being let. The table to the right highlights the total planned expenditures for ORDOT for the 4-year period of 2018-2022. These planned expenditure were detailed in the FY 2018-2021 Oregon Statewide Transportation Improvement Program. A total of $2.81 Billion have been made available by ORDOT for the 2018-2021 period. The largest contributor to the budgets was the National Highway Performance Program. The NHPP contributes $1.22 Billion which accounts for 43% of the total $2.81 Billion budget. The other major contributor to the budget were STP Block Grants, $845 million (30%) and Advance Construction $325 million (11%). Top 20 Contractors by Low Bid ORDOT Contract Value Jan 2017 – Sep 2018 Bidder Total 1st Place Bids Total Bids Win % Winning Bid Value 1 OREGON MAINLINE PAVING LLC 12 26 46.2% 105,937,199 2 KNIFE RIVER CORPORATION 4 14 28.6% 48,636,856 3 HAMILTON CONSTRUCTION CO 4 18 22.2% 42,926,590 4 WILDISH STANDARD PAVING CO 8 51 15.7% 31,038,457 5 LEGACY CONTRACTING INC 4 9 44.4% 25,847,654 6 HIGH DESERT AGGREGATE & PAVING INC 4 10 40.0% 21,120,874 7 LTM INC DBA KNIFE RIVER MATERIALS 4 7 57.1% 19,806,344 8 WILDISH CONSTRUCTION CO 5 7 71.4% 19,709,119 9 STELLAR J CORPORATION 2 10 20.0% 18,013,058 10 ROY HOUCK CONSTRUCTION LLC 2 5 40.0% 17,012,875 11 ROCKY MOUNTAIN CONSTRUCTION LLC 3 5 60.0% 16,859,057 12 CARTER & COMPANY INC 7 24 29.2% 13,768,505 13 HP CIVIL INC 6 26 23.1% 11,971,386 14 BABB CONSTRUCTION CO 5 12 41.7% 10,195,024 15 EMERY & SONS CONSTRUCTION GROUP 1 2 50.0% 9,158,979 16 FREYSSINET INC 1 1 100.0% 8,486,118 17 ALEX HODGE CONSTRUCTION INC 4 7 57.1% 8,419,770 18 FD THOMAS INC 1 2 50.0% 7,785,635 19 LADUKE CONSTRUCTION LLC 3 20 15.0% 7,279,637 20 BROWN CONTRACTING INC 3 8 37.5% 6,791,039 Margin of Victory ORDOT Bid Results Jan 2017 – Sep 2018 # of Projects w/ Multiple Bidders Average Win Margin January 4 8.18% February 2 4.84% March 9 10.77% April 7 15.21% May 6 17.39% June 6 7.93% July 1 10.12% August 5 8.28% September 8 8.08% October 6 5.45% November 8 7.80% December 5 8.59% January 5 3.14% February 7 17.51% March 10 12.94% April 8 5.49% May 7 10.92% June 7 14.07% July 5 19.28% August 3 16.40% September 3 13.14% Annual Weighted Average 10.85% Total Proposed Commitment ($ 000’s) Highway Fund Program 2018 2019 2020 2021 Total National Highway Performance Program 332,178 322,489 374,767 197,005 1,226,439 Surface Transportation Program Block Grant 178,061 171,950 176,765 318,895 845,671 Advance Construct 4,560 2,398 2,398 2,398 325,370 Highway Safety Improvement Program 41,103 36,029 41,487 42,287 160,906 Congestion Management & Air Quality 35,197 17,182 20,779 15,540 88,698 National Highway Freight Program 3,771 4,195 4,195 4,195 65,962 Transportation Alternatives Program 10,138 6,405 4,538 15,140 36,222 Other Federal Funds 16,962 16,333 16,333 16,333 29,397 Metropolitan PL Funds 19,492 5,121 2,392 2,392 16,357 Railway - Highway Grade Crossing Program 169,404 59,582 48,377 48,007 11,753 Total Highway Fund Program 810,866 641,685 692,031 662,193 2,806,775 Oregon DOT Total Proposed Commitments 2018-2021
- 2. Why We Are Different Star America Global Reach Focused Strictly on Infrastructure • Management has years of experience in the Infrastructure Industry • Solely focused on advising public and private clients in the Infrastructure/Construction sector Broad Range of Advisory Services • M&A, Project Financing, Strategic Consulting, Restructuring, Executive Placement, and Financial Analysis • All Industry Sub-Sectors Experience in All Major Infrastructure Markets • Star America has worked in all infrastructure markets, including Civil Construction, Vertical Building, Public-Private Partnerships, Industrial Business Development Mergers & Acquisitions PPP Financial Advisory Management Consulting Capital Raising Strategic & Financial Analysis Star is well qualified to assist clients in developing their business plans in the U.S. Given the depth of experience of its partners and operating professionals, the company offers access to thought leadership of C-Level executives. We have a strong track record in both domestic and cross- border M&A advisory roles. We operate both negotiated processes and auctions, assist in deal structuring, and provide impartial advice about the merits of transactions in our industry of focus. Star provides financial advisory services to companies and consortia seeking to participate in alternative procurement processes. We advise on debt capital raising in the bank and bond markets, and help structure competitive bids for our clients. We work with clients to formulate and pursue strategic and tactical goals. Star provides true business solutions, including identifying potential management hires, developing and implementing marketing plans, and increasing operational efficiencies. We maintain contacts at banks, hedge funds, equipment finance companies, and other financial firms. These are sources of capital for clients desiring funds for expansionary capital expenditures or general operating cash flow needs. Industry analytics form the core of a successful financing or business development strategy. With our significant industry knowledge, we assess companies’ current and projected financial and competitive positions to provide actionable recommendations. We have the capacity to provide comprehensive financial analysis as well as contractor prequalification solutions, allowing contractors to properly vet lower tiers and improve overall capital strength. Star America Capital Advisors, LLC Services Overview Service Offerings Disclaimer: This material is for informational purposes only. It should not be relied on for any other purposes. The goal of this report is to help market participants critically asses each state's expected infrastructure budgets and competitive environment. WWW.STARAMERICAP.COM • 390 N Broadway, Jericho, NY, 11753 • (516) 882-4100