
Recommended
Recommended
More Related Content
What's hot
What's hot (11)
Similar to Illinois DOT 2017 Summary & Analysis
Similar to Illinois DOT 2017 Summary & Analysis (20)
More from Jonathan Hunt
More from Jonathan Hunt (9)
Recently uploaded
Recently uploaded (20)
Illinois DOT 2017 Summary & Analysis
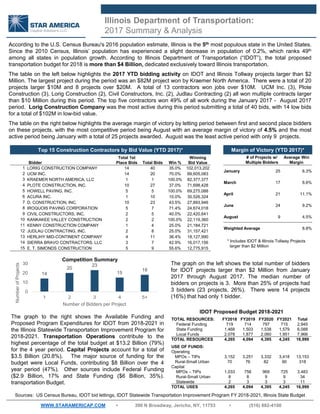
- 1. Sources: US Census Bureau, IDOT bid lettings, IDOT Statewide Transportation Improvement Program FY 2018-2021, Illinois State Budget WWW.STARAMERICAP.COM • 390 N Broadway, Jericho, NY, 11753 • (516) 882-4100 Illinois Department of Transportation: 2017 Summary & Analysis According to the U.S. Census Bureau's 2016 population estimate, Illinois is the 5th most populous state in the United States. Since the 2010 Census, Illinois’ population has experienced a slight decrease in population of 0.2%, which ranks 49th among all states in population growth. According to Illinois Department of Transportation (“IDOT”), the total proposed transportation budget for 2018 is more than $4 Billion, dedicated exclusively toward Illinois transportation. The table on the left below highlights the 2017 YTD bidding activity on IDOT and Illinois Tollway projects larger than $2 Million. The largest project during the period was an $82M project won by Kraemer North America. There were a total of 20 projects larger $10M and 8 projects over $20M. A total of 13 contractors won jobs over $10M. UCM Inc. (3), Plote Construction (3), Lorig Construction (2), Civil Constructors, Inc. (2), Judlau Contracting (2) all won multiple contracts larger than $10 Million during this period. The top five contractors won 49% of all work during the January 2017 - August 2017 period. Lorig Construction Company was the most active during this period submitting a total of 40 bids, with 14 low bids for a total of $102M in low-bid value. The table on the right below highlights the average margin of victory by letting period between first and second place bidders on these projects, with the most competitive period being August with an average margin of victory of 4.5% and the most active period being January with a total of 25 projects awarded. August was the least active period with only 9 projects. The graph on the left shows the total number of bidders for IDOT projects larger than $2 Million from January 2017 through August 2017. The median number of bidders on projects is 3. More than 25% of projects had 3 bidders (23 projects, 26%). There were 14 projects (16%) that had only 1 bidder. The graph to the right shows the Available Funding and Proposed Program Expenditures for IDOT from 2018-2021 in the Illinois Statewide Transportation Improvement Program for 2018-2021. Transportation Operations contribute to the highest percentage of the total budget at $13.2 Billion (79%) for the 4 year period. Capital Projects account for a total of $3.5 Billion (20.8%). The major source of funding for the budget were Local Funds, contributing $8 Billion over the 4 year period (47%). Other sources include Federal Funding ($2.9 Billion, 17% and State Funding ($6 Billion, 35%). transportation Budget. IDOT Proposed Budget 2018-2021 TOTAL RESOURCES: FY2018 FY2019 FY2020 FY2021 Total Federal Funding 719 714 797 715 2,945 State Funding 1,468 1,503 1,538 1,579 6,088 Local Funds 2,078 1,877 2,060 1,951 7,966 TOTAL RESOURCES 4,265 4,094 4,395 4,245 16,999 USE OF FUNDS: Operating MPOs – TIPs 3,152 3,251 3,332 3,418 13,153 Rural-Small Urban 70 76 82 90 318 Capital MPOs – TIPs 1,033 756 969 725 3,483 Rural-Small Urban 8 8 9 9 34 Statewide 2 3 3 3 11 TOTAL USES 4,265 4,094 4,395 4,245 16,999 Top 15 Construction Contractors by Bid Value (YTD 2017)* Margin of Victory (YTD 2017)* Bidder Total 1st Place Bids Total Bids Win % Winning Bid Value # of Projects w/ Multiple Bidders Average Win Margin 1 LORIG CONSTRUCTION COMPANY 14 40 35.0% 102,013,202 January 25 6.3% 2 UCM INC. 14 20 70.0% 89,605,083 3 KRAEMER NORTH AMERICA, LLC 1 1 100.0% 82,377,377 March 17 8.6% 4 PLOTE CONSTRUCTION, INC. 10 27 37.0% 71,698,428 5 HOWELL PAVING, INC. 5 5 100.0% 69,275,088 April 21 11.1% 6 ACURA INC. 1 10 10.0% 30,526,324 7 D. CONSTRUCTION, INC. 10 23 43.5% 27,893,946 June 24 9.2% 8 IROQUOIS PAVING CORPORATION 5 7 71.4% 24,674,018 9 CIVIL CONSTRUCTORS, INC. 2 5 40.0% 22,420,641 August 9 4.5% 10 KANKAKEE VALLEY CONSTRUCTION 2 2 100.0% 22,119,360 11 KENNY CONSTRUCTION COMPANY 1 4 25.0% 21,184,721 Weighted Average 8.8% 12 JUDLAU CONTRACTING, INC. 2 8 25.0% 31,157,421 13 HERLIHY MID-CONTINENT COMPANY 4 11 36.4% 18,127,990 14 SIERRA BRAVO CONTRACTORS, LLC 3 7 42.9% 16,017,156 15 E. T. SIMONDS CONSTRUCTION 5 9 55.6% 12,775,915 14 20 23 15 18 0 10 20 30 1 2 3 4 5+ NumberofProjects Number of Bidders per Project Competition Summary * Includes IDOT & Illinois Tollway Projects larger than $2 Million
- 2. Why We Are Different Star America Global Reach Focused Strictly on Infrastructure • Management has years of experience in the Infrastructure Industry • Solely focused on advising public and private clients in the Infrastructure/Construction sector Broad Range of Advisory Services • M&A, Project Financing, Strategic Consulting, Restructuring, Executive Placement, and Financial Analysis • All Industry Sub-Sectors Experience in All Major Infrastructure Markets • Star America has worked in all infrastructure markets, including Civil Construction, Vertical Building, Public-Private Partnerships, Industrial Business Development Mergers & Acquisitions PPP Financial Advisory Management Consulting Capital Raising Strategic & Financial Analysis Star is well qualified to assist clients in developing their business plans in the U.S. Given the depth of experience of its partners and operating professionals, the company offers access to thought leadership of C-Level executives. We have a strong track record in both domestic and cross- border M&A advisory roles. We operate both negotiated processes and auctions, assist in deal structuring, and provide impartial advice about the merits of transactions in our industry of focus. Star provides financial advisory services to companies and consortia seeking to participate in alternative procurement processes. We advise on debt capital raising in the bank and bond markets, and help structure competitive bids for our clients. We work with clients to formulate and pursue strategic and tactical goals. Star provides true business solutions, including identifying potential management hires, developing and implementing marketing plans, and increasing operational efficiencies. We maintain contacts at banks, hedge funds, equipment finance companies, and other financial firms. These are sources of capital for clients desiring funds for expansionary capital expenditures or general operating cash flow needs. Industry analytics form the core of a successful financing or business development strategy. With our significant industry knowledge, we assess companies’ current and projected financial and competitive positions to provide actionable recommendations. We have the capacity to provide comprehensive financial analysis as well as contractor prequalification solutions, allowing contractors to properly vet lower tiers and improve overall capital strength. Star America Capital Advisors, LLC Services Overview Service Offerings Disclaimer: This material is for informational purposes only. It should not be relied on for any other purposes. The goal of this report is to help market participants critically asses each state's expected infrastructure budgets and competitive environment. WWW.STARAMERICAP.COM • 390 N Broadway, Jericho, NY, 11753 • (516) 882-4100