
Recommended
Recommended
More Related Content
Recently uploaded
Recently uploaded (11)
Featured
Featured (20)
1. wage realignment impact (1)
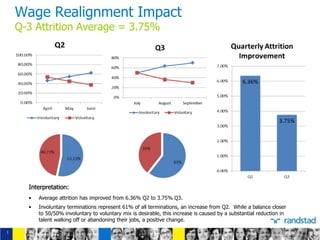
- 1. Interpretation: • Average attrition has improved from 6.36% Q2 to 3.75% Q3. • Involuntary terminations represent 61% of all terminations, an increase from Q2. While a balance closer to 50/50% involuntary to voluntary mix is desirable, this increase is caused by a substantial reduction in talent walking off or abandoning their jobs, a positive change. Wage Realignment Impact Q-3 Attrition Average = 3.75% 1
- 2. Average weekly occurrence (incl. SDO) per shift: 1st: 2.31 2nd: 3.85 3rd: 3.15 Total Call Outs per shift 1st: 7 2nd: 15 3rd: 8 Interpretation: • Scheduled Day Off is an approved absence and these have been included because they may affect production. • Total call out reduction of 16% - from 36 Q2 to 30 Q3; 34 occurrences (28%) by talent no longer employed. 0 2 4 6 8 10 12 7/3 7/107/177/247/31 8/7 8/148/218/28 9/4 9/119/189/25 2nd Shift SDO NCNS LA CO 0 1 2 3 4 5 6 7 8 9 7/3 7/107/177/247/31 8/7 8/148/218/28 9/4 9/119/189/25 1st Shift SDO NCNS LA CO 0 1 2 3 4 5 6 7 8 9 7/3 7/107/177/247/31 8/7 8/148/218/28 9/4 9/119/189/25 3rd Shift SDO NCNS LA CO Wage Realignment Impact Q-3 Attendance Average = 99.2% 2
- 3. Total cost of turnover determined using 4 cost buckets and the average weekly turnover by position for the quarter 1. Training Cost: Dollar value calculated for both talent and mentor/trainer hours with 0% productivity 2. Fill Time Cost: Dollar value calculated for time needed to fill position based on overtime used to cover production gap 3. Onboarding Cost: Dollar value assigned to client-incurred onboarding cost 4. Waste Cost: Dollar value will also be assigned to waste – Q1 2017 Bagger: turnover reduction (3.79 to 2.08 talent) $ 25,813.88 Core operator: turnover reduction (.28 to .15 talent) $ 9,872.93 Q-3 Total Cost Savings $ 35,686.81 Wage Realignment Impact Cost savings analysis 3
Editor's Notes
- Cost of turnover Bagger: $1161 Bill rate calculated using Q3 active average bill rate for this position Mentor cost estimated using average wage for this position ($10.99) +$1 * 130% Core operator: $5842 Bill rate calculated using Q3 active average bill rate for this position Mentor cost estimated using average wage for this position ($13.27) +$1 * 130% Mechanically inclined to pick up core operator; physical aspect;