Samir Rafla. top 10 misconceptions about the new prevention guidelines
Niraj_Pandey_Summary_InvDiab
1. Estimating Lipid Management Guidelines' Risk Value of a Life-year on Treatment
Niraj Kumar Pandey, M.S., Murat Kurt, Ph.D., Mark H. Karwan, Ph.D.
Department of Industrial and Systems Engineering
University at Buffalo
The State University of New York
Background:
Diabetes, the 7th
leading cause of death in the US, is a group of chronic diseases characterized by high blood glucose
and can cause fatal and non-fatal health complications, including coronary heart disease (CHD), stroke and kidney
failure. Currently, over 25 million people in the US have been diagnosed with diabetes. Caused by ineffective use of
insulin, Type 2 diabetes is the most common type of diabetes in the US and accounts for more than 95% of cases.
Per person direct medical cost of treating diabetes
and its complications, during a lifetime, has been
estimated to range from $55,000 to $130,000, with an
average of $85,000.
Historically, the main goal of Type 2 diabetes
treatment has been the control of blood glucose, but
recently the increase in the risk of CHD and stroke
arising from lipid abnormalities has increased the
emphasis on cholesterol management. Statins are
used to manage high cholesterol by decreasing
patients’ CHD and stroke risks. While they reduce the
risk of CHD and stroke, they may lead to side effects
including damages on liver functionality and extreme
muscle inflammation. Although the complexity of the
statin initiation decision has led to the formation of
various national guidelines, there have not been any
numerical methods (only surveys) to quantify the
adverse effects of statin treatment on patients'
quality of life to help physicians make better
treatment decisions.
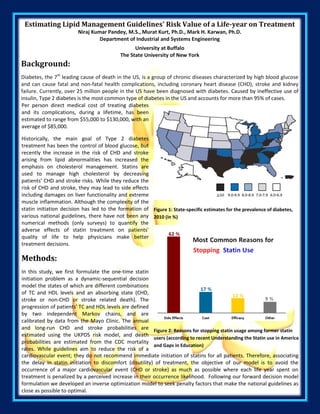
Figure 1: State-specific estimates for the prevalence of diabetes,
2010 (in %)
Methods:
In this study, we first formulate the one-time statin
initiation problem as a dynamic-sequential decision
model the states of which are different combinations
of TC and HDL levels and an absorbing state (CHD,
stroke or non-CHD or stroke related death). The
progression of patients' TC and HDL levels are defined
by two independent Markov chains, and are
calibrated by data from the Mayo Clinic. The annual
and long-run CHD and stroke probabilities are
estimated using the UKPDS risk model, and death
probabilities are estimated from the CDC mortality
rates. While guidelines aim to reduce the risk of a
primary
Figure 2: Reasons for stopping statin usage among former statin
users (according to recent Understanding the Statin use in America
and Gaps in Education)
cardiovascular event; they do not recommend immediate initiation of statins for all patients. Therefore, associating
the delay in statin initiation to discomfort (disutility) of treatment, the objective of our model is to avoid the
occurrence of a major cardiovascular event (CHD or stroke) as much as possible where each life year spent on
treatment is penalized by a perceived increase in their occurrence likelihood. Following our forward decision model
formulation we developed an inverse optimization model to seek penalty factors that make the national guidelines as
close as possible to optimal.
2. Results:
In our numerical experiments, we considered seven national guidelines from five different countries/continents: US
(Adult Treatment Panel (ATP) III and its modified version, ATP III*, considering diabetes a CHD-risk equivalent),
Canada, Europe, U.K., New Zealand and Australia. Our results demonstrated that among these guidelines the penalty
factors ranged from 0.07% to 0.23% for males and from 0.04% to 0.29% for females (see Figure 3). Among all
considered guidelines, ATP III* had the longest expected treatment duration for both genders: 27 years for males and
32 years for females. Moreover, it favored a year of statin use even if it only provides a decrease in the risk of a major
cardiovascular event by 0.07% for males and 0.045% for females. For each guideline, under the treatment disutility it
perceives, we also calculated how many years less the patients can be treated without increasing the overall risk of a
major cardiovascular event. The over-treatment durations under the guidelines ranged from 0.08 years to 1.85 years
for males and 0.19 years to 4.43 years for females (see Table 1).
Table 1: Optimality gaps, expected life-years on treatment
and the over-treatment durations under various guidelines
Figure 3: Penalty factors for being on treatment for one year and
the associated expected overall risk of a major cardiovascular
event under various guidelines
Finally, we assessed the variation in ATP III guidelines’ performance in terms of its closeness to optimality with respect
to health state at the time of diagnosis. We observed that the ATP III guidelines were performing relatively better for
patients in health states with higher risk of a major cardiovascular event but non-extreme TC. The ATP III guidelines’
performance was also positively correlated to the proportion of diabetes population in each health state; that is, the
higher the number of diabetes patients in a health state is the closer the ATP III guidelines perform to optimality.
Conclusions:
Our analyses demonstrate that the guidelines show
substantial variation in penalizing a life year on
treatment but are close to being optimal under the
disutility they perceive for the treatment. Among
all guidelines we considered, the perception of
treatment disutility for females were no more than
that for males. Last but not least, our analyses also
imply the cost of treating diabetes can be reduced
significantly by shortening the course of treatment.
The approach that we utilize to quantify the
adverse effects of cholesterol treatment can also
be applied in broader contexts for other types of
chronic diseases and medications, and facilitate
better decision making.
Figure 4: Variation of the performance of ATP III guidelines according
to health states at the time of diagnosis (The red and blue cells
represent the worst and the best health states respectively)