Developing a stochastic simulation model for the generation of residential wa...
o14 WIAM - Addressing the challenges that lie ahead v0
1. WATER INFRASTRUCTURE ASSET MANAGEMENT – ADDRESSING THE
CHALLENGES THAT LIE AHEAD
Joey Loke
1
, Julian Briggs
2
, Francois Joubert
3
1. Aurecon Group, Melbourne, VIC, Australia
2. Aurecon Group, Sydney, NSW, Australia
3. Aurecon Group, Cape Town, WC, South Africa
ABSTRACT
Water authorities across Australia are being faced
with a step change within the industry. Major capital
investments over the last 10 years, while crucial in
providing long term water security, have led to the
need for higher operating expenditure to maintain
efficient operation of assets. Coupled with the
financial constraints being felt across all industry
sectors in the country, the challenge for water
authorities over the coming years will be to make
judicious decisions on capital investments while
focussing on optimising the efficiency and longevity
of existing assets. This paper presents a discussion
on the challenges and priorities for asset
management practitioners in the Australian water
industry, as well as a framework for attaining best
practice in Asset Management.
INTRODUCTION
Australia and the majority of developed nations
have experienced a period of substantial economic
growth over the last 20 years. Statistics obtained
from the Organisation for Economic Co-Operation
and Development (OECD) show that Australia’s
growth domestic product (GDP) per capita
increased from US$ 20,105 to US$ 44,407 between
1993 and 2012. Over this time, the estimated
national resident population increased from 17.7
million to 22.9 million. Forecasts by the Australian
Bureau of Statistics (ABS) indicate that Australia’s
population is expected to continue growing with
estimates of between 37 and 48 million by 2061.
With sustained economic prosperity and increasing
population comes the need to provide efficient and
sustainable services that can account for both the
current and future needs of a “thirsty” population.
To that end, the various state governments have
invested significant capital to provide long term
water security for its customers, while meeting the
increasing demands of tighter environmental and
social controls. Examples include the Victorian and
Adelaide Desalination Plants, Eastern Treatment
Plant Tertiary Treatment and the Western Corridor
Recycled Water Plant. There are indications which
now show that the cycle of capital spending has
returned to a moderate level, albeit for the short to
medium term, and the large procurement of major
infrastructure investment experienced between
2008 and 2010 is unlikely to be seen for some time.
The various long term strategic plans published by
Australian water authorities indicate a stepped
reduction in capital expenditure (CAPEX), being
replaced by a steady rise in operating expenditure
(OPEX) (National Water Commission, 2013).
The Australian water industry is experiencing a
rapid transition from a “build” phase to an “operate,
optimise and maintain” phase. While this may
present a bleak scenario for certain practitioners
and water industry service providers, there are
nonetheless opportunities for those who are willing
to contribute to the continued evolution (not
revolution) of the water industry. This transition will
place a significant focus on the asset management
capabilities of water authorities.
NATIONAL PERFORMANCE REPORT: A REVIEW
In order for asset management practitioners to
create a meaningful contribution to the continuous
improvement of the water industry, one must first
understand and appreciate the challenges that all
stakeholders within the sector have or are being
faced with. This section provides a review of the
financial performance of Australian urban water
utilities for 2011/12 based on the reporting
outcomes of the National Water Commission, and
subsequently sets the scene for further reflection on
how to prioritise asset management activities within
organisations. (Note: At the time of publication of
this paper, the national performance report for
2012/13 had not been released).
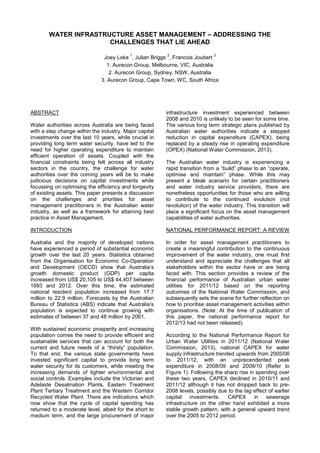
According to the National Performance Report for
Urban Water Utilities in 2011/12 (National Water
Commission, 2013), national CAPEX for water
supply infrastructure trended upwards from 2005/06
to 2011/12, with an unprecendented peak
expenditure in 2008/09 and 2009/10 (Refer to
Figure 1). Following the sharp rise in spending over
these two years, CAPEX declined in 2010/11 and
2011/12 although it has not dropped back to pre-
2008 levels, possibly due to the lag effect of earlier
capital investments. CAPEX in sewerage
infrastructure on the other hand exhibited a more
stable growth pattern, with a general upward trend
over the 2005 to 2012 period.
2. Figure 1: National water and sewerage CAPEX
(Source: National Water Commission, 2013)
With the bulk of new water supply infrastructure
being commissioned between 2008 and 2012, it is
not anticipated that there will be similar patterns of
CAPEX over the coming years.
The average OPEX for urban water utilities
between 2005/06 and 2011/12 are shown in Figure
2. From 2005/06 to 2011/12, the weighted average
OPEX for water supply and sewerage infrastructure
increased by 38% (6.4% per year) and 36% (6%
per year) respectively. The steady increase in the
OPEX of urban water utilities has been attributed to
a number of drivers, chief among them being:
• Rising energy and chemical prices
• Additional energy and materials requirements
for desalination and water recycling
• Increased engineering and water industry labour
costs
• More stringent environmental standards
• Personnel safety and operability
Figure 2: National weighted average OPEX for
water and sewerage (Source: National Water
Commission, 2013)
The commissioning of large water and wastewater
infrastructure projects in the last decade means that
ongoing maintenance of complex assets will be
crucial in optimising the performance of these and
previously existing facilities. This will invariably lead
to ongoing and increasing operating expenditure,
with the cost burdens ultimately being passed on to
customers. The challenge, therefore, for stewards
of these assets, will be to provide efficient and
effective service delivery while being cognisant of
affordability concerns for customers. Moreover,
asset managers must be aware of the broader
socio-economic and environmental challenges
which will befall the future of the Australian water
industry, as such macro factors may trigger the next
wave of capital investments.
THE NEED FOR CHANGE
As our industry faces up to a new era of urban
water management, there is a need to take a
retrospective view of the challenges seen over the
last few decades, in order to contextualise the need
for sustainable reforms for the next generation.
While there may be numerous factors driving the
need for reform, four key areas are explored in
further detail, namely:
• Population growth
• Climate variability
• Ageing assets
• Affordability
Population growth
The Australian Bureau of Statistics (2013)
estimates that Australia’s resident population will
increase from 22.7 million people at 30 June 2012
to between 36.8 and 48.3 million people by 2061.
This represents a two-fold increase in population
over a 50 year horizon. The ABS further reports
that in the 20 years to 30 June 2012, Australia’s
population increased by 1.3% per year on average,
with just over half of this growth resulting from net
overseas migration. In the two years leading to
2012, the rate of population growth increased to
1.6% per year, with indications of more rapid
increases over the next decade. By 2061, the
following population figures are projected:
• New South Wales – 11.5 million people
(increase of 57% from 2012 levels)
• Victoria – 10.3 million people (+83%)
• Queensland – 9.3 million (+102%)
• Western Australia – 6.4 million people (+167%)
• South Australia – 2.3 million people (+39%)
• Northern Territory – 0.45 million people (+93%)
The majority of the population will reside in the
capital cities, giving rise to highly dense, urbanised
areas. This projected population growth in the next
few decades will create strong demand for reliable
yet cost-effective water supply and sewerage
infrastructure, especially in urban areas. As an
indication of the pressures being placed by
population growth in urban areas, Melbourne Water
estimates that three new 100 GL/year seawater
desalination plants would be required by 2060, if
“business as usual” practices are maintained.
Climate variability
The drought conditions experienced in south-
eastern Australia between 1997 and 2009 was
shown to be the driest 13 year period in the last 110
years of reliable climate records (CSIRO, 2010).
During this period, Victoria recorded below average
rainfalls which triggered a range of water demand
management measures (See Figure 3 for
Melbourne’s annual rainfall between 1950 and
2013). As compared to previous drought events,
3. the last one extending from 1936 to 1945, the
recent dry spell was unique in that it was only
confined to south-eastern Australia rather than
extending over most of the continent, with average
temperatures steadily rising over that period.
Modelling conducted by CSIRO (2010) further
indicated that the southern Murray Darling Basin
region experienced a 13% reduction in rainfall,
which led to an extreme decline in modelled annual
streamflow of 44% relative to the long term
average.
Figure 3: Melbourne’s annual rainfall, 1950 – 2013
The Water Research Foundation completed a
research in 2014 to identify and characterise water
quality impacts of extreme weather-related events
(Stanford et al, 2014). Climate change predictions
carried out as part of the research indicated
potential long term changes in the hydrologic cycle,
resulting in increasing frequency and intensity of
events. Such events will create challenges for water
utilities due to the need to adapt their operating and
maintenance practices to suit potentially variable
source water qualities. It further notes that due to
the uncertainty around the occurences of extreme
weather events, water authorities without
appropriate contingency plans and future
infrastructure planning will be less able to adapt to
and quickly recover from weather-related impacts.
Australia’s urban water supply is largely reliant on
rain-fed water catchments and is therefore greatly
climate-dependent and influenced by seasonal
conditions. The concerns around climate variability
have therefore led to the implementation of
alternative water supply sources such as seawater
desalination, stormwater harvesting and recycled
water. Although this has been the trend in recent
years, it is expected that the majority of water
supplies in urban areas will still be drawn from
surface water catchments in the longer term.
Climate variability therefore creates an element of
uncertainty for water authorities as it can affect
water availability and revenues (if demand
management measures are triggered).
Ageing assets
Until recently, expenditure on water infrastructure to
service urban populations has been relatively small
compared to other essential services
(PricewaterhouseCoopers, 2010). This view is
supported by Engineers Australia, which notes that
until 2002/03, annual growth in water and sewerage
assets did not keep pace with population growth
(Engineers Australia, 2013). Figure 4 highlights the
state of play regarding investments in Australia’s
economic infrastructure. Two key observations are
made:
• Work completed on water and sewerage
infrastructure has historically amounted to less
than half the work done on electricity assets
• Investments in water storage and supply
infrastructure spiked in 2006 and 2011 as a
result of drought events
Figure 4: Work done nationally on economic
infrastructure relating to utilities (Source: Engineers
Australia, 2013)
The Australian water industry prides itself in having
a very reliable and efficient water-related
infrastructure. However, the legacy of under-
investment in the industry has given rise to a
scenario where existing assets are being pushed
harder and longer to meet increasing service level
demands. As highlighted in Engineers Australia’s
Infrastructure Report Card 2010, water-related
infrastructure was given an overall rank of C+
nationally, meaning that the infrastructure is
generally in adequate condition, however major
changes are required to enable the infrastructure to
be fit for its current and anticipated future purposes
(Engineers Australia, 2010).
Key indicators of asset condition, including water
main breaks and ‘real’ losses (due to leakages and
overflows from potable water mains, service
reservoirs and service connections), were compiled
in the National Water Commission’s National
Performance Report for 2011/12. The report
provides some encouraging results on the general
health of water infrastructure across Australia, with
water main breaks (measured as the number of
breaks per 100 km of water main) decreasing by
16% nationally between 2006/07 and 2011/12.
4. Similarly, ‘real’ losses (measured as L/service
connection/day) decreased by 10% nationally over
the six year period.
In spite of these observations, it is important to note
that existing water and wastewater infrastructure
will be placed under increasing stress in the future.
As infrastructure ages, the number of asset failures
will increase, with varying consequences. While
most water authorities have well-planned
preventative maintenance systems, it is important
to note that the rate of asset failure could increase
markedly over the next decade as a combination of
events, such as population rise and climate
changes, come into play. Therefore, attention must
be placed on developing a more unified approach
to the management of water-related assets across
the industry.
Affordability
The typical residential bill between 2006/07 and
2011/12, based on average residential water
supplied, is shown in Figure 5. Over this six year
period, the national median household annual bill
increased from $971 to $1068, equivalent to a 10%
rise. Whilst this increase might seem modest, it
reflects a trend that is likely to remain in place for
some time. In particular, given the large capital
investments sanctioned between 2008 and 2010,
the lag effect of sunk costs will become more
apparent in future water pricing as costs are
recovered through customer bills. Likewise, OPEX
is usually recovered directly from customers
through prices in the year that the expense is
incurred, meaning that movements in water utilities’
operating expenses will lead to an immediate
impact on water pricing.
Figure 5: Typical Australian residential bill (Source:
National Water Commission, 2013)
With regard to water pricing, reference is made to
the National Water Initiative’s blueprint for water
reform, via the National Water Inititative pricing
principles (Steering Group on Water Charges,
2010). Under this blue print, four sets of principles
are established for:
• Recovering capital expenditure
• Setting urban water tariffs
• Recovering the costs of water planning and
management
• Recycled water and stormwater use
These principles have been agreed by Australian
state governments as the basis for setting water
prices for their respective jurisdictions. For
example, in its final decision on the price
determination for the greater Melbourne
metropolitan water businesses under Water Plan 3,
the Essential Services Commission of Victoria has
approved a price increase of between 12 and 25%
for the four urban water retailiers from 2013/14 to
2017/18 (Essential Services Commission, 2013).
This reflects a marked rise in water prices as
compared with the national median of 10% over the
six year period from 2006/07 to 2011/12.
Affordability remains a key consideration for all
stakeholders. Water pricing is arguably the most
important barometer for measuring customer
satisfaction with regard to the performance of water
authorities. The significant investments made over
the last five years have left a legacy of reduced
affordability of this essential service. Hence,
judicious decisions are required by all parties
involved to ensure that the next wave of
investments are prudent, efficient and in direct
response to the growing needs of highly urbanised
areas. Of equal priority is the need to efficiently
manage existing assets to ensure that maximum
value is passed on to customers while maintaining
acceptable service levels.
KEY FOCUS AREAS
In response to the challenges facing the water
industry, organisations have begun targeting
specific areas in their businesses with the aim of
improving its asset management practices. A
number of key focus areas have been identified
within the Australian water industry to facilitate a
seamless transition from the “build” phase to
“maintain” phase, while at the same time
maintaining its commitments to safety, customers
and the environment.
The International Standards Organisation’s (ISO)
definition of an asset is “something that has
potential or actual value to an organisation”. The
term value can be interpreted in different ways
depending on the stakeholder being questioned.
From a water business’ perspective, value can be
defined as maximising profits or growing capital,
while for a customer, it may mean receiving good
service levels at the lowest possible cost.
Therefore, the goal of asset management is to use
the assets to maximise value for businesses and
customers alike. In recognising the micro and
macro challenges facing the Australian water
industry, a key objective of water practitioners will
be to manage existing assets in such a way that
maximum value and reliability is derived for all
involved parties. Concurrently, sound investment
strategies and strategic plans must be put in place
today to account for the needs of tomorrow’s
generation. In other words, intergenerational equity
5. must remain a key focus of asset management
practitioners from economic, environmental and
sociological contexts.
Therefore, the key focus areas for water authorities
in implementing better asset management systems
will be (adapted from The Institute of Asset
Management (IAM), 2012):
• Understanding the risk profile (criticality,
likelihood and consequence of failures) of
existing asset portfolios, and how they will
change over time
• Justifying asset expenditures to stakeholders
and prove that service delivery levels can be
sustained
• Implementing sound decision making processes
and tools which enable strategic decisions on
asset investments to be made, taking into
account short and long term objectives
• Enabling proactive, rather than reactive,
measures to managing existing assets
• Ensuring the availability of data (quantity and
quality) to support asset investment decision-
making
• Empowering each organisation’s workforce on
asset management best practices, and ensuring
that the right competencies and capabilities exist
The International Water Association (IWA) and
Water Services Association of Australia (WSAA)
conduct ongoing benchmarking of asset
management practices in the water sector. The
recently completed Asset Management
Performance Improvement Project in 2012 involved
37 water sector utilities from Australia, Canada,
New Zealand, Philippines and the United States of
America (IWA-WSAA, 2012). The results of the
benchmarking study indicated that the least
advanced functions in the asset management
lifecycle were Asset Maintenance and Asset
Replacement & Rehabilitation, which tend to reside
at the end of the lifecycle. Particular attention was
placed on the need for better long term strategic
and analytical processes, which rely on good
quality data to support investment decisions (asset
refurbishment or renewal, for example) and
unplanned maintenance interventions.
The need for better decision-making tools and
processes underpins the business priorities of
many water service providers. Better lifecycle
modelling approaches are often sounded out by
organisations as being a top pursuit. Another
equally important initiative is the implementation of
an asset management system (or framework for
asset management) to establish a clear mandate
for the setting of strategies, policies and actions
within organisations.
During the Leading Edge Strategic Asset
Management (LESAM) conference, jointly
organised by the IWA and the Australian Water
Association (AWA) in September 2013, a key focus
over the three day conference was to identify
priorities within the respective organisations to
maximise value to all stakeholders. Three important
themes were identified as priorities, namely:
• Realignment of business focus towards
customer needs (i.e. shift from engineering
focus to customer/value-driven focus)
• Providing engineering solutions, not just
services, and enhancing collaboration amongst
asset management practitioners (i.e. fostering a
marketplace where knowledge can be readily
shared within the community of practitioners)
• Responding to the challenge of transitioning
from a ‘build’ phase to an ‘optimise’ phase (i.e.
driving value for stakeholders)
In its discussion paper on Urban Water Futures, the
National Water Commission (2013) identifies
several thematic areas for consideration, aimed at
encouraging discussion around the challenges and
solutions for a burgeoning urban water
environment. Two such themes centre on the key
focus areas identified above, namely to provide
efficient and effective service delivery as well as to
promote a customer focused sector with an
engaged community. The discussion paper points
out that water service providers largely consist of
government-owned monopoly businesses that face
little direct competition due to jurisdictional
restrictions. As minimum service levels and water
pricing are determined by external regulators, the
lack of competition may not always provide the
motivation to integrate customer needs into
business decisions. The challenge therefore for
water service providers from an asset management
perspective will be to seek wider community
engagement to understand the drivers for customer
satisfaction, whether it means improving service
quality, minimising cost, or seeking consultation
about future investments in infrastructure upgrades.
The recent capital investments in water
infrastructure that are independent of climatic
conditions have provided for greater security of long
term water supply in urban areas. However, there is
a cost burden associated with new infrastructure,
due to the need for additional maintenance effort
and optimisation of existing assets. The need to
integrate sound asset management practices
across all business functions underpins the
importance of implementing a framework that
adequately describes the roles, objectives and
desired outcomes for each organisation.
6. DEVELOPMENT OF AN ASSET MANAGEMENT
FRAMEWORK
Developments across the industry in recent times
have led to the definition of a unified framework for
whole-of-life asset and infrastructure management
(WOLAIM), an example of which is shown in Figure
6. Such a framework provides a simple yet
complete view of whole-of-life asset management,
as it aims to integrate all stages of an asset’s
lifecycle (planning, implementation, asset care and
retirement) with the three layers of an
organisation’s business functions (strategic, tactical
and operational).
Figure 6: Example of WOLAIM framework
Coupled with the recent introduction of the ISO
55000 series on Asset Management, such
frameworks aim to align an organisation’s
capabilities and competencies with demands in the
industry. The aims of such a framework are to:
• Provide a roadmap for asset managers towards
attainment of ISO 55000 compliance
• Expand the current focus on infrastructure
design by considering solutions that yield
optimal life cycle costing from project
conceptualisation through to long term asset
maintenance
• Implement a top-down approach to delivering
sound and sustainable capital investments to
benefit customers and stakeholders
A key initiative identified from the IWA-WSAA Asset
Management Performance Improvement Project in
2012 was the implementation of a framework for
asset management through industry-wide
collaboration. The aims of such an initiative are to:
• Identify a model that can be applied across all
layers of an organisation,
• Provide a unified approach in establishing clear
policy and strategic direction, asset
management objectives, operational controls
and continual improvement activities, and
• Seek buy-in from all stakeholders involved,
aligning organisational cultures towards
common objectives
The Institute of Asset Management (2011) presents
a conceptual model for asset management (Figure
7) based on six subject groups – Asset
management strategy and planning; Asset
management decision-making; Lifecycle delivery
activities; Asset knowledge enablers; Organisation
and people enablers and Risk and review.
Figure 7: Asset management conceptual model
(Source: The Institute of Asset Management, 2012)
The IAM, in collaboration with international partners
within the Global Forum for Maintenance and Asset
Management (GFMAM), has further identified a
total of 39 subjects that are linked to the six subject
groups, which form the asset management
landscape. These subjects are listed in Table 1.
Table 1: Asset management subjects (Source: The
Institute of Asset Management, 2012)
Subject
group
Subject
Asset
management
strategy and
planning
• Asset management policy
• Asset management strategy
• Demand analysis
• Strategic planning
• Asset management plans
Asset
management
decision-
making
• Capital investment decision-
making
• Operations and maintenance
decision-making
• Life cycle cost and value
optimisation
• Resourcing strategy and
optimisation
• Shutdowns & outage strategy
and optimisation
• Aging assets strategy
Lifecycle
delivery
activities
• Technical standards &
legislation
• Asset creation & acquisition
• Systems engineering
• Configuration management
• Maintenance delivery
• Reliability engineering and root
cause analysis
• Asset operations
7. Subject
group
Subject
• Resource management
• Shutdown/outage
management
• Incident response
• Asset rationalisation &
disposal
Asset
knowledge
enablers
• Asset information strategy
• Asset knowledge standards
• Asset information systems
• Asset data & knowledge
Organisation
and people
enablers
• Contract and supplier
management
• Asset management leadership
• Organisational structure and
culture
• Competence and behaviour
Risk and
review
• Criticality, risk assessment and
management
• Contingency planning and
resilience analysis
• Sustainable development
• Weather and climate change
• Assets and systems
performance and health
monitoring
• Assets and systems change
management
• Management review, audit and
assurance
• Accounting practices
• Stakeholder relations
This anatomy of asset management, as identified
by the IAM, describes the complete scope of
subject matters relating to an asset, whether it is a
discrete physical component or a system of
interlinked components. It is important to recognise
that while each subject is described individually,
there are clear inter-relationships between all
elements, and the decisions made based on one
activity will invariably impact on others.
For water businesses (bulk suppliers or retailers),
the development of such a framework for WOLAIM
must integrate seamlessly into corporate strategies
and be applied across all layers of business
functions. It is insufficient for organisations to
merely have well-developed processes and
systems for front end functions, such as asset
management strategy and planning, while ignoring
the importance of back-end functions such as
condition assessment, asset rehabilitation and risk
management. Likewise, service providers within the
industry must have adequate exposure to the
complete breadth of all asset management subject
groups, and be able to interact with industry
experts/specialists in any of the fields. There must
be recognition that any strategic planning decision
made today on infrastructure investments will
create a “ripple effect” across the asset’s lifecycle;
thus decisions on operational requirements such as
maintenance delivery, performance optimisation
and ultimately asset renewal, must be equally
factored in. A unified WOLAIM framework therefore
aids in providing a conceptual model of how front-
end and back-end functions can be interlinked and
considered holistically.
The frameworks for WOLAIM shown in Figures 6
and 7 provide an example of how sound asset
management practices can be applied across the
lifecycle of an asset and over the business
functions of organisations. A framework itself does
not immediately solve all the future challenges of
population rise, climate variability, ageing assets or
affordability. However, what it does create is a
model that aligns organisational objectives and
culture, while recognising that asset management is
about the integration of all activities across an
asset’s lifecycle, and not just individual activities in
isolation.
A key strength of a well-developed and
implemented asset management system is the
ability for organisations to carry out gap analyses of
their existing practices to identify areas for
improvement. For instance, Melbourne Water
carried out a gap analysis of its asset management
system in 2009 against the requirements of the
British Standards Institution’s (BSI) PAS 55:2008.
The results of the audit showed that Melbourne
Water was clearly adopting good asset
management practices with most areas compliant
with PAS 55. However, in recognising that there
was a need to improve its risk management
processes, particularly around asset replacement
and rehabilitation, asset managers at the Eastern
Treatment Plant, in partnership with Aurecon
Group, developed a Corrosion Management
Manual applicable to all buried metallic assets at
the site (i.e. pipelines, steel tanks, earthing systems
and steel sheet piling). The manual is effectively a
decision-making framework which provides
guidance on suitable corrosion management
strategies for new and existing assets, based on a
step-wise decision flow chart taking into account
aspects such as the asset’s criticality and condition.
The need for a unified approach to monitoring and
mitigating corrosion of buried metallic assets was
identified as a top priority and represented a shift
from reactive asset management practices to one
that is well considered and preventative. Such
initiatives highlight the maturity of a water
authority’s asset management system, exemplified
by the ability to identify improvement areas within
the business.
8. CONCLUSION
As water businesses rise to the challenge of
continuously improving their operating systems,
business partners within the industry must
recognise the importance of adopting a unified
approach to sustainable water asset and
infrastructure management. The three pillars of
sustainability – People, Profit and Planet – have
never held greater significance than in the climate
which the water industry is presently operating in.
Responsible economic and environmental
management underpins every water authority’s
fundamental business imperatives.
The key focus areas for asset management
practitioners in the water industry will include:
• Responding to the transition from a ‘build’ phase
to an ‘operate-optimise-maintain’ phase
• Addressing increasing operating expenditure
(particularly energy costs)
• Climate variability and adapting operating
practices to changes in source water qualities
and flows
• Maintaining value for all stakeholders through
efficient service delivery
• Increasing industry collaboration around the
development of more unified asset management
systems
Specific strategies must therefore be implemented
to target continuous improvements in asset
management practices. Particular emphasis is
placed on the development of a unified whole-of-life
asset and infrastructure management (WOLAIM)
framework as it serves to provide alignment
between an organisation’s goals and its asset
management activities.
ACKNOWLEDGMENT
The authors wish to acknowledge the work done by
the Institute of Asset Management and its
international partners within the Global Forum for
Maintenance and Asset Management (GFMAM)
partner in describing, with sufficient detail, the
anatomy of asset management applicable to all
practitioners in the industry.
REFERENCES
Australian Bureau of Statistics. 2013. 3222.0 -
Population Projections, Australia – 2012 (Base)
to 2101, viewed 20 December 2013,
<http://www.abs.gov.au/AUSSTATS/abs@.nsf/
DetailsPage/3222.02012%20(base)%20to%20
2101?OpenDocument>
Engineers Australia. 2010. Infrastructure Report
Card 2010. Viewed 24 January 2013. <
https://www.engineersaustralia.org.au/infrastruc
ture-report-card>
Engineers Australia. 2013. Analysing Australia’s
Infrastructure Trends 2012: What Has
Happened Since the 2010 Infrastructure Report
Card?. Viewed 24 January 2013.
<http://www.engineersaustralia.org.au/sites/def
ault/files/shado/Representation/Research_and_
Reports/analysing_australias_infrastructure_tre
nds_2013_1.pdf>
Essential Services Commission. 2013. Price
Review 2013: Greater Metropolitan Water
Businesses – Final Decision. Viewed 10 July
2013, <http://www.esc.vic.gov.au/Water/Water-
Price-Review-2013-18>
International Water Association (IWA) & Water
Services Association of Australia (WSAA).
2012. 2012 Asset Management Performance
Improvement Project – Project Summary
National Water Commission. 2013. National
performance report 2011-12: urban water
utilities. Canberra, ACT, Australia
National Water Commission. 2013. Urban Water
Futures – Discussion Paper. Viewed 13
January 2014, < http://www.nwc.gov.au/our-
work/assessments/2014-ta/issues-
paper#background>
PricewaterhouseCoopers. 2010. Infrastructure
Australia – Review of Urban Water Security
Strategies
Stanford, B.D., Wright, B., Routt, J.C., Debroux,
J.F., and Khan, S.J. 2014. Water Quality
Impacts on Extreme Weather-Related Events
[Project #4324], Water Research Foundation,
viewed 23 January 2014,
<http://www.waterrf.org/Pages/Projects.aspx?P
ID=4324>
Steering Group on Water Charges. 2010. National
Water Initiative pricing principles. Viewed 13
January 2014,
<http://www.environment.gov.au/resource/natio
nal-water-initiative-pricing-principles>
The Institute of Asset Management. 2012. Asset
Management – an anatomy, Issue 1.1. Viewed
20 December 2012. < http://theiam.org/what-is-
asset-management/anatomy-asset-
management