
Recommended
Recommended
More Related Content
Similar to Chemical Risk Assessment Traditional vs PublicHealth Perspe
Similar to Chemical Risk Assessment Traditional vs PublicHealth Perspe (20)
More from JinElias52
More from JinElias52 (20)
Recently uploaded
Recently uploaded (20)
Chemical Risk Assessment Traditional vs PublicHealth Perspe
- 1. Chemical Risk Assessment: Traditional vs Public Health Perspectives Preventing adverse health ef- fects of environmental chemical exposure is fundamental to pro- tecting individual and public he- alth. When done efficiently and properly, chemical risk assess- ment enables risk management actions that minimize the in- cidence and effects of environ- mentally induced diseases related to chemical exposure. However, traditional chemical risk assess- ment is faced with multiple chal- lenges with respect to predicting and preventing disease in human
- 2. populations, and epidemiological studies increasingly report obser- vations of adverse health effects at exposure levels predicted from animal studies to be safe for humans. This discordance reinforces concerns about the adequacy of contemporary risk assessment practices for pro- tecting public health. It is becoming clear that to protect public health more effec- tively, future risk assessments will need to use the full range of available data, draw on innovative methods to integrate diverse data streams, and consider health endpoints that also reflect the
- 3. range of subtle effects and mor- bidities observed in human pop- ulations. Considering these factors, there is a need to reframe chemical risk assessment to be more clearly aligned with the public health goal of minimizing environmental exposures asso- ciated with disease. (Am J Public Health. 2017;107:1032–1039. doi:10.2105/AJPH.2017.303771) Maureen R. Gwinn, PhD, Daniel A. Axelrad, MPP, Tina Bahadori, ScD, David Bussard, BA, Wayne E. Cascio, MD, Kacee Deener, MPH, David Dix, PhD, Russell S. Thomas, PhD, Robert J. Kavlock, PhD, and Thomas A. Burke, PhD, MPH See also Greenberg, p. 1020. For the past several decades,human health risk assessment has been a pillar of environmental health protection. In general,
- 4. the products of risk assessment have been numerical risk values derived from animal toxicology studies of observable effects at high doses of individual chem- icals. Although this approach has contributed to our understanding of overt health outcomes from chemical exposures, it does not always match our understanding from epidemiology studies of the consequences of real-world ex- posures in human populations, which are characterized by expo- sure to multiple pollutants, often chronically, at concentrations that can fluctuate over wide ranges; susceptible populations and life stages; potential interactions be- tween chemicals and nonchemical stressors and background disease states; and lifestyle factors that modify exposures (e.g., airtight houses).1 Theseandotherissuesare particularly important when de- termining risk of complex diseases, such as cardiovascular disease. Ten years ago, the National Research Council offered a new paradigm for evaluating the safety of chemicals on the basis of chemical characterization, testing using a toxicity pathway ap- proach, and modeling and ex- trapolating the dose–response
- 5. relationship from in vitro testing, all embedded in a risk context and considering population- based data and exposure.2 Efforts such as the Tox21 Consortium3,4 and ToxCast program5 have helped us better understand the biological interactions of large numbers of chemicals using high-throughput assay systems, and we are witnessing early adoption of new technologies and approaches for screening chemicals for integrated testing.6 Several other factors are also changing the way environmental health professionals think about chemical risks and how to most effectively protect public health, especiallyforcomplexdiseaseslike cardiovascular disease. It is esti- mated that intrinsic factors (e.g., those that result in mutations stemming from random errors in DNA replication) account for only 10% to 30% of many com- mon cancers.7 Similarly, only 30% to 40% of birth defects can be attributed to known causes such as genetics, fetal alcohol syndrome, maternal smoking, and folate in- sufficiency.8 Other studies have concluded that nongenetic envi-
- 6. ronmental factors and gene by environment interactions are the primary causes of chronic dis- eases.9 The ability to evaluate and quantifytheroleofenvironmental factors on public health is a clear opportunity, but it is limited by thelack ofreadilyavailablemodels for prominent clinical outcomes. CURRENT CHALLENGES Understanding public health risk from environmental chem- ical exposures is complicated by many factors, such as population variability and susceptibility, long latencies between critical exposures and disease manifesta- tions, and background environ- mental exposures. Issues of population variability and sus- ceptibility are poorly understood and difficult to characterize and incorporate into risk assessments. For example, a person’s unique microbiome may modulate his or her response to environmental exposures.10,11 Although studies are limited in this emerging area, knowledge about the ABOUT THE AUTHORS At the time of the writing of this article, all of the authors were
- 7. with the US Environmental Protection Agency, Washington, DC. Correspondence should be sent to Maureen R. Gwinn, PhD DABT ATS, Office of Research and Development, US Environmental Protection Agency, 1300 Pennsylvania Ave NW, Ronald Reagan Building, Room 41205, MC 8101R, Washington, DC 20460 (e-mail: gwinn. [email protected]). Reprints can be ordered at http://www.ajph.org by clicking the “Reprints” link. This article was accepted March 2, 2017. doi: 10.2105/AJPH.2017.303771 1032 Analytic Essay Peer Reviewed Gwinn et al. AJPH July 2017, Vol 107, No. 7 AJPH RISK ASSESSMENT mailto:[email protected] mailto:[email protected] http://www.ajph.org microbiome may inform inter- individual variability and un- explained susceptibility observed in populations. Scientists have begun to appreciate the role of the microbiome in the lack of reproducibility and in- terpretability of animal studies.12 Another example is the effects
- 8. of early life environmental exposures on health outcomes later in life. Advances in the field of epigenetics have revealed that developmental exposure to endocrine disrupting chemicals can alter epigenetic program- ming of gene regulation and thus may play a role in the risk of obesity later in life.13 Similar to microbiome research, studies in this area are limited, and a better understanding of the link between chemical exposure, epigenetic gene regulation, and health outcomes through epide- miological research can help us better address factors that are currently difficult to account for in traditional risk assessment. Finally, there are also methodo- logical challenges in determining attributable risks in populations with background environmental exposures, as these background exposures may change the populationhealthbaselinesoraffect the response of the target chemical. Other examples of important fac- tors to incorporate in risk assess- ments can be found in Table 1. OPPORTUNITIES FOR USING MULTIPLE DATA TYPES
- 9. Concurrent with these chal- lenges, science and technology are advancing rapidly and in ways that create opportunities for risk assessment. Public health disciplines help us understand how baseline health status can influence the effect of population-level chemical ex- posures. We also need to consider how environmental pollutants may contribute to overall disease burden for endpoints not tradi- tionally considered in chemical risk assessment (e.g., metabolic disorders, autism). New methods in epidemiological re- search help us evaluate complex interactions among multifacto- rial causes of disease ranging from macro (societal, neigh- borhood) to micro (molecular) factors, relevance of exposures during sensitive life stages, and a better understanding of in- terrelatedness of disease across the life span.14 Advances in high-throughput technologies and computational modeling (e.g., ToxCast, Tox21, and ExpoCast efforts) are providing data on hazard and
- 10. exposure potential for a large number of data-poor chemicals. The increased generation of data for both hazard and exposure from these advances can be used to better understand the bi- ological pathways that lead to adverse health effects in ways that were not possible in the past. But linking these observations to specific disease endpoints is challenging because the trans- lation of effects across levels of biological organization is not well understood. One approach with the potential to advance our understanding of how chemical exposures can affect health is the use of adverse outcome path- ways, which integrate various types of biological information to link molecular initiating events to downstream key events and ultimately unwanted health outcomes.15,16 TABLE 1—Examples of Current Risk Assessment Challenges and Opportunities Risk Assessment Challenge Description Impact on Risk Assessment Public Health Opportunity Molecular initiating events and subsequent key events in adverse outcome pathways
- 11. Earlybiologicalchangesor precursoreffects in response to chemical exposures may be identified by in vitro, animal, or epidemiological studies Useful for qualitative and quantitativ e understanding of ultimate health effect of early biological changes Improved public health protection without need for long-term toxicology or epidemiology studies Background exposures Population exposures to a myriad of environmental chemicals at low concentrations Exposures to background chemicals may affect response to target chemical exposures and may change population health baselines Increased public health protection if
- 12. baseline exposures are taken into account when determining prevention strategies Nonchemical stressors Physical and psychosocial stressors, including noise, temperature, socioeconomic status, social stress, and limited resources Impact on baseline susceptibility and potential effect modification Potential role in cumulative assessment, improved identification of vulnerable populations, potential target for public health interventions (e.g., stress management) Early life determinants of health Biological characteristics and exposures that can determine chronic and lifelong health outcomes Effect of exposures during early life may play a role in later disease states (e.g.,
- 13. endocrine disruptors, epigenetic changes) Potential for early life interventions for prevention and management of later disease Baseline health status Individual health status, with a focus on potential health susceptibilities Baseline health status may affect response to additional environmental chemical exposures Increased public health protection if baseline health status is taken into account Microbiome Microorganisms that reside within and on our bodies and interact with the environment Exposure modification, susceptibility and resilience to environmental pollutants, important as an early life determinant of
- 14. health Potential targets for prevention and intervention, management of allergic responses, and precision risk management AJPH RISK ASSESSMENT July 2017, Vol 107, No. 7 AJPH Gwinn et al. Peer Reviewed Analytic Essay 1033 To fully realize the potential of adverse outcome pathway– based approaches and to in- tegrate biological findings across disciplines, we must strengthen our ability to detect precursor events in human populations and to identify biologically rel- evant exposure metrics, ideally measurable in individuals. An- other advancement that has a great potential to advance our understanding of data-poor che- micals is the use of nontesting approaches (e.g., quantitative structure–activity relationship) that allow us to predict toxicity when adequate testing data are absent—especially when we
- 15. combine knowledge of chemical structural features and in vitro bioactivity determinations. Ad- vances in the development of chemical libraries, cheminformatics, and read-across predictions and in- tegration with molecular data and adverse outcome pathways have significantly improved their application and predictive capacity, which will allow more comprehensive assessment of the health effects of exposures.17,18 Effectively predicting population risk by integrati ng a variety of data streams (e.g., epidemiology, toxicology, high-throughput testing) and considering multiple sources and pathways of exposure can better inform environmental public health decisions. Advances in technology and computational capabilities have fostered new opportunities for generating and analyzing molecular, animal, and human data on effects and ex- posures, which can be integrated TABLE 2—Data Streams and Opportunities and Challenges for Informing Risk Assessment
- 16. Data Type Description Opportunity Challenge Nontesting data Nontesting approaches, such as quantitative structure – activity relationship models and read-across allow us to predict toxicity when adequate testing data are absent Advances in the field have significantly improved their application and predictive capacity Developing principles for acceptance, for characterizing and incorporating uncertainties into predictions, and for developing objective metrics of performance Molecular Biochemical and cell-based bioactivity data and “omics- based” data on thousands of chemicals Can help inform our understanding of the health outcomes of environmental exposures, using data that are potentially more human relevant
- 17. Lack of scientific consensus on inferring hazard from bioactivity in vitro assay and omics-based data and providing quantitative dose–response information on exposure metrics Animal Traditional animal testing provides a hazard based point of departure for risk assessments Targeted animal testing can be performed on the basis of the results of bioactivity data to focus on key health outcomes Potential uncertainties with using traditional animal testing to estimate human risk (e.g., extrapolating from animal to human or high to low doses and accounting for human population variability and life stage susceptibility) Human Epidemiological and other human data support holistic assessment of the effects of chemical exposures on public health Newer exposure science and statistical techniques
- 18. advance the understanding of human variability that can be obtained from epidemiology and individual sequencing; understanding effect modification by nonchemical stressors and baseline health status Often limited mechanistic and dose–response data, and exposure misclassification can bias results to the null; possibility of unmeasured confounders often undermines confidence in observed associations, and it may require multiple studies and many years to rule out chance, bias, and confounding as possible explanations for observed associations Exposure Exposure characterization that captured the variability in time, space, and within and across populations; better toxicokinetic data link external to internal dosimetry and relevant environmental exposure concentrations with biological significance
- 19. Targeted and nontargeted biomonitoring, application of sensors, and other new technologies are greatly advancing population exposure characterization; high-throughput exposure models allow exposure predictions on thousands of chemicals with associated uncertainty Estimating and incorporating the inter- and intraindividual variability in exposures into current designs of toxicity testing and risk assessments; extrapolating relevant target tissue and organ dose information from external exposures and in vitro assays; accounting for multiple exposures; sample collection, data management, and analysis; and covering or extrapolating to a broader chemical space Digital data The ongoing revolution in social media use and communication has provided a new source of data used in exposure science and environmental
- 20. epidemiology for local and timely information about disease and health dynamics A significant source of untapped data The collection and application of these data have significant ethical implications that need to be understood and managed, particularly taking into account personal identifiable information; methods to evaluate the quality of the data and build confidence in the applications are needed AJPH RISK ASSESSMENT 1034 Analytic Essay Peer Reviewed Gwinn et al. AJPH July 2017, Vol 107, No. 7 into chemical risk assessments. At the same time, probabilistic and high-throughput ap- proaches for risk assessment have been advancing. Table 2 high- lights various data types available and challenges in applying these data types to inform risk assessment. A PUBLIC HEALTH
- 21. PERSPECTIVE A public health perspective for chemical risk assessment would approach risk assessment from a new lens. It would address population health with a focus on the health and societal burden of disease; use and integrate all available types of data—including traditional toxicology, human epidemiological findings, and newer and emerging data streams and information, such as digital epidemiology,19 high- throughput and high-content data, and adverse outcome path- ways; and draw on public health approaches, such as attributable risk or relative risk. This new perspective may be especially important for some historically challenging aspects of risk assess- ment, such as understanding cumulative risks of exposures to multiple chemical and non- chemical stressors. Internationally, scientists have raised concerns about the large number of ubiq- uitous chemicals people are exposed to and called for re- thinking approaches to evalu- ating the health effects of chemicals.16 Figure 1 presents a conceptual model for a public
- 22. health perspective for risk assessment. Although approaching assess- ments from the perspective of health outcomes may be chal- lenging, it provides the oppor- tunity to evaluate exposures and effects across the life span that are relevant to population health. Advances in science and tech- nology, such as adverse outcome pathway development, the broader availability of chemical and biological data, and the applications of statistical and bioinformatics tools, bring this previously aspirational approach well within reach.20 EXAMPLE: CARDIOVASCULAR DISEASE A public health approach may inform the challenge of cardiovascular disease. Cardio- vascular disease is the number 1 cause of mortality worldwide and is a major US public health burden.21,22 Annual costs of cardiovascular disease in the United States were estimated to be $317 billion in 2011 and 2012, considering direct medical costs
- 23. and lost productivity because of premature mortality.22 This es- timate is likely to substantially underestimate the social cost of cardiovascular disease because of limitations in the es- timation of indirect costs associ- ated with morbidity and premature mortality.23 Although much is known about the biochemical and be- havioral risk factors associated with cardiovascular disease, par- ticularly compared with other diseases and health conditions, the traditional risk factors fail to account for 10% to 25% of its prevalence.24 Environmental factors, including air pollution25 and chemical exposures26 are thought to contribute to the unexplained fraction. Although mortality stemming from car- diovascular disease has decreased over the past few decades in the developed world as a result of reductions in behavioral risk factors, the rising prevalence of obesity and diabetes might ac- count for the deceleration in the rate of improvement in annual cardiovascular mortality in the United States over the past few years.27
- 24. There is an urgent need to better understand the biological pathways through which envi- ronmental exposures to chemical and nonchemical stressors act to stimulate and accelerate athero- sclerosis and promote adverse cardiovascular health effects. Applying the adverse outcome pathway framework,28 the initial molecular response to a chemical exposure will often be receptor Improved public health Starting Point • Adverse health outcome of concern Data Sources (along with those used in traditional assessment) • Clinical data on baseline population health status • Molecular epidemiology
- 25. • Exposure information in the population • Behavioral data Synthesis • Chemical/nonchemical stressors contributing to the adverse outcome • Prevention strategies Public Health Perspective Starting Point In context of a statutory authority • Chemical or class of concern • Route(s) of exposure Data Sources • Epidemiology studies • Laboratory animal studies • Mechanistic data Synthesis
- 26. • Multiple health outcomes of concern • Toxicity values for specific chemical/endpoint • Output/risk metric: absolute estimate of risk in population, or safety assessment (e.g., hazard index) Traditional Risk Assessment Note. This conceptual model illustrates how the starting point in a public health–focused risk assessment would differ from that of traditional risk assessment. In traditional risk assessment, the starting point is focused on specific chemicals or classes of chemicals of concern, with multiple data streams saying what the critical effects from that chemical are. A public health perspective would focus on the adverse health outcome of concern with multiple data streams, informing our understanding of hazard and exposure in the context of public health decisions related to that outcome and not necessarily focused on just 1 chemical or class of chemicals. FIGURE 1—Conceptual Model for a Public Health Perspective for Chemical Risk Assessment AJPH RISK ASSESSMENT
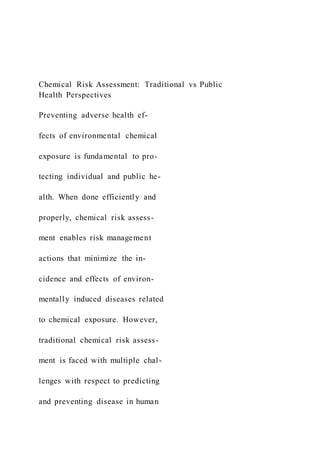
- 27. July 2017, Vol 107, No. 7 AJPH Gwinn et al. Peer Reviewed Analytic Essay 1035 activation and changes in meta- bolism and, ultimately, changes in tissue and organ function. Such changes can be modified by both intrinsic (e.g., gender, age, genetic, and epigenetic back- ground) and extrinsic factors (e.g., coexposures to other chemical and nonchemical stressors; Figure 2). Over time, these changes produce subclinical effects, such as changes in elec- trical and mechanical cardiac function, vascular function, and nonobstructive atherosclerotic vascular changes. With the per- sistence of metabolic changes that stimulate the progression of vascular disease, clinical cardio- vascular events such as heart at- tacks, strokes, heart failure, and abnormal heart rhythms follow. To date, the most compre- hensive application of this ap- proach has been in the study of population-level health effects of air pollution exposure.28 Epidemiological data at the
- 28. population level has provided support that air pollutant exposure (e.g., ambient particular matter and NO2) accelerates the development and progression of coronary atherosclerosis.25 Xenobiotic metals such as arse- nic, cadmium, lead, and mer- cury are also associated with atherosclerosis.29 Gene– environment interaction alters the risk of vascular disease30; for example, the residential proximity to highways (representing ex- posure to a mixture of traffic- related air pollutants) is associated with peripheral vascular disease, which is modified by the gene encoding bone morphogenic protein.7,31 Because of the complexity of the drivers of atherosclerosis, a medical model treating blood pressure and high cholesterol and advising dietary modification and exercise will be inadequate to fully address this disease. Like- wise, identifying the chemicals that increase risk on an individual basis will be inadequate to pre- vent vascular disease. Instead an integrated systems approach is
- 29. Atherosclerosis As TCDD BaP Phthalate PCB PM2.5 Cd PCBs TCDD InflammationPlaque Growth Chemical Exposures z Oxidative Stress Adipokine Dysregulation Dyslipidemia Insulin Resistance Hyperglycemia
- 31. Cd PM2.5 TCDD Phthalates PCBs As TCDD Cd PFOS BPA PM2.5 Age Gender Family History Diet Smoking Physical Inactivity Emotional State High BP
- 35. m e P a th w a y ( A O P ) Clinical Events (AO) Biochemical and Physiologic Responses (IKE) Cellular Response (IKE) Environmental Exposure Subclinical and
- 36. Clinical Responses (IKE) Molecular Initiating Event Public Health Burden Mortality – Morbidity – Disability – Frailty As PFOS PCBs PM2.5 Individual Health Burden Source. Action of specific chemicals and metals adapted from Kirkley and Sargis.26 Note. As = Arsenic; AO = adverse outcome; BaP = benzo[a]pyrene; BPA = bisphenol A; Cd = Cadmium; DEHP = di(2-ethylhexyl) phthlate; DES = diethylstilbestrol; HDL = high- density lipoprotein; IKE = intermediate key event; LDL = low - density lipoprotein; PCB = polychlorinated biphenyl; PFOS = perfluorooctane sulfonic acid; PM2.5 = particulate matter £ 2.5 mm; TCDD = tetrachlorodibenzo-p-dioxin.This figure illustrates the biological pathway leading from exposure to adverse cardiovascular outcomes for a variety of chemicals. On the left-hand side of the figure these pathways are linked to the adverse outcome pathway, and on the right- hand side of the figure we see the traditional risk factors for adverse cardiovascular outcomes. FIGURE 2—Adverse Outcome Pathway for Cardiovascular
- 37. Outcomes AJPH RISK ASSESSMENT 1036 Analytic Essay Peer Reviewed Gwinn et al. AJPH July 2017, Vol 107, No. 7 needed to fully account for all known risk factors and formulate the problem to define the most effective strategy to decrease in- dividual risk and societal burden. Accomplishing this will require clinical data that fully reflect a population under consideration as well as exposures to traditional risk factors, biomonitoring data documenting exposures to mul- tiple chemicals, and molecular responses from in vitro and in vivo studies indicative of the activation of biochemical pathways that accelerate atherosclerosis. Although this approach might not be practical currently, it is not unrealistic to think about future states where it could become standard practice. Our proposed innovative approach to chemical risk assessment is occurring contemporaneously during the formative stages of the National
- 38. Institutes of Health–sponsored Precision Medicine Initiative, which will drive integration of genomics, data sciences, and bioinformatics as the basis for improved individual health care, disease prevention, and public health. The Affordable Care Act has accelerated electronic medical record adoption in health care practices and hospital systems, potentially offering a valuable source of information for population-level health monitoring. Recent research has used big data to study the early stages of disease and better classify and predict disease progression and could be used to inform personalized medicine to optimize wellness in healthy populations.32–34 Moreover, the anticipated integration and development of technologies and analytical tools have the potential to improve public health and increase the spatial and temporal resolution of environmental health surveillance. The establishment of a long-term representative precision medicine cohort, if integrated with the proposed National Biomonitoring Net-
- 39. work,35 could have enormous benefit in helping us understand the relationship between chem- ical exposures and disease and in managing some of the most challenging clinical problems more effectively. Applying this framework would potentially expand our understanding of the origins of vascular disease and its progres- sion, helping define strategies for primary prevention to thwart the initiation of the process we ultimately call atherosclerosis. Thus, such a framework would provide new and ongoing insights into the associations between environmental expo- sures that contribute the greatest burden to public health. This approach would facilitate ac- counting for sensitive pop- ulations and could inform suggested individual health or behavioral measures in which there have been past exposures or in which current exposure cannot be reduced enough to protect those most at risk. CONCLUSIONS The proposed conceptual model is grounded in public
- 40. health principles and focused on identifying the greatest oppor- tunity to reduce environmental exposures to improve health outcomes. Along with traditional risk assessment, this perspective can better inform public health decision-making. Although there are clear benefits to operating within a public health– focused framework and moving away from individual chemicals and apical endpoints, there are also challenges. Informing Decision- Making Since the 1980s, the Envi- ronmental Protection Agency’s decision-making has been grounded on traditional risk as- sessments that are conducted within the constraints of the Environmental Protection Agency’s statutes and programs. Although program-targeted risk assessments will remain an im- portant component, the disease- based approach draws on information in a holistic fashion that cuts across organizational and legal boundaries, integrating traditional inputs and newer data streams. These assessments will provide decision-makers with
- 41. critical information to inform exposure-reduction efforts to affect the selected health out- comes and, ultimately, improve public health. Because those exposure-reduction efforts would take place within the existing statutory construct, an important implementation step would be to move from findings of disease-based risk assessments to assessments of specific risk management actions under the relevant statutory authorities. Priorities for Screening and Testing A health outcome–focused framework can inform priorities for screening and testing the toxicity of chemicals. Efforts to develop and synthesize ap- proaches for screening large numbers of chemicals using high-throughput toxicity testing and exposure prediction should continue to provide data for data-poor chemicals. For example, in the recently an- nounced Cancer Moonshot,36 high-throughput approaches could screen a large set of chemicals for potential carcino- genicity and identify a suite of
- 42. chemicals for additional animal toxicity testing. Examining noncancer end- points will also be challenging, which is why developing adverse outcome pathways and networks to contextualize and interpret nonapical hazard data in relation to population health is of in- creasing value. Epidemiology studies can be designed to inform and validate high-throughput testing approaches by identifying both chemical stressors and nonchemical stressors that mod- ify responses to chemical expo- sures; they can also be designed to test relationships between disease and early markers of exposure and biological response (e.g., epigenetic changes). The Impact of Cumulative Exposures Although cumulative risk assessment has been of high in- terest for the past few decades, putting cumulative assessment approaches into practice has been challenging. This framework provides a new construct for considering cumulative risk. By focusing on a health endpoint of
- 43. concern, one could consider the multiple exposures that may contribute to a health outcome. Past National Research Council recommendations have encour- aged assessors to evaluate the combined effects of exposures to all chemicals that affect a common adverse outcome, for example, male reproductive development.37 Challenges include gaining adequate un- derstanding of individual chemical effects to group chemicals by health outcome. Increased research into the biological pathways by which chemicals affect health status can help inform approaches for estimating the joint effect of chemicals without AJPH RISK ASSESSMENT July 2017, Vol 107, No. 7 AJPH Gwinn et al. Peer Reviewed Analytic Essay 1037 testing all permutations or combinations. One example of an alternative approach is health impact assess- ment, which uses a systems ap- proach to array data sources and
- 44. analytic methods and considers input from stakeholders to de- termine potential effects of a proposed action or decision on the health of a population and the distribution of those effects in the population.38 Using health impact assessment approaches for chemical risk assessments made through this framework can offer a method to organize various data streams that can influence our understanding of a health effect, inform potential multiple con- tributors to adverse health outcomes, and provide recom- mendations to decision-makers for monitoring and managing these outcomes. Consider Public Health Concepts This new approach takes a systematic view of collective factors that contribute to a health outcome or disease state, in- cluding those that are not reg- ulated by a single federal entity. Any single health outcome may be influenced by multiple factors beyond chemical exposures, such as nutrition, genetics, and social stressors. Because those factors are not regulated, it is important for environmental
- 45. regulatory agencies to un- derstand what fraction of the disease burden is influenced by the regulated environmental exposure. Public health approaches, such as attributable risk, can help inform this understanding. Challenges may include in- corporating these approaches, which are typically used in epi- demiology, to animal and ad- vanced toxicity testing data; ensuring adequate training with the approaches; and communi- cating risk in a way that ac- knowledges the influence of nonregulated factors. Public Health Implications Understanding the health effects of chemicals has real im- plications for public health. This proposed approach for chemical risk assessment starts at the health endpoint and incorporates mul- tiple data streams, including data developed using newer tech- nologies such as high-throughput screening. In parallel with more traditional risk assessment ap- proaches, this will lead to a better
- 46. understanding of mechanisms of single chemicals as well as cu- mulative exposures that lead to specific disease endpoints. This new lens will need to be applied to the complete risk as- sessment process—problem for- mulation, data considerations, and data synthesis through mul- tipathway methods, including cumulative assessment and health impact assessment—with an eye to the prevention of adverse ef- fects. This approach draws on the best available science to improve our understanding of the health effects of environmental chem- icals and informs decision- making to prevent, reduce, or mitigate exposure and ultimately improve public health. CONTRIBUTORS M. R. Gwinn led the compilation of text and revisions of the article. M. R. Gwinn and K. Deener led creation of Figure 1. M. R. Gwinn, K. Deener, and R. J. Kavlock led the creation of Table 1. D. A. Axelrad, T. Bahadori, D. Bussard, R. S. Thomas, and R. J. Kavlock led the drafting of text on challenges and op- portunities. T. Bahadori, R. S. Thomas, and R. J. Kavlock led the creation of Table 2. W. E. Cascio led the creation of Figure 2. W. E. Cascio and K. Deener
- 47. led the drafting of text on public health. R. J. Kavlock and T. A. Burke led the discussions and outlined the article. All authors contributed to discussions of the concepts behind this article and contrib- uted text to the various sections. ACKNOWLEDGMENTS The authors would like to acknowledge the assistance of Laura Romano in pre- paring the article. Note. The views expressed in this article are those of the authors and do not necessarily reflect the views or policies of the US Environmental Protection Agency. REFERENCES 1. Birnbaum LS, Burke TA, Jones JJ. Informing 21st-century risk assessments with 21st-century science. Environ Health Perspect. 2016;124(4):A60–A63. 2. National Research Council. Toxicity Testing in the 21st Century: A Vision and a Strategy. Washington, DC: National Academies Press; 2007. 3. Kavlock RJ, Austin CP, Tice RR. Toxicity testing in the 21st century: im- plications for human health risk assess- ment. Risk Anal. 2009;29(4):485–487; discussion 492–497. [Comment on Toxicity testing in the 21st century: im-
- 48. plications for human health risk assess- ment. Risk Anal. 2009] 4. Tice RR, Austin CP, Kavlock RJ, Bucher JR. Improving the human hazard characterization of chemicals: a Tox21 update. Environ Health Perspect. 2013; 121(7):756–765. 5. Kavlock R, Chandler K, Houck K, et al. Update on EPA’s ToxCast program: providing high throughput decision sup- port tools for chemical risk management. Chem Res Toxicol. 2012;25(7):1287–1302. 6. Browne P, Judson RS, Casey WM, Kleinstreuer NC, Thomas RS. Screening chemicals for estrogen receptor bioactivity using a computational model. Environ Sci Technol. 2015;49(14):8804–8814. 7. Wu S, Powers S, Zhu W, Hannun YA. Substantial contribution of extrinsic risk factors to cancer development. Nature. 2016;529(7584):43–47. 8. Weinhold B. Environmental factors in birth defects: what we need to know. Environ Health Perspect. 2009;117(10): A440–A447. 9. Rappaport SM, Barupal DK, Wishart D, Vineis P, Scalbert A. The blood exposome and its role in discovering causes of disease. Environ Health Perspect. 2014;122(8):769–774.
- 49. 10. Dietert RR, Silbergeld EK. Bio- markers for the 21st century: listening to the microbiome. Toxicol Sci. 2015;144(2): 208–216. 11. Patterson AD, Turnbaugh PJ. Mi- crobial determinants of biochemical in- dividuality and their impact on toxicology and pharmacology. Cell Metab. 2014; 20(5):761–768. 12. Servick K. Of mice and microbes. Science. 2016;353(6301):741–743. 13. Stel J, Legler J. The role of epigenetics in the latent effects of early life exposure to obesogenic endocrine disrupting chem- icals. Endocrinology. 2015;156(10): 3466–3472. 14. Buck Louis GM, Bloom MS, Gatto NM, Hogue CR, Westreich DJ, Zhang C. Epidemiology’s continuing contribution to public health: the power of “then and now.” Am J Epidemiol. 2015;181(8): e1–e8. 15. Ankley GT, Bennett RS, Erickson RJ, et al. Adverse outcome pathways: a con- ceptual framework to support ecotoxicol- ogy research and risk assessment. Environ Toxicol Chem. 2010;29(3):730–741. 16. Goodson WH III, Lowe L, Carpenter DO, et al. Assessing the carcinogenic
- 50. potential of low-dose exposures to chemical mixtures in the environment: the challenge ahead. Carcinogenesis. 2015; 36(suppl 1):S254–S296. 17. Mansouri K, Abdelaziz A, Rybacka A, et al. CERAPP: Collaborative Estrogen Receptor Activity Prediction Project. Environ Health Perspect. 2016;124(7): 1023–1033. 18. Judson R, Houck K, Martin M, et al. Analysis of the effects of cell stress and cytotoxicity on in vitro assay activity across a diverse chemical and assay space. Toxicol Sci. 2016;153(2):409. [Erratum in Analysis of the effects of cell stress and cytotoxicity on in vitro assay activity across a diverse chemical and assay space. Toxicol Sci. 2016] 19. Bakker KM, Martinez-Bakker ME, Helm B, Stevenson TJ, et al. Digital ep- idemiology reveals global childhood disease seasonality and the effects of im- munization. Proc Natl Acad Sci USA. 2016; 113(24):6689–6694. 20. National Academies of Sciences, En- gineering, and Medicine. Using 21st Century Science to Improve Risk-Based Evaluations. Washington, DC: National Academies Press; 2017. 21. Moran AE, Forouzanfar MH, Roth GA, et al. Temporal trends in ischemic
- 51. heart disease mortality in 21 world regions, 1980 to 2010: the Global Burden of Disease 2010 study. Circulation. 2014; 129(14):1483–1492. 22. Mozaffarian D, Benjamin EJ, Go AS, et al. Heart disease and stroke statistics— 2016 update: a report from the American Heart Association. Circulation. 2016; 133(4):e38–e360. 23. US Environmental Protection Agency. Guidelines for Preparing Economic Analyses. Washington, DC; 2010. 24. Kannel WB, Vasan RS. Adverse consequences of the 50% misconception. Am J Cardiol. 2009;103(3):426–427. 25. Kaufman JD, Adar SD, Barr RG, et al. Association between air pollution and AJPH RISK ASSESSMENT 1038 Analytic Essay Peer Reviewed Gwinn et al. AJPH July 2017, Vol 107, No. 7 coronary artery calcification within six metropolitan areas in the USA (the Multi-Ethnic Study of Atherosclerosis and Air Pollution): a longitudinal cohort study. Lancet. 2016;388(10045): 696–704.
- 52. 26. Kirkley AG, Sargis RM. Environ- mental endocrine disruption of energy metabolism and cardiovascular risk. Curr Diab Rep. 2014;14(6):494. 27. Sidney S, Quesenberry CP Jr, Jaffe MG, et al. Recent trends in cardiovas- cular mortality in the United States and public health goals. JAMA Cardiol. 2016; 1(5):594–599. 28. Cosselman KE, Navas-Acien A, Kaufman JD. Environmental factors in cardiovascular disease. Nat Rev Cardiol. 2015;12(11):627–642. 29. Solenkova NV, Newman JD, Berger JS, et al. Metal pollutants and cardiovas- cular disease: mechanisms and conse- quences of exposure. Am Heart J. 2014; 168(6):812–822. 30. Zanobetti A, Baccarelli A, Schwartz J. Gene-air pollution interaction and car- diovascular disease: a review. Prog Cardiovasc Dis. 2011;53(5):344–352. 31. Ward-Caviness CK, Neas LM, Blach C, et al. Genetic variants in the bone morphogenic protein gene family modify the association between residential ex- posure to traffic and peripheral arterial disease. PLoS One. 2016;11(4):e0152670. 32. Dinov ID, Heavner B, Tang M, et al. Predictive big data analytics: a study of
- 53. Parkinson’s disease using large, complex, heterogeneous, incongruent, multi- source and incomplete observations. PLoS One. 2016;11(8):e0157077. 33. Hood L, Lovejoy JC, Price ND. In- tegrating big data and actionable health coaching to optimize wellness. BMC Med. 2015;13:4. 34. Khoury MJ, Evans JP. A public health perspective on a national precision med- icine cohort: balancing long-term knowledge generation with early health benefit. JAMA. 2015;313(21): 2117–2118. 35. Association of Public Health Labora- tories. National Biomonitoring Plan. Silver Spring, MD; 2015. 36. Mitchell E. Moonshot toward a cure for cancer. J Natl Med Assoc. 2016;108(2): 104–105. 37. National Research Council. Phthalates and Cumulative Risk Assessment: The Tasks Ahead. Washington, DC: National Academies Press; 2008. 38. National Research Council. Improving Health in the United States: The Role of Health Impact Assessment. Washington, DC: National Academies Press; 2011. AJPH RISK ASSESSMENT
- 54. July 2017, Vol 107, No. 7 AJPH Gwinn et al. Peer Reviewed Analytic Essay 1039 Copyright of American Journal of Public Health is the property of American Public Health Association and its content may not be copied or emailed to multiple sites or posted to a listserv without the copyright holder's express written permission. However, users may print, download, or email articles for individual use. 514 ASBBS PROCEEDINGS OF THE 23RD ANNUAL CONFERENCE AN EXAMINATION OF THE INFLUENTIAL FACTORS OF PACKAGING, PRICE SENSITIVITYAND BRAND IMAGE ON FROZEN FOOD CONSUMER BUYING BEHAVIOR IN BANGKOK, THAILAND Thiendej, Peeraput Graduate School of Business, Assumption University of
- 55. Thailand [email protected] Chaipoopirutana, Sirion Graduate School of Business, Assumption University of Thailand [email protected] Abstract Packaging has been gradually taking on an important role as a way to serve consumers by providing information and delivering functions. The role of packaging is observed as a strategic tool to influence consumer buying behavior. The main purpose of this research was to identify the influences of the visual elements of packaging in terms of graphics and size/shape and the informational elements of packaging in terms of product information and technology, brand image, price sensitivity on consumer buying behavior of CP ready- to-eat frozen food in Bangkok, Thailand. This study exclusively made use of survey methods to collect the data from 399 respondents. Descriptive statistics were used in
- 56. describing parameters of the respondents and inferential statistics was used to test the hypotheses. The results of the Multiple Regression Model have shown that the independent variables, such as the visual elements of packaging in terms of graphics and size/shape and the informational elements of packaging in terms of product information and technology were significantly influenced on both brand image and consumer buying behavior. In addition, brand image was significantly influenced on consumer buying behavior. However, price sensitivity was not influenced on consumer buying behavior. While the result of Simple Regression Model showed that price sensitivity had a significant influence on brand image. Based on the results of the study, it is supposed to be beneficial to the ready-to-eat frozen food businesses in order to improve their packaging design in terms of graphics as well as their brand image. Packaging can make a product stand out, and can be a silent sale man on a shelf because it is growing in a competitive market and has become
- 57. an important tool for communication with consumers. Key words: - Consumer buying behavior, packaging, price sensitivity and brand image. Introduction Food packaging is likely to grow in competitive market conditions, as packages turn into a tool for communication and branding, and there are many factors affecting the consumer buying behavior process through food packaging, therefore the communication functions of the package, such as the graphics of the packaging, the size and shape of the packaging, the information on the mailto:[email protected] mailto:[email protected] 515 ASBBS PROCEEDINGS OF THE 23RD ANNUAL CONFERENCE package, and innovative packaging must inform and assist consumers in making their purchase decision carefully (Ahmed et al, 2014).
- 58. Consumers are becoming more and more demanding and packaging has been gradually taking on an important role as a way to serve consumers by providing information and delivering functions to communicate with consumers. It is no wonder that the important role of packaging is observed as a strategic tool to influence consumer buying behavior. Likewise, in Thailand, currently, the lifestyle of people is being rushed. There are time constraints and the need for speed in the activities of everyday life and they are more likely to need more convenience cookings (Silayoi and Speece, 2007). Convenience cookings could be considered as the ease of use of consumption of the food which indicates time reducing and less effort to prepare (Luning, 2001). Consumers who need convenience cookings, agree that ready-to-eat frozen foods are convenient (Darian, 1995). Moreover, packaging concepts of ready-to-eat frozen food are designed more and more to fulfill the consumers need for more convenience (Luning, 2001). Packaging concepts, such as graphics, size/shape, information, technology definitely could give
- 59. consumers more convenience (Ahmed et al, 2014). For example, graphics on the packages, such as their color and design, trend to have an impact on consumer buying behavior because graphics are necessary when consumers do not have time for much consideration and decision making; therefore, graphics could draw their attention to the product (Ahmed et al, 2014). Moreover, according to Jinkarn and Suwannaporn (2015), the size and shape of packaging is more likely to play an important role in consumer buying behavior because the proper size and shape of the package could offer convenience to the consumers for storing and preparing or grabbing and holding. In addition, information on the packaging could also have an impact on consumer buying behavior because it can connect consumers with the product and it is very important for the consumers to consider information on a package in order to compare quality and value (Deliya and Parmar, 2012). Similarly, some consumers might pay more attention to the information on the package, especially the consumers who are concerned about health (Silayoi and
- 60. Speece, 2004). In addition, consumer buying behavior is also likely to be influenced by the technology of packaging, such as its recyclability, microwavable, easy-to-open, easy-to-store, easy- to-carry, and preventing breakages (Silayoi and Speece, 2007). However, in this case, the consumer buying behavior is influenced not only by the convenience of the ready-to-eat frozen food packaging. Price and brand of the ready-to-eat frozen food could have an impact on consumer buying behavior as well. For example, price could refer to the perceived value of goods and service, and the different perception of the goods or service leads to a difference in identifying the price, especially the importance of food price often has its effect on consumer’s income (Walters and Bergiel, 1989). On the other hand, brand names could create important information and key benefits of the product, and help consumers remember it (Parry, 2001). Literature Review Consumer buying behavior: Consumer buying behavior involves the selection, purchase and consumption of goods and services in order to satisfy their
- 61. needs and wants. Basically, there are 516 ASBBS PROCEEDINGS OF THE 23RD ANNUAL CONFERENCE different processes involved in consumer buying behavior. Firstly, the consumers would try to find what product and service they would like to consume, then they choose only those products or services that give them greater benefits, and after selecting the product and service, the consumer tends to make an estimate of the available money which they can spend. Lastly, the consumers tend to identify the price of the product and make a decision (Kotler and Keller, 2011). Moreover, there are other factors influencing buying behavior of the consumer such as social class, culture, personal aspect and psychological factors. For example, firstly, culture is critical when it comes to understanding the needs, wants and behaviors of an individual. Basically, culture is part of society
- 62. and the influence of culture on buying behavior varies from country to country. Therefore, analyzing the culture of different groups is very important in terms of consumer buying behavior (Schiffman and Kanuk, 2007). Visual elements of packaging in terms of graphics: Nancarrow et al (1998) stated that graphics is the methodology of visual communication and a combination of visual arts and typography. Mostly, the graphics is developed by marketers. Basically, graphics contain image, layout, color and the total presentation of image communicated to consumers. However, different consumers may observe different packaging in different ways because when consumers learn graphics associations, it could lead the consumers to prefer a certain graphic for certain product categories. In addition, according to Herrington & Capella (1995), when consumers examine packages in the supermarket, the differential perception and the positioning of the graphics can be the difference between identifying and missing the product because eye- catching graphics could make the product stand out on the shelf and attract the consumers.
- 63. Therefore, graphics can affect through the colors and printed lines on the package on which different signs and symbols are located. Moreover, in many situations graphics could create a positive mood and also an important role of packaging graphics is that they could gain the attention of consumers to the product (Silayoi & Speece, 2004).Visual elements of packaging in terms of size/shape: Raghubir and Krishna (1999) conceptualized that size and shape combined with a dimension and consumers trends to use it to make judgments about volume. Basically, consumers could respond to different sizes and shapes in different ways because the effect of packaging size and shape is stronger when product quality is hard to be clarified. Silayoi and Speece (2007) also stated that different packaging sizes attract consumers from different involvement. For example, some consumers find products in larger packaging as a good offer with great value for money and this indicates that when the quality of the product is difficult to judge, the impact of packaging size is greater because bigger packages of food products are more likely to be chosen. For example, if
- 64. consumers are not familiar with the brand of the product, the larger packaging size and shape could be also noticed easily.Informational elements of packaging in terms of product information: Coulson (2000) mentioned that one of the functions of packaging is to communicate product information to consumers, which can help them in their purchase decisions carefully because communication of information is one of the important functions of packaging. For example, it could help consumers to make the right decision in the purchasing process and also provide the consumer the opportunity to consider alternative products and make a choice by reading the information on the package or product. Moreover, Ahmed and Salman (2005) conceptualized that in the food industry, packaging is considered as a communication tool providing information on the product 517 ASBBS PROCEEDINGS OF THE 23RD ANNUAL
- 65. CONFERENCE about ingredients, contents, price, cooking directions and the expiry date. Basically, the objective of the information functions of packaging is to inform consumers about the product’s contents and help the consumers in making their decisions carefully. Informational elements of packaging in terms of technology: Mcllveen (1994) stated that the informational elements of packaging in terms of technology is a combination between research development and innovation that are more effectively packaged for the product. Basically, the development of packaging technologies is concerned with food safety, and these technologies could be related to improving the quality, expiration date, safety, and components of the package. Silayoi and Speece (2004) also mentioned that the technology developed for packaging comes from consumer behaviors. For example, working people often purchase microwavable food packaging which is convenient and suits their lifestyle; therefore, consumers are more likely to pay attention to packaging materials which have an impact on
- 66. convenience as well as the product itself because it could help them with their food preparation. For example, microwavable packaging could be a good solution for consumers when they do not have enough time to prepare their meal. Price sensitivity: Kim et al. (1999) mentioned that price is the value of purchasing goods or services and might be involved in consumer buying behavior and price could be an important factor for some consumers because they are more likely to feel price sensitivity when purchasing the product at a lower or higher price. Monroe (1971) also stated that price sensitivity is an individual difference variable describing how individual consumers show their reactions to changes in price levels. In addition, Kanghyun and Thanh (2011) conceptualized that price sensitivity occurs when each consumer shows their reactions to changes in price levels. Basically, it is the awareness of the consumers to what they observe about the cost when purchasing a particular product or service. Normally, each customer will have a certain price acceptability
- 67. range in their mind. When customers are satisfied with the products or services, they are more likely to buy the product again. Brand image: Keller (2008) stated that a brand may include a symbol, name, design, or experience that help consumers identify products and services, in addition branding could also help consumers to reduce risk by ensuring a certain level of product quality and brand image could create values for the product in many ways, such as by helping consumers to process information, differentiate brands, generate reasons to buy, give positive feelings, and increase the reliability of the product. Keller and Lehman (2006) also mentioned that a good brand image provides important benefits to the product and company. For example, a good brand image could help the company to reduce the costs of advertising and help the company to be ahead of the competitors in terms of recognition. Lassar et al. (1995) also mentioned that consumer confidence could occur with a good brand image because loyalty and trust of the consumers are more likely
- 68. to be developed through a good brand image and these lead to confidence in the consumers and the greater the confidence they have in the brand, the more likely they are willing to pay a high price for it. Therefore, a good brand image may give buyers confidence that it performs better than a brand which is unknown and the feeling of confidence communicated by the brand can be an important additional benefit to the buyer. 518 ASBBS PROCEEDINGS OF THE 23RD ANNUAL CONFERENCE Visual elements of packaging in terms of graphics, size/shape and consumer buying behavior. Ahmed et al. (2014) conceptualized that graphics on the package, such as color and design
- 69. play an important role in consumer buying behavior because graphics are necessary when consumers do not have time for much consideration and the decision making process for a product. Abdullah et al. (2013) concluded that there is a significant positive relationship between the graphics on packaging and consumer buying behavior. Moreover, Adam and Ali (2014) stated that consumer consumption trends increased when packages are available in larger sizes. For example, a larger package is considered by consumers of larger families, and a smaller package for them could be considered as a waste. Jinkarn and Suwannaporn (2015) also revealed there is a positive relationship between the size and shape of packaging and consumer buying behavior. Visual elements of packaging in terms of graphics, size/shape and brand image Underwood et al. (2001) stated graphics could help consumers find the brand of their choice and if they do not have any strong preference for a brand then graphics at least gain their attention to consider a particular product for evaluation. Edward (2013) summarized that graphics used in
- 70. packaging have a significant relationship with brand image. According to Agariya et al. (2013), a proper size and shape packaging can help brands in a good position in the market place and set a brand apart from its competitors in order to get consumers’ attention easier and also can represent an image of the brand. Orth and Malkewitz (2006) also concluded that there is a significant positive relationship between size and shape of packaging, and brand image. Informational elements of packaging in terms of product information, technology and brand image. Sial et al. (2011) stated that packaging information, such as labeling which is written on the package or a product could contain the brand name of the product as well as the ingredients. Moreover, a company uses packaging and labeling as a tool to attract consumers because the consumers tend to pay more for the product which has a good brand name, compared to those products which do not have a good brand image. Machado et al. (2012) concluded that there is
- 71. statistically significant relationship between product information and brand image. In addition, Danaei et al. (2014) conceptualized that companies tend to create a strong brand image by improving the quality of products as well as establishing strong brands through the packaging technology of the product, such as ease of use, ease of handling and safety. Mahajan et al. (2013) also mentioned that there is a significant relationship between packaging technology and brand image. Informational elements of packaging in terms of product information, technology and consumer buying behavior. 519 ASBBS PROCEEDINGS OF THE 23RD ANNUAL CONFERENCE According to Deliya and Parmar (2012), the
- 72. information elements on packaging include the label indicating the brand name of the product, and information could connect consumers with the product because the consumers feel that it is very important to consider information on a package in order to compare quality and value. Mutsikiwa et al. (2013) concluded that there is a significant relationship between the information on the package and consumer buying behavior. Mahajan et al. (2013) conceptualized that packaging technology, such as innovative packaging could add value to the product in the eyes of consumers, such as portion control, recyclability, child-proofing, easy-open, easy-store, easy-to-carry, and non- breakability. Silayoi and Speece (2007) also stated that there is a positive relationship between the technology of packaging and consumer buying behavior. Price sensitivity and brand image. Soba and Aydin (2012) stated that when consumers have a high income level, it means that price sensitivity of the consumers is low because consumers with a higher income prefer to buy
- 73. products at higher prices and they also think that a higher price means higher quality. Moreover, price sensitivity of the consumers also has an impact on brand image. For example, the consumer with a high income is more likely to purchase any product which has a good brand image. Dhurup et al. (2013) studied about price sensitivity and brand image and found that there is an impact of price sensitivity on brand image. Price sensitivity, brand image and consumer buying behavior. Diaz (2003) conceptualized that consumers’ knowledge of prices was found to be dependent on how much importance they placed on price. For example, if the consumer comes from lower- income households, they tend to spend less because their sensitivity to price is influenced by their income level. Kanghyun and Thanh (2011) also mentioned that when consumers do an evaluation on the price of the product, price sensitivity will occur. Brucks et al. (2000) summarized that there is a relationship between price and consumer buying behavior. Sial et al. (2011) mentioned that a good brand image enhances the value of the brand in the
- 74. consumer’s mind because a good image could increase the likeability and desirability of the product. Fianto et al. (2014) also concluded that that brand image has a positive and significant influence on consumer buying behavior. Research Framework Based on three previous studies conducted by Sial et al. (2011), Karampour and Ahnmadinejad (2014) and Silayoi and Speece (2004), the researcher developed a conceptual framework consisting of six independent variables which are the visual elements of CP ready-to- eat frozen food packaging in terms of graphics, the visual elements of CP ready-to-eat frozen food packaging in terms of size/shape, the informational elements of CP ready-to-eat frozen food packaging in terms of product information, the informational elements of CP ready-to-eat frozen food packaging in terms of technology, price sensitivity of CP ready-to-eat frozen food, brand image of CP ready-to-eat frozen food and consumer buying behavior as dependent variable. The conceptual framework is shown in Figure.1.
- 75. 520 ASBBS PROCEEDINGS OF THE 23RD ANNUAL CONFERENCE Figure: 1 Conceptual framework hhhhh
- 76. Research Hypotheses H1: Visual elements of CP ready-to-eat frozen food packaging in terms of graphics and size/shape are significantly influenced on consumer buying behavior. H2: Visual elements of CP ready-to-eat frozen food packaging in terms of graphic and size/shape are significantly influenced on brand image. H3: Informational elements of CP ready-to-eat frozen food packaging in terms of product information and technology are significantly influenced on brand image. Packaging Elements of CP Ready-to-eat Frozen food Visual Elements Graphics Size/Shape
- 77. Informational Elements Product Information Technology Brand Image of CP ready-to-eat frozen food Consumer Buying Behavior H1 H2 H3 Price sensitivity of CP ready- to-eat frozen food H5 521
- 78. ASBBS PROCEEDINGS OF THE 23RD ANNUAL CONFERENCE H4: Informational elements of CP ready-to-eat frozen food packaging in terms of product information and technology are significantly influenced on consumer buying behavior. H5: Price sensitivity of CP ready-to-eat frozen food is significantly influenced on brand image. H6: Price sensitivity of CP ready-to-eat frozen food and Brand image are significantly influenced on consumer buying behavior. Research methodology The researcher applied descriptive research by using survey techniques, and also the researcher distributed the questionnaire using a self- administered techniques to collect the data from 399 respondents in Bangkok, Thailand. The target of this study is males or females who have experience purchasing CP ready-to-eat frozen food. The researcher collected data from CP Fresh mart stores from three main target areas which are Fortune town, Silom and Phayathai. These three
- 79. areas are crowded because they are close to the BTS sky train and MRT subway train where many people use as transportation during rush hours (www.google.co.th/maps/place/CP+Freshmart, accessed the data on 22/06/2015). The questionnaire for this study was separated into two parts – Sections A and B. Section A of the questionnaire contains questions on the demographic profile, such as the respondents’ age, gender, education level, marital status and monthly income. Section B of the questionnaire was based on the researcher’s conceptual framework, and the five point Likert scale was applied for the questionnaires, and the meaning of each scale is 1 indicates “strongly disagree”, 2 indicating “disagree”, 3 indicating “moderate”, 4 indicating “agree”, and 5 indicating “strongly agree”. The result of this study will represent specific areas in Bangkok only. The researchers will not be able to collect data from all the population who have purchased CP ready-to-eat frozen foods from every CP fresh mart branches in Thailand, due to limitations of money, time and personnel; also, the researcher used purposive sampling, quota sampling
- 80. and convenience sampling to gather the data, therefore it may not cover all answer of CP ready-to eat frozen food consumers in Thailand. The data collection for this study took place in the month of September 2015; therefore, the result of this study is limited to this particular time frame. In this research, the Cronbach’s Alpha test was also done to see the reliability and consistency of variables of this research. The collected data were treated using Descriptive and Inferential statistics. Moreover, descriptive statistics were used in describing the parameters of the respondents and inferential statistics were used to test the hypotheses. Multiple Regression Model and Simple Regression Model were used find out the influences of the independent variables on the dependent variable. Research Findings According to the descriptive analysis of the demographic factors among 399 respondents, it showed that a majority of respondents were mostly female, which is equal to 62.2% (248). The highest percentage of respondents’ age mostly is between 21 to
- 81. 30 years old which is equal to 48.1% (192). Most of respondents are single which is equal to 65.9%. The highest education level http://www.google.co.th/maps/place/CP+Freshmart 522 ASBBS PROCEEDINGS OF THE 23RD ANNUAL CONFERENCE of the respondents is a Bachelor’s Degree which is equal to 84.2% (336), and the highest percentage of respondents’ monthly income is the range of 20,000-40,000 Baht which represents 82.0% (327). Moreover, the result of descriptive analysis of the variables revealed that the price sensitivity of CP ready-to-eat frozen food has the lowest mean which is equal to 2.87. It means that the price sensitivity of CP ready-to-eat frozen food does not have much influence on the buying decision of the consumers, and it means that the consumers are not concerned with the price of CP ready-to- eat frozen food. On the other hand, the highest mean belongs to the informational elements of CP
- 82. ready-to-eat frozen food packaging in terms of product information which is equal to 3.42, and it means that most of the consumers mainly focus on the packaging information when making a buying decision. For this study, the researcher made use of Multiple Linear Regression (MLR) and Simple Linear Regression (SLR) to test the influences of the hypotheses. The research results of Multiple Linear Regression (MLR) and Simple Linear Regression (SLR) showed that all the null hypotheses were rejected as the following table 1 shows the results of the hypotheses testing. Table 1: Summary results of hypotheses testing Variables (H1) Beta Significance Result Visual elements of CP ready-to-eat frozen food packaging in terms of Graphics and Size/shape 0.456 0.296 .000
- 83. .000 Rejected Variables (H2) Beta Significance Result Visual elements of CP ready-to-eat frozen food packaging in terms of Graphics and Size/shape 0.147 0.423 .014 .000 Rejected Variables (H3) Beta Significance Result Informational elements of CP ready-to-eat frozen food packaging in terms of product information and technology
- 84. 0.239 0.418 .000 .000 Rejected Variables (H4) Beta Significance Result Informational elements of CP ready-to-eat frozen food packaging in terms of product information and technology 0.397 0.145 .000 .000 Rejected Variable (H5) Beta Significance Result Price sensitivity of CP
- 85. ready-to-eat frozen food 0.382 .000 Rejected Variables (H6) Beta Significance Result Price sensitivity of CP ready-to-eat frozen food and brand image -0.051 0.422 .142 .000 Rejected As stated in Table 1, the visual elements of CP ready-to-eat frozen food packaging in terms of graphics had the strongest influence on consumer buying behavior at 0.456 of beta, followed by the brand image of CP-ready-to-eat frozen food which is influenced on consumer buying behavior with at 0.422 of beta. In addition, the visual elements of CP ready-to-eat frozen food packaging in
- 86. 523 ASBBS PROCEEDINGS OF THE 23RD ANNUAL CONFERENCE terms of size/shape had the strongest influence on brand image at 0.423 of beta, followed by the informational elements of CP ready-to-eat frozen food packaging in terms of technology which is influenced on brand image at 0.418 of beta. However, the price sensitivity of CP ready-to-eat frozen food is not influenced on consumer buying behavior at -0.051 of beta respectively. Therefore, it implies the visual elements of CP ready-to-eat frozen food packaging in terms of graphics had a stronger influence on consumer buying behavior than the other variables. Conclusions The purpose of this study is to identify the factors of CP ready- to-eat frozen food packaging on consumer buying behavior towards CP fresh mart stores, Bangkok, Thailand. There are six
- 87. independent variables which are the visual elements of packaging in terms of graphics, the visual elements of packaging in terms of size/shape, the informational elements of packaging in terms of product information, the informational elements in terms of technology, price sensitivity and brand image, and one dependent variable to study is consumer buying behavior. The data was collected from 399 questionnaires that were distributed to the respondents when they purchased CP ready-to-eat frozen food at three selected areas of CP fresh mart stores starting from 25 September 2015 to 7 October 2015. Basically, a majority of the respondents were females aged between 21 to 30 years, with a bachelor’s degree, having a monthly salary in the range of 20,000 – 40,000 THB, and they were single. For hypothesis testing, all of the six hypotheses were analyzed by SPSS, and all of null hypotheses were rejected. As stated in table 1, the visual elements of CP ready-to-eat frozen food packaging in terms of graphics had the strongest influence on consumer buying behavior at 0.456 of beta coefficients, followed by the brand image of CP-
- 88. ready-to-eat frozen food which is influenced on consumer buying behavior with at 0.422 of beta coefficients, the informational elements of CP ready-to-eat frozen food packaging in terms of product information which is influenced on consumer buying behavior at 0.397 of beta coefficients, the visual elements of CP ready-to-eat frozen food packaging in terms of size/shape which is influenced on consumer buying behavior at 0.296 of beta coefficients, the informational elements of CP ready-to-eat frozen food packaging in terms of technology which is influenced on consumer buying behavior at 0.145 of beta coefficients. However, the price sensitivity of CP ready-to-eat frozen food is not influenced on consumer buying behavior at - 0.051 of beta coefficients respectively. In addition, the visual elements of CP ready-to-eat frozen food packaging in terms of size/shape had the strongest influence on brand image at 0.423 of beta coefficients, followed by the informational elements of CP ready-to-eat frozen food packaging in terms of technology which is
- 89. influenced on brand image at 0.418 of beta coefficients, the price sensitivity of CP ready-to-eat frozen food is influenced on brand image at 0.382 of beta coefficients, the informational elements of CP ready-to-eat frozen food packaging in terms of product information which is influenced on brand image at 0.239 of beta coefficients and the visual elements of CP ready-to-eat frozen food packaging in terms of graphics which is influenced on brand image at 0.147 of beta coefficients. 524 ASBBS PROCEEDINGS OF THE 23RD ANNUAL CONFERENCE Recommendations Based on the results of hypotheses testing. The researcher found that the visual elements of CP ready-to-eat frozen food packaging in terms of graphics had the strongest influence on consumer buying behavior at 0.456 of beta coefficients which means this part of the ready-to-eat
- 90. frozen food packaging caught consumers’ attention effectively. Therefore, the researcher would like to suggest the marketing teams of a ready-to eat frozen food companies to focus on the graphics of the package, such as color and design. The marketing teams may compare what some of the competitors have done with their packaging in terms of graphics. The researcher observed that the brand image of CP-ready-to-eat frozen food had the high impact on consumer buying behavior as well at 0.422 of beta coefficients which means that brand image plays an important role on buying behavior of the consumers. A good brand image will help the consumers understand what the companies’ product or service is all about, and what they can expect from the product or service. The good brand image could get the business perceived as reliable, and this will engage the consumers with the product. Therefore, the ready-to-eat frozen food companies need to make sure that their products have the good brand image. The informational elements of CP ready-to-eat frozen food packaging in terms of product information which is also influenced on consumer
- 91. buying behavior at 0.397 of beta coefficients which means consumers are more likely to consider an information on a package in order to compare quality and the value of the products. Therefore, the companies are supposed to come up with a clear information, and not giving too much information on the package because it is necessary for consumers to consider nice and clear information on the package The researcher also found that the visual elements of CP ready-to-eat frozen food packaging in terms of size/shape is influenced on consumer buying behavior at 0.296 of beta coefficients which means that the consumers are concerned with the size and shape of the package. The researcher would like to suggest that the ready-to-eat frozen food companies also need to create a proper size and shape packaging for consumers when grabbing or holding because they are more likely to take this function to the evaluation of the brand of the product. Therefore, a proper size and shape of the package can help brands in a good position in the market and set a brand apart from its competitors. Lastly, the technology of packaging is
- 92. influenced on consumer buying behavior at 0.145 of beta coefficients which means the technology of packaging such as innovative packaging can never be ignored. The researcher would like to suggest that the companies also need to focus on research and development of packaging because innovative packaging with recyclability, un-breakability, microwavable and so on could add value to ready-to-eat frozen foods and result in companies brand to have a good image. References Aaker, A., Kumar, VD. and George, S. (2000), Marketing research, John Wiley and Sons, Inc, New York. Aaker, D.A., Kumar, V. and Day, G.S. (1998), Marketing Research, ( 6th ed):John Wiley & Sons,Inc 525
- 93. ASBBS PROCEEDINGS OF THE 23RD ANNUAL CONFERENCE Abdullah, A. M., Rahman, K.M. and Robel1, S. (2014), A Critical Review of Consumers’ Sensitivity to Price: Managerial and Theoretical Issues, Journal of International Business and Economics, 2 (2), 1-9. Abdullah, M., Kalam, A. and Akterujjaman., S. M. (2013), Packaging Factors Determining Consumer Buying Decision, International Journal of Humanities and Management Sciences (IJHMS), 1 (5), 285 -289. Adam, A. M. and Ali, K. (2014). Impact of Visual Packaging Elements of Packaged Milk on Consumers Buying Behavior, Interdisciplinary Journal of Contemporary Research in Business,5 (11). Agariya, K. A., Johari, A., Sharma, K. H., Chandraul, U. and Singh, D. (2012), The Role of Packaging in Brand Communication, International Journal of Scientific & Engineering Research, 3 (2), 1-9.
- 94. Ahmed, A., Ahmed, N. and Salman, A. (2005). Critical issues in packaged food business, British Food Journal, 107 (10), 760-80. Ahmed, R. R., Ahmad, N., Parmar, V. and Imamuddin, K. (2014). Role of Packaging and Labeling on Pakistani Consumers Purchase Decision, European Scientific Journal, 10 (16) Ahmed, R. R. and Nawaz, A. (2014), Role of packaging and labeling on Pakistani consumer, European Scientific Journal, 10 (16), 464-473. Ahmed, R. R., Parmar, V. and Amin, A. M. (2014), Impact of Product Packaging on Consumer’s Buying Behavior, European Journal of Scientific Research, 120 (2), 145-157. Almus, M, and E. A. Nerlinger, 1999, Growth of New Technology Based Firms: Which Factors Matter?, Small Business Economics, Vol13, 41-154 Ares, G. and Deliza, R. (2010), Studying the influence of package shape and color on consumer expectations of milk desserts using word association and conjoint analysis, Food Quality and Preference, 21 (8), 930-7.
- 95. Battaglia, P. M. (2011), Nonprobability Sampling, Encyclopedia of Survey Research. Blackwell, R. D., Miniard, P. W. and Engel, J. F. (2006)., Consumer behavior. Mason: Thomson. Brown, K.M. (2005). Reconciling moral and legal collective entitlement: Implications for community-based land reform. Brucks, M., Zeithaml, M. and Gillian, N. (2000), Price and brand name as indicators of quality dimensions for consumer durables, Academy of Marketing Science Journal, 28 (3), 360-374 Churchill, G. A. (1991). Marketing Research: Methodological Foundations,(5th ed.), Dryden Press. Comfrey, A. L. and Lee, H. B. (1992). A First Course in Factor Analysis. Hillsdale, NJ: Lawrence Eribaum Associates. Corston, R. and Colman, A. (2000), A Crash Course in SPSS for Windows, Blackwell, Oxford.
- 96. Cooper, D. and Schindler, P. (2001), Business Research Methods, (7th ed), New York: McGraw-Hill/Irwin. Coulson, N.S. (2000), An application of the stage of change model to consumer use of food labels, British Food Journal, 102 (9), 661-8. Danaei, H., Haghtalab, H. and Ali, B. (2014), The effect of product performance on brand image: case study Razavi Yeast product, Indian Journal of Fundamental and Applied Life Sciences, 4 (1), 635-640. 526 ASBBS PROCEEDINGS OF THE 23RD ANNUAL CONFERENCE Deliya, M. M. and Parmar, J. B. (2012), Role of Packaging on Consumer Buying Behavior– Patan District, Global Journal of Management and Business Research, 12 (10), 49-67.
- 97. Dhurup, M., Mafini, C. and Dumasi, T. (2014), The impact of packaging, price and brand awareness on brand loyalty: Evidence from the paint retailing industry, 14(1), 1-9. Díaz, R. and Maria, I. (2004), Price knowledge: effects of consumers' attitudes towards prices, demographics, and sociocultural characteristics, Journal of Product & Brand Management, 13 (6), 406 – 428 Darian J.C. (1995) Segmenting by consumer time shortage, Journal of Consumer Marketing, 12(1), 32-44. Edward , W. (2013), The influence of visual packaging desi gn on perceived food product quality, value, and brand preference, International Journal of Retail & Distribution Management, 41(10), 805 – 816 Everett, J. and Armstrong, B. (1990), Research Note: Book/Software Review: SPSS for teaching statistics in marketing. Asia Pacific Journal of Marketing and Logistics, 2(1). Fisher, R. A. (1925). Statistical methods for research workers.
- 98. Edinburgh, Scotland: Oliver and Boyd. Gay, L.R. (1987), Competencies for Analysis and Application, (3rd ed),Ohio: Education Research. Guadagnoli, E. and Velicer, W.F, (1988), Relation of sample size to the stability of component. Psychological bulletin, 103, 265-275. Hair, J., Anderson, R. and Tatham, W. B. (1998). Multivariate Data Analysis, (5th ed), Prentice Hall International, London. Henry, L. (1968), Historical demography. Daedalus, 97, 385–96 Herrington, J.D. and Capella, L.M. (1995), Shopping reactions to perceived time pressure, International Journal of Retail & Distribution Management, 23 (12), 13-20. Hill, H. and Tilley, J. (2002), Packaging of children’s breakfast cereal, British Food Journal, 104 (9), 766-77. Holbrook, M. B. and Hirschman, E. C. (1982). The Experiential Aspects of Consumption: Consumer Fantasies, Feeling, and Fun, Journal of
- 99. Consumer Research, 132-140. Jinkarn, T. and Suwannaporn, P. (2015), Trade-off analysis of packaging attributes for foods and drinks, British Food Journal, 117 (1), 139-156. Kanghyun, Y. and Thanh, V. (2011), Revisiting the relationship between consumer loyalty and price sensitivity: the moderating role of deal-proneness, journal of Marketing Theory and Practice, 19, (3), 293–306. Karampour, A. and Ahmadinejad, B. (2014), The research model of Purchase intention for a private label brand: direct impact of factors including price sensitivity, understanding brand, image of private brands and metal image of store. Kuwait Chapter of Arabian Journal of business and management review, 3(7), 417-424. Keller, K. L. (1993). Conceptualizing, measuring, and managing customer-based brand equity. Journal of Marketing, 57(1), 1–22. Keller, K. L. (2008). Strategic brand management: Building, measuring, and managing brand equity. (3rd ed.). Upper Saddle River, NJ: Prentice Hall.
- 100. Keller, K. L. and Lehmann, D. R. (2006). Brands and branding: Research findings and future priorities. Marketing Science, 25(6), 740-759. Kim, B., Srinivasan, K. and Wilcox, R. T. (1999). Identifying price sensitive consumers: the Kolodinski relative merits of demographic vs. purchase pattern information. Journal of Retailing, 75(2), 173-193. 527 ASBBS PROCEEDINGS OF THE 23RD ANNUAL CONFERENCE Kotler, P. and Keller, K. (2011). Marketing Management, (14th ed), London: Pearson Education. Kupiec, B. and B. Revell. (2011). Measuring consumer quality judgments. Br. Food J, 103, 7-22. Lassar, W., Mittal, B. and Sharma, A. (1995). Measuring customer-based brand equity.
- 101. Journal of Consumer Marketing, 12 (4), 11-19. Lind, D., Marchal, W. and Wathen, S. (2010). Statistical Techniques in Business & Economics, (14th ed), New York: McGraw-Hill Irwin. Luning, A .P. (2001), Safety in the Agri-food chain, Wageningen Academic Publishers. Machado, C. J., Carvalho, V. L., Costa, P. and Lencastle, P. (2012), Brand mergers: examining consumers' responses to name and logo design, Journal of Product & Brand Management, 21(6), 418 – 427. Mahajan, S., Vaishya, O.R., Gupta, A. and Dholle, V. (2013). Role of Packaging for Enhancing the Sales Appeal, 2 (7), 111-114. Malhotra, N. K. (2000). Marketing Research, (3rd Ed.). New Jersey: Prentice Hall. Malhotra, N. K. (2004), Marketing Research: An applied orientation (4th ed), Upper Saddle River: Prentice Hall. Malik, E. M., Ghafoor, M. M., Iqbal K. H., Ali, Q., Hunbal, H., Noman, M. and Ahmad, B. (2013).Impact of Brand Image and Advertisement on Consumer Buying Behavior, World
- 102. Applied Sciences Journal, 23 (1), 117-122. Matthew, B. (2008). Multiple Hypothesis Testing: The F-test, Resources: http://www.mattblackwell.org/files/teaching/ftests.pdf. McDaniel, C. and Gate, R. (1999), Contemporary Marketing Research, South Western College Publishing: Cincinnati, OH. Mcllveen, H. (1994), Product development and the consumer: the reality of the managing creativity, Nutrition and Food Science, 6, 26-30. Monroe, K. B. (1971). Measuring Price Thresholds by Psychophysics and Latitudes of Acceptance, Journal of Marketing Research, 8, 460– 64. Mousavi, A. S. and Jahromi, M. M. (2014), Examining the Relationship between Packaging and Consumer buying behavior (Case study: Comparison of Pasteurized 1.5L Milk of Brands Roozaneh and Mihan), Indian Journal of Fundamental and Applied Life Sciences, 4 (1), 1038-1044. Mutsikiwa, M., Marumbwa, J. and Mudondo, C. D. (2013), The Impact of Informational
- 103. Package Elements on Consumer Purchase Behavior of Breakfast Cereal Products: The Case of University Students in Masvingo, Zimbabwe, European Journal of Business and Management, 5 (8), 55-63. Nancarrow, C., Wright, T.L. and Brace, I. (1998).Gaining competitive advantage from packaging and labeling in marketing communications, British Food Journal,100 (2),110- 18. Ogba, I.E., and Johnson, R. (2010). How packaging affects the product preferences of children and the buyer behavior of their parents in the food industry. Young Consumers: Insight and Ideas for Responsible Marketers, 11(1), 77-89. Orth, R. and Malkewitz, K. (2006), Packaging design as resource for the construction of brand identity, International Wine Business Research Conference (3rd ed), Montpellier. Parry, M.E. (2001), Strategic Marketing Management, McGraw - Hill Professional. Polit, D. and Beck, C. (2008), Nursing research: generating and
- 104. assessing evidence for http://www.emeraldinsight.com/action/doSearch?ContribStored =C%C3%A9sar+Machado%2C+J http://www.emeraldinsight.com/action/doSearch?ContribStored =C%C3%A9sar+Machado%2C+J http://www.emeraldinsight.com/action/doSearch?ContribStored =Costa%2C+P http://www.mattblackwell.org/files/teaching/ftests.pdf 528 ASBBS PROCEEDINGS OF THE 23RD ANNUAL CONFERENCE Nursing practice, (8th ed), New York. Prendergast, P.G. and Pitt, L. (1996), Packaging, marketing, logistics and the environment: are there trade-offs?, International Journal of Physical Distribution & Logistics Management, 26 (6), 60-72. Proctor, D. N. and Joyner, M. J. (1997). Skeletal muscle mass and the reduction of VOµmax in trained older subjects. Journal of Applied Physiology, 82, 1411—1415.
- 105. Raghubir, P. and Krishna, A. (1999), Vital dimensions in volume perception: Can the eye fool the stomach?, Journal of Marketing Research, 36 (3), 313- 26. Rensis, L. (1932). A Technique for the Measurement of Attitudes, Archives of Psychology, 140, 1-55. Rettie, R. and Brewer, C. (2000), “The verbal and visual components of package design”, Journal of Product & Brand Management, 9 (1), 56-70. Robbins, M.C. and Pollnac, R.B. (1969), Drinking patterns and acculturation in rural Buganda, American Anthropologist, 71, 276-285. Schaeffer, N. C. (1991). Conversation with a Purpose--Or Conversation? Interaction in the Standardized Survey in Measurement Errors in Surveys. Schiffman, L. and Kanuk, L. (2007), Consumer behavior, (8th ed), Prentice Hall. Sekaran, U. (2003). Research methods for business: A skill - building approach. (2nd Ed.). New York: John Wiley and Sons Inc.
- 106. Sial, M., Gulzar, A., Ain Riaz., and Nawaz, B., (2011). Impact of labeling and Packaging on buying behavior of young consumers with mediating role of Brand Image. Interdisciplinary Journal of Contemporary Research in Business, 3 (8). 1022-1028 Silayoi, P. and Speece, M. (2004), Packaging and purchase decisions an exploratory study on the impact of involvement level and time pressure, British Food Journal, 106 (8), 607-628. Silayoi, P. and Speece, M. (2007), The importance of packaging attribute: a conjoint analysis approach, Europen Journal of Marketing, 41 (12), 1495-1517. Soba, M. and Aydin, E. (2012), The Role of Income Level on Sensitivity Levels for Similar Product: A Purchasing Behavior Study, International Journal of Humanities and Social Science, 2 (18), 177-181. Stewart, B. (2004), Packaging Design Strategies. Second Edition. The UK: Pira International Ltd. Stewart, D.W. (1984), Secondary Research: Information Sources and Methods, Beverly Hills:
- 107. Sage. Underwood, L.R., Klein, M.R. and Burke, R.R. (2001), Packaging communication: attentional effects of product imagery, Journal of Product & Brand Management, 10 (7), 403 – 422 Underwood, R.L. (2003), The communicative power of product packaging: creating brand identity via lived and mediated experience, Journal of Marketing Theory and Practice ,11 (1), 62-76. Walters, G. and Bergiel. B.J. (1989), Consumer Behavior: A Decision-Making Approach, Cincinnati, Ohio: South-Western Publishing Co. Williams, R. (2015). Review of Multiple Regression, University of Notre Dame, Resources: http://www3.nd.edu/~rwilliam/. Www.euromonitor.com/ready-meals-in-thailand/report. Zikmund, W. G. (2003). Business research methods, (7th Ed.). USA: Thomson South-Western.
- 108. http://www3.nd.edu/~rwilliam/ http://www.euromonitor.com/ready-meals-in-thailand/report Copyright of Proceedings of the American Society of Business & Behavioral Sciences is the property of American Society of Business & Behavioral Sciences and its content may not be copied or emailed to multiple sites or posted to a listserv without the copyright holder's express written permission. However, users may print, download, or email articles for individual use. MAR 3211, Consumer Behavior 1 Course Learning Outcomes for Unit I Upon completion of this unit, students should be able to: 1. Discuss how the field of marketing is influenced by the actions of consumers. 1.1 Analyze how the actions of consumers impact an organization. 3. Explain how consumers interpret information about products and people. 3.1 Describe factors that will impact how consumers view and
- 109. ultimately purchase products and services. 7. Explain the steps of the consumer decision-making process. 7.1 Explain the steps in the consumer decision-making process and how they relate to consumer behavior. Course/Unit Learning Outcomes Learning Activity 1.1 Unit Lesson PowerPoint Presentation Foxall and Sigurdsson (2013) article Article Review 3.1 Unit Lesson PowerPoint Presentation Shateri, Nayebzadeh, and Roknabadi (2016) article Article Review 7.1 Unit Lesson PowerPoint Presentation Article Review
- 110. Reading Assignment In order to access the following resources, click the links below. Click here to access the Unit I PowerPoint presentation. (Click here to access a PDF version of the presentation.) Foxall, G. R., & Sigurdsson, V. (2013). Consumer behavior analysis: Behavioral economics meets the marketplace. The Psychological Record, 63(2), 231–238. https://libraryresources.columbiasouthern.edu/login?auth=CAS &url=http://search.ebscohost.com/logi n.aspx?direct=true&db=a9h&AN=87083913&site=ehost- live&scope=site Shateri, F., Nayebzadeh, S., & Roknabadi, A. D. (2016). Evaluating advertisement: The role of customer's decision-making style, innovativeness, and ideology. International Journal of Information, Business and Management, 8(4), 159–177. https://libraryresources.columbiasouthern.edu/login?auth=CAS &url=http://search.proquest.com.library resources.columbiasouthern.edu/docview/1814292332?accounti d=33337 UNIT I STUDY GUIDE Introduction to Consumer Behavior and Decision-Making
- 111. https://online.columbiasouthern.edu/bbcswebdav/xid- 139626008_1 https://online.columbiasouthern.edu/bbcswebdav/xid- 139626007_1 https://libraryresources.columbiasouthern.edu/login?auth=CAS &url=http://search.ebscohost.com/login.aspx?direct=true&db=a 9h&AN=87083913&site=ehost-live&scope=site https://libraryresources.columbiasouthern.edu/login?auth=CAS &url=http://search.ebscohost.com/login.aspx?direct=true&db=a 9h&AN=87083913&site=ehost-live&scope=site https://libraryresources.columbiasouthern.edu/login?auth=CAS &url=http://search.proquest.com.libraryresources.columbiasouth ern.edu/docview/1814292332?accountid=33337 https://libraryresources.columbiasouthern.edu/login?auth=CAS &url=http://search.proquest.com.libraryresources.columbiasouth ern.edu/docview/1814292332?accountid=33337 MAR 3211, Consumer Behavior 2 UNIT x STUDY GUIDE Title Unit Lesson When you think of consumer behavior, what thoughts come to your mind? Why do you think that there is a consumer behavior course included in most marketing degree programs? There are many definitions of consumer behavior, but the main concepts involve studying how people choose goods and services to fulfill any wants or needs they may experience. Consumer behavior is truly an ongoing process in which marketers
- 112. attempt to understand behaviors in order to fulfill the needs of the consumer. Another focus of consumer behavior is the spending habits of consumers. There is a need for organizations to understand this behavior as it relates to consumer buying. Identifying the stages of the consumption process provides a good perspective on how organizations accomplish this, beginning with the pre-purchase stage where marketers need to understand how a consumer begins the buying process. Providing valuable information on the worthiness of the product or service might be effective during this stage. Subsequently, during the purchase stage, the marketer should look to make the experience a pleasant one. Finally, during the post-purchase stage, the consumer decides if the product or service has truly fulfilled his or her need. Think about a product that you purchased recently. Was it a pleasant experience? Did the product fulfill your needs? Would you recommend it to friends? These are all questions that the marketer is asking. As marketers look to examine the needs of consumers, it is important to understand that the most economical and effective method for an organization to meet consumer needs is to identify a target market. The target market is the group of people on which marketers will focus their marketing efforts. You are probably wondering why marketers would not prefer to target everyone, which seemingly would reach a larger market and
- 113. provide greater exposure. The simple answer is that marketing departments do not have unlimited marketing budgets. It is not financially feasible to attempt to reach everyone. A better method is to focus on a certain group of individuals who would most likely be interested in a company’s product or service. Understanding the needs and wants of this group is paramount. The process of identifying the target market begins with segmentation. This involves dividing a broad population into subsets of consumers based on several criteria. The first criterion we will discuss is demographics, which involves looking at characteristics such as age, gender, family structure, social class/income, and race/ethnicity. Another criterion could be geographic, which speaks to the region of the country or world, region in a country, neighborhood, or even the size of the city in which the consumer lives. The psychographic criterion relates to personal values that will drive perception and motivations. Finally, the behavioral criterion utilizes the specific interests, rate of use, and brand familiarity of the consumer. Once a marketer has completed this segmentation process, he or she can better identify a detailed description of the target market. Consumer at coffee shop (Pexels, 2016)
- 114. MAR 3211, Consumer Behavior 3 UNIT x STUDY GUIDE Title Criteria Characteristics Example Demographic Age, gender, family structure, social class/income, family life cycle, race/ethnicity Identifies who the consumer is and where he or she is in life Geographic Region of the country or world, region in a country, neighborhood, size of city the consumer resides Location in world or country in which the consumer lives Psychographic Personality, perceptions, values, beliefs Reflect for weeks on a purchase or buy quickly Behavioral Special interests, rate of use, brand familiarity
- 115. Soccer player, traveler, healthy living Table 1.1: Segmentation criteria Involvement refers to the relevance in the consumer decision- making process. What this suggests is that the consumer’s perceived familiarity with the product, message, or situation will have an impact. Product involvement is simply the consumer’s level of interest in a particular product; in contrast, message involvement refers to the influence that media vehicles have on the consumer. Finally, situational involvement refers to whether the consumer is in a store, on a website, or at a location where the product or service is consumed. Think about the theme stores and restaurants that we frequent and how that theme encourages us to stay longer and enjoy the environment or situation. Through all of this, perceived risk is important—the greater the risk, the less likely the consumer will be to make the purchase. Perceived risk refers to any negative consequence associated with the decision. This can involve monetary risk, functional risk, physical risk, social risk, or psychological risk. As expected, the monetary risk involves a poor choice associated with the exchange of too much money. Functional risk relates to a situation when the product does not function as expected, and physical risk is one that may physically harm the consumer. Social risk involves a results that may affect the consumer’s self-esteem, confidence, or image. Finally, psychological risk reflects on the loss of self-respect with a poor buying decision. The goal of the marketer is to reduce these perceived risks as much as possible in order to encourage and influence the consumer.