
Recommended
Recommended
More Related Content
What's hot
What's hot (20)
Viewers also liked
Viewers also liked (17)
Similar to SPWLA-1986-vXXVIIn3a2
Similar to SPWLA-1986-vXXVIIn3a2 (20)
SPWLA-1986-vXXVIIn3a2
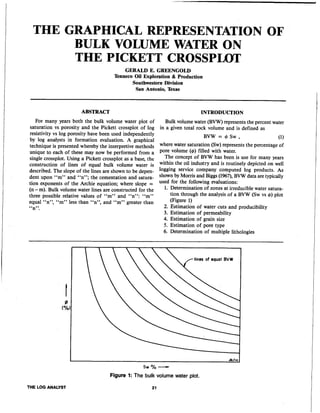
- 1. THE G ICAL REPRESENTATION OF VOLUME WATER ON THE PICKETT C Q S S P m GERALD E. GREENGOLD Tenneco Oil Exploration & Production Southwestern Division San Antonio. Texas ABSTRACT For many years both the bulk volume water plot of saturation vs porosity and the Pickett crossplot of log resistivity vs log porosity have been used independently by log analysts in formation evaluation. A graphical technique is presented whereby the interpretive methods unique to each of these may now be performed from a single crossplot. Using a Pickett crossplot as a base, the construction of lines of equal bulk volume water is described. The slope of the lines are shown to be depen- dent upon “m” and “n”; the cementation and satura- tion exponents of the Archie equation; where slope = (n-m). Bulk volume water lines are constructed for the three possible relative values of “m” and “n”: “m” equal “n”, “m” less than “n”, and “m” greater than “n”. ~ INTRODUCTION Bulk volume water (BVW) representsthe percent water BVW = 4 Sw , (1) where water saturation (Sw) represents the percentage of pore volume (4)filled with water. The concept of BVW has been is use for many years within the oil industry and is routinely depicted on well logging service company computed log products. As shownby Morris and Biggs (1967), BVW data are typically used for the following evaluations: 1. Determination of zones at irreducible water satura- tion through the analysis of a BVW (Sw vs 4) plot (Figure 1) in a given total rock volume and is defined as 2. Estimation of water cuts and producibility 3. Estimation of permeability 4. Estimation of grain size 5. Estimation of pore type 6. Determination of multiple lithologies t0 (% THE LOG ANALYST sw O!O - Figure 1: The bulk volume water plot. 21
- 2. REVIEW OF THE PICKETT CR0SSPU)T The Pickett crossplot, as developed by G.R. Pickett is a graphical representation of the solution to the Archie water saturation equation log Rt = - m log 8 - n log Sw t log (a Rw) where a = Tortuosity factor (a function of the com- Rw = Formation water resistivity at formation $I = Porosity Rt = Deep, uninvaded formation resistivity(rock plus fluids) m = Cementation exponent n = Saturation exponent plexity of the flow path) temperature As detailed in Appendix A, equation 2 can be rewritten as log Rt = -mlog4 - nlogSw + log(aRw) (3) As shown in equation 3 a log-log plot of “Rt”vs ‘‘4” will give a family of parallel lines of equal saturation with a slope of “-m” and a logarithmic spacing controlled by “n” (see Figure 2). Larger “n” values increase and smaller “n” values decrease the perpendicular distance between these lines. The Sw=100% line (also called the “Ro” line) intercepts the 4=100% line at a value of “aRw”. As evidenced from equation 3, when $I=100% the “ -mlog+” term becomes zero and on the “Ro” line the “-nlogSw” term also becomes zero leaving log Rt =log(aRw). By plotting values of “4” and “Rt”, one can graphi- cally estimate the saturation of any point by its position relativeto a given saturation line. Using both the absolute position of the points and pattern analysis, one may estimate productive, marginal, and wet regions of the plot. Until now this has been the primary use of the Pickett crossplot. GRAPHICAL REPRESENTATION OF BULB VOLUME WATER Theory Substituting Sw =BVW/$I from equation 1 into equa- tion 2 gives the following equation for a bulk volume water crossplot (see Appendix B). log Rt = (n-m)log& - nlogBVW + log(aRw) (4) As shown in equation 4 a log-log plot of “4” vs “Rt” gives a family of parallel lines of equal BVW with a slope of “(n-m)” and a logarithmic spacing of “n”. Larger “n” values will increase and smaller “n” values will decrease the perpendicular distance between these lines. Unlike saturation lines, BVW lines may change slope depending upon the relative values of “m” and “n”. When “m” equals “n” regardless of the value, BVW lines have a slope of zero and the lines are horizontal as shown log Rt lines of equal saturation in Figure 3. When “m” is less than “n”, the slope is positive and the lines slope up and to the right as in Figure 4;and when “m” is greater than “n” the slope is negative as depicted in Figure 5. Note that the parallel lines shown in Figures 3,4, and 5 are equivalent to the hyperbolic lines of equal BVW values of Figure 1. Graphical Construction Having shown that constant value BVW lines are straight and parallel on the log-log resistivity-porosity Pickett crossplot and noting that for saturations greater than loo%, BVW values are meaningless, we construct lines of equal BVW by solving the BVW equation at two endpoints and connecting them with a straight line. End- points used are the Ro line and the 4=100% line. The Archie equation may be solved for “Rt” giving, On the “Ro” line Sw=l.O and 4=BVW. Therefore, by substitution into equation 5 we have 22 MAY-JUNE, 1986
- 3. Similarly,on the 4=100%line, 4=1.0 and Sw=BVW. Again, substitution into equation 5 gives aRw BVW“ Rt =-. (7) For a given BVW Value, the only differencein the “Rt” value at Sw=100% and the “Rt” value at 4 =100% is the exponent to which the BVW value is raised; either “m” or “n”. When “m” equals “n”, the value of “Rt” at each end- point is the same and the BVW lines are horizontal. This is shown in Figure 6. Therefore, since BVW =4 on the “Ro” line, when “m” equals “n”, simply construct horizontal linesat the intersection of the Ro line with “4” values equal to desired BVW values. When “m” doesn’t equal “n”, equations 6 and 7 are still used to calculate “Rt” values on the “Ro” and 4=100% lines respectively. However, we may again find the endpoint on the “Ro” line at it’s intersection with the ‘‘4’’ value equal to the desired BVW value. All that remains to be done is to calculate the “Rt” value of the upper (4=100%) endpoint using equation 6. Figures 7 and 8 show the enhanced Pickett crossplots with both saturation and bulk volume water lines for “m” less than “n” and “m” greater than “n” respectively. As a simplification to the construction of BVW lines on a Pickett crossplot, note that for all relativevalues “m” and “n” the BVW=10% line always has as its endpoints the intersection of the “Ro” line at 4 = 10% and the intersection of the Sw=10%line at 4 =100%.Theserela- tions result directly from equation 1. Therefore, after con- struction of the “Ro” and the Sw=10% lines, we con- struct the BVW=lO% line as noted above. All other desired BVW lines are drawnin parallel to the BVW=1OVo line, at the intersections of the “Ro” line and 4 =BVW values. This method of construction may be used with any value BVW line. For example, the BVW =30% line will intersectthe “Ro” line at 4=30%,a nd the 4 =100% line at Sw=30%. The Pickett crossplot is commonly used to estimatethe value of “m” when points plot along the “Ro” line, in- dicating a zone at or near Sw=100Vo. Morris and Biggs (1973) have shown that for zones at irreducible water saturation (Swi), BVW is constant. Theoretically, using a pattern analysis technique similar to that used in the estimation of “my’, one may estimate the value of the quantity “(n-m)” when points plot along a BVW line, I Figure3: The log-log bulk volume water plotfor m=n. lines of equal BVW Figure4: The log-logbulkvolume water plotfor m c n. THE LOG ANALYST 23
- 4. I /lines of equal BVW log Rt :(n-m) log 0 - n log BVW t log(a Rw) I10 B 100 Figure5: The log-logbulk volumewater plot for rn > n. implying that the zone in question is at or near irreduci- ble water saturation. Therefore, if the analyst can locate the same formation at a constant rock type both at “Swi” and at Sw=100V0,then he may estimate the value of “m” and “(n-m)” and therefore the value of “n”. CONCLUSIQNS Both the BVW plot and the Pickett crossplot have been used for many years as aids in formation evaluation.Each has its own relative merits in the analysis of log data through the use of documented methods of pattern analysis. Recognizing that the hyperbolic lines of equal BVW on the bulk volume water plot of Figure 1 are equivalent to the straight BVW lines of the Pickett crossplot in Figures 6, 7, and 8,the log analyst may now perform a dual interpretation from a single plot. I 10 b loo Figure 6: The enhanced Pickett crossplot for rn =n. REFERENCES Pickett, G. R., 1966, ‘Y4 Review of Current Techniques for Determination of Water Saturation From Logs,” Jour. Pet. Techn. Nov., 1966 Pgs. 1425-33 Morrisand Biggs, 1967, “Using LogDerivedValues of Water Saturationand Porosity,” Transactionsof the SPWLA, 1967 Paper X. Picket, G. R., 1973, “Pattern RecognitionAs a Means of For- mation Evaluation,” SPWLA 14th Annual Logging Sym- posium, 1973 Paper A. ABOUT THE AUTHOR JERRY GREENGOLD is a geological engineer with Tenneco Oil Exploration and Production’s Southwestern Divisionin San Antonio, Texas. He received his B.S. degree in Geology from Queens College of the City University of New York in 1979,and in 1981 he received his M.S. degree in Engineering Geology from Purdue University in West Lafayette, Indiana. He is a member of the SPWLA,AAPG and the Association of EngineeringGeo- logists, and has presented papers in the fields of Engineer- ing Geology and Log Analysis. 24 MAY-JUNE, 1986
- 5. I f I1 3 - D 5 ? i = log Rt 10 P I00 I 10 0 100 Figure7: The enhanced Pickett crossplot for rn < n. Figure8: The enhanced Pickett crossplot for rn > n. APPENDIX A APPENDIX B DERIVATION OF THE PICKETT CROSSPIMF Solving the Archie equation for "Rt" gives aRw fb"SW" Rt =-3 or Rt = (aRw) ~-"SW-" Taking the logarithm of each side and rearranging gives log Rt = -mlog& - nlogSw + log(aRw) DERIVATION OF THE BULK VOLUME WATER CROSSPLOT Substituting the BVW equation for "Sw" in the Archie equation gives BVW" - aRw 4 4"Rt ---, Distributing the exponent "n", multiplying through by "I$~" and solving for Rt gives Rt = (aRw) 4n4-" BVW-". Combining like terms we have Rt = (aRw) # J ( " - ~ ) BVW-". Taking the logarithm of both sides and rearranging gives log Rt = (n-m)log4 - nlogBVW + log(aRw). THE LOG ANALYST 25