1. Abstract
Parkinson’s disease affects over a million individuals. The assessment
and diagnosis of the disease relies primarily on a qualitative judgement
by a physician. The goal of our research is to create a non-invasive
quantifiable metric with which the physician can assess the disease
progression of the patient hoping to improve and optimize patient care.
By using a combination of a three axis accelerometer and three axis
gyroscope we hope to take the data collected from patients in a free
living environment and find ways to quantify hand tremor in terms of
its severity, patterns, and number of occurrences. By creating an
interactive GUI in Matlab we are able to take the raw data from the two
devices from all six axis and view it in terms of its constituent
components in both time and frequency domains and applying various
filtration methods. It was decided that we would explore a frequency
analysis of the data due the consistency of frequency found in different
data sets. We found that we could quantify the tremor in terms of
frequency and direction but more analysis is needed to quantify in
terms of amplitude and more precise test data is needed to derive levels
of accuracy.
Methodology
In order to establish these metrics we must first understand the data
received from the device. To this end signal analysis and signal
filtration have been key to finding usable metrics.
Determining Inertial axis of Device
Determining noise characteristics of signal and which smoothing filters
best remove the noise.
Analysis of device at rest
Analysis of device with known
movement
Creation of device to mimic tremor
The device at times gives erroneous data to that extent it is important to
filter. Filter types used and analyzed
Median filtering
Gaussian filtering
Running Average
Band pass and Low pass Butterworth Filters
Bilateral Filtering
Deciding to look into frequency based analysis.
Looking at different windowing functions for performing the fft
.Performing a running fft to find the maximum frequency in a signal
through out signal
Acknowledgements
The purpose of this study was to create a quantifiable metric to help
understand Parkinson’s Disease progression. Using low cost mems
sensors such as accelerometers and gyroscopes is a reliable method
to measure the characteristics of tremor in patients with Parkinson’s
disease.
Our analysis indicates proper filtering can lead to a more precise
analysis. We also found it may be possible to isolate the tremor
frequency directly and use it as a metric
We looked at many different methods to extract the tremor data the
one that seemed the most useful was a running window fft. Through
this it was possible to isolate the tremor frequencies
Low Cost, Non Invasive Method for
Quantifying Parkinson’s Tremor
Jennifer Nunn1, Farid Farahmand1, Wes Bethel2,
Sonoma State University1,Lawrence Berkeley National Laboratory2
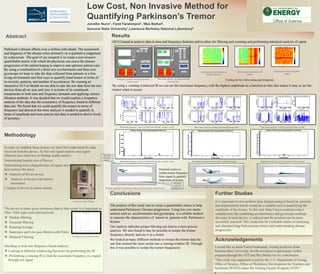
Conclusions
GUI Created to analyze data in time and frequency domains and to allow for filtering and zooming and performing statistical analysis of signal
By using a running windowed fft we can see the maximum frequency with the highest amplitude as a function in time this makes it easy to see the
tremor when it occurs
Results
Time Data analysis on data generated
from test bed.
Frequency analysis on data generated
from test bed.
I would like to thank Farid Farahmand, visiting professor from
Sonoma State University, for the invitation to participate in this
program through the VFP and Wes Bethel for his contribution.
"This work was supported in part by the U.S. Department of Energy,
Office of Science, Office of Workforce Development for Teachers and
Scientists (WDTS) under the Visiting Faculty Program (VFP)."
•
Further Studies
It is important to also perform time domain analysis based on position
and displacement which would be a valuable tool in quantifying the
amplitude of the tremor. To this end Data Fusion could provide a
valuable tool. By combining accelerometer and gyroscope readings
the noise in each device is reduced and the position can be more
accurately assessed. This could also be a valuable metric in assessing
and characterizing Parkinsonian tremor and understanding disease
progression.
Testbed to Create Tremor
Verifying accuracy of fft algorithm
Spectrogram signal data from
healthy volunteer
Spectrogram signal data from
testbed
Spectrogram signal data with
tremor
Testing device data using spectrogram
Maximum frequency from test bed with rotation around x-axis. Time Data analysis on data generated from test bed. Time Data analysis on data generated from test bed.
Maximum frequency from test bed with rotation around x-axis. Maximum frequency from test data with more tremor. Maximum frequency from test data with less tremor
Potential metric to
isolate tremor frequency
from signal to quantify
magnitude of tremor.
Showing
tremor is
around x-axisPlotting amplitude of maximum frequency from rotation around x-axis.
Showing
persistent
tremor
Amplitude of both devices on scatter plot at tremor frequency . .Amplitude of both devices on scatter plot at tremor frequency .