1. A13E-0372: Field deployment and initial results from micro-pulse lidar systems during NASA's DISCOVER AQ campaign
Timothy Berkoff1,10
, Raymond M Hoff1
, Ruben Delgado1
, John Sullivan1
, Andrea Thomas2
, William Lawrence2
, Taylor Jones3
, Phil Decola3
, Savyasachee Mathur3
, Yunhui Zheng3
, Gail Wyant4
, Raymond Blucher4
, Renee Piatt4
,
Mustafa Abderrahman4
, Douglas Martins5
, Ryan Auvil6
, Michael Woodman6
, Rasheen Connell7
, Michael Hicks7
, Demetrius Venable7
, Belay Demoz7
, Maria Tzortziou8,10
, Pasquale De Rosa9
,
Kenneth Pickering10
, David Starr10
, Ellsworth Welton10
, Brent Holben10
, Richard Ferrare11
, Chris Hostetler11
, James Crawford11
1. Univ of Maryland Baltimore Co., Baltimore, MD, United States. 2. Bowie State University, Bowie, MD, United States. 3. Sigma Space, Lanham, MD, United States., 4. Cecil College, Elkton, MD, United States.
5. Pennsylvania State Univ., University Park, PA, United States. 6. Maryland Dept. of the Environment, Baltimore, MD, United States. 7. Howard University, Beltsville, MD, United States. 8. Univ of Maryland, College Park, MD, United States.
9. Cardinal Point Captains llc., Long Beach, CA, United States. 10. NASA -GSFC, Greenbelt, MD, United States. 11. NASA -LARC, Hampton, VA, United States.
Acknowledgments
Micropulse Lidar Sites Example Measurements
Currently, processed MPL data products (HDF5 format) are available in the DISCOVER-AQ archive include the following:
Co-polarized Attenuated Backscatter (AB) in units of km-1
sr-1
, at 30 meter vertical resolution and 1 minute time intervals
Boundary layer height (km) as a function of time determined from wavelet-based analysis of the AB signal
The AB magnitude contains both the backscatter and extinction loss of aerosol and molecular scattering. In the future, Fernald-Klett
inversion could be applied to the data to obtain a layer-average aerosol extinction-to-backscatter ratio, which can be used to generate
aerosol specific data products, similar to what is done by MPLNET. Future data products could include results such as:
Depolarization ratio (cross/co-polarization)
Aerosol Backscatter Coefficient and Extinction
Cloud and layer heights
Statistical uncertainties and absolute error
Data Products
Background
To further improve satellite analysis of surface
pollution and related atmospheric and air
quality forecast models, NASA conducted the
DISCOVER-AQ mission in the Baltimore-
Washington region during July 2011. Data
were collected from a combination of surface
sites and research aircraft to provide a
comprehensive assessment of the conditions
leading up to and during air pollution events.
UMBC participation
The UMBC Monitoring of Atmospheric Pollution
(UMAP) site, located just west of Baltimore, provided a
unique resource to DISCOVER-AQ measurements. This
site is designed to provide a three-dimensional evaluation
of the aerosol pollution environment over Baltimore. By
combining ground based sampling with lidar profile
measurements operating at a number of wavelengths,
provides the ability to understand the radiative aerosol
properties that are seen by satellite sensors passing over
the region.
UMBC calibration & validation
“Real-time” web display
MPL
transceiver
Wide-FOV receiver
MPL system with Wide-FOV receiver
attached to the top of the transceiver
Top view (looking down)
of MPL transceiver with
Wide-FOV receiver
http://discover-aq.larc.nasa.gov/
Sigma Space participation
In addition to the lidars at the UMBC-UMAP site, four
Micro-Pulse Lidars (MPLs) were loaned by Sigma Space
(Lanham, MD) for use during the campaign that were
deployed to various locations in the region. Three of these
systems were the new “MiniMPL” model, a smaller more
portable version of the original MPL. This campaign is the
first use of multiple “MiniMPL” systems simultaneously at
different locations for a regional-scale pollution study of
this type. The Sigma Space MPLs provided elastic optical
backscattering profiles of the atmosphere at 532 nm, and
obtained both the co and cross polarized measurements.
http://alg.umbc.edu/umap/
Photograph of MPL systems manufactured
by Sigma Space. The “MiniMPL” is
shown on the left and the traditional style
MPL is on the right.
http://www.sigmaspace.com/
Site setup photos
In addition to standard UMBC and GSFC MPL sites participating in MPLNET in the region, additional sites (not
part of MPLNET) included four Sigma Space loaned lidars that enabled measurements to obtained from Fairhill,
Edgewood, Essex, and Beltsville locations. One of these systems was deployed on the NOAA research vessel R-
8501 SRVX from July 14-20, to enable atmospheric profiling on the Chesapeake Bay. MPLs operated at 30 meter
vertical and 1 minute time resolutions.
To assist with flight planning and
enable remote monitoring of lidar
performance, a web-link was
provided to campaign participants
that provided near real-time (7
minute update cycle) of the MPL
uncalibrated backscatter signal
levels from the various sites.
Files were remote synchronized
to UMBC where data quick-look
processing was accomplished
using customized software using
Python programming language.
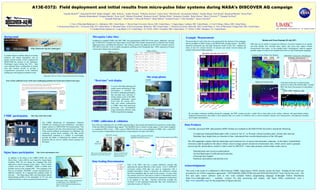
One of the key calibrations for use of MPL generated data is the accurate determination the non-linear overlap shape
of the near-field (low altitude) range signals. The MiniMPLs have a shorter overlap range (1-2 km) when compared
to a traditional MPL (6 km). MPLs used in DISCOVER-AQ were cross-calibrated at UMBC with a wide-FOV
receiver system to independently determine the overlap functions for each of the MPLs.
Each of the MPLs also has a unique calibration constant that
represents the optical efficiency of the system. Level 2 AERONET
co-located column AOD data was used in conjunction with a
standard atmospheric model to determine the calibration constant
from free-troposphere data for each for the systems. In cases where
the constant varied over time (due to window or instrumental issues),
a fitting function was used to determine the appropriate scaling factor
to be applied to the data. Baseline processing included this
correction so that attenuated backscatter data were normalized to
each other in units of 1/(km*sr).
Edgewood Ground Lidar
LARC HSRL Airborne Lidar
smoke
cirrus
cirrus
Smoke and Cirrus Example 20 July 2011
Canadian Smoke Plume Over Region
UMBC smog blog/NOAA HYSPLIT/NOAA HMS
AERONET Column Size Distribution
smoke
Processed data for each of the sites were generated for the duration of the campaign,
and are available in HDF5 format in the DISCOVER-AQ data archive. The MPLs
operated continuously day and night during the month of July 2011, enabling the
study of how the vertical structure of aerosols and clouds evolved during and
outside of the aircraft flight segments.
MPL data can be useful to examine the influence of aerosol transport on air quality
and help identify how elevated layers and/or thin cirrus may impact column
measurements from space. In the example below, backtrajectory analysis suggests
possible impact of smoke from Canadian forest fires on July 20 during the campaign.
Lidar data on this day revealed elevated
aerosol at or above the airborne lidar. Ground
MPL also shows the presence of intermittent
cirrus.
By providing continuous profiling during the campaign, the MPL systems provide a useful link to help relate in-situ surface, airborne, and space-based column-
integrated measurements, and enable a more detailed study of a variety of conditions such as aerosol transport, diurnal cycle characteristics, and planetary boundary
layer heights and dynamics.
This work is the result of a collaborative effort between UMBC, Sigma Space, NASA, and the various site hosts. Funding for this work was
provided by two NASA cooperative agreements: NNX10AR38G (DISCOVER-AQ) and NNX10AT36A(JCET Task 336) for this work. The
free and open source software used in this work included Python programming language (Enthought Python Distribution
(http://www.enthought.com/) – academic version) for data processing and display, and Open Office productivity suite (
http://www.openoffice.org/) for the preparation of figures and text.
Data Scaling Determination
Example profile comparison between
MiniMPL and WFOV receiver Prelim. Overlap shapes for the MPLs
Fairhill
Essex
NOAA ship
Table of Sites
MPL locations
P3 aircraft King Air
Flight paths of the two NASA research aircraft during the campaign
Near-surface pollution is one of the most challenging problems for Earth observations from space
Range, km
WFOV signal
MiniMPL
signal