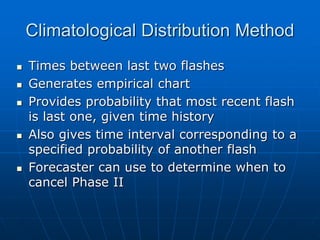
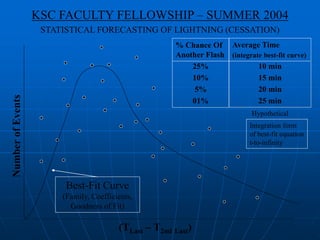
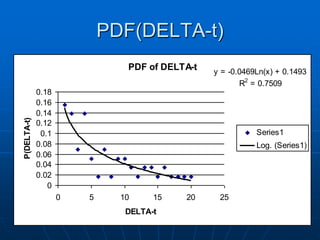
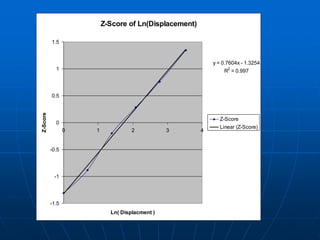
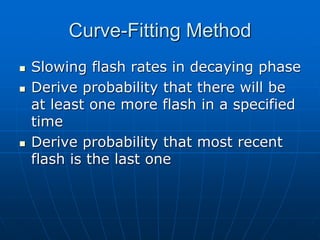
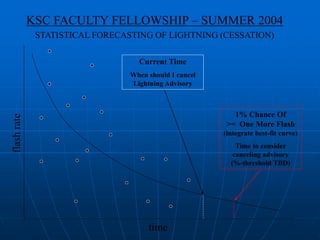
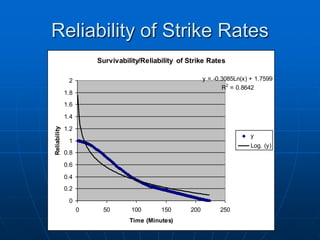
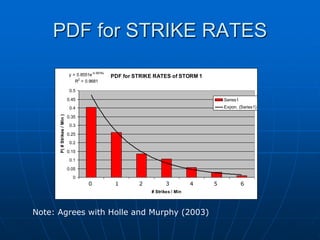
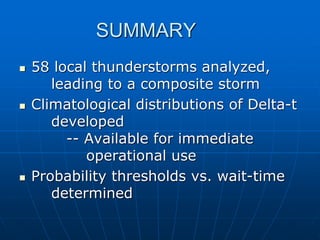
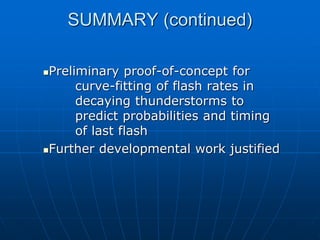
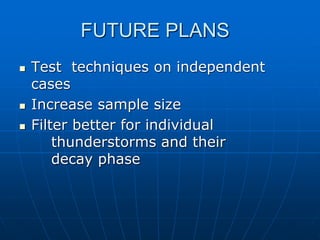
The document describes a project to develop statistical models for forecasting lightning cessation in thunderstorms. It aims to analyze lightning flash rates over time in decaying storms to estimate the probability of additional flashes and determine optimal times to cancel lightning advisories. The project involved analyzing 58 storms and developing climatological distributions and curve fits of flash rates. Preliminary results provided probability thresholds and wait times that could guide decisions on when to end advisories. Further work was proposed to refine the models and develop software to apply the statistical techniques in operations.


![==============================================================================
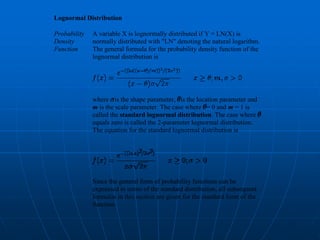
MATRIX OF RELIABILITIES WITH CORRESPONDING TIMES AND MEAN TIMES TO FAILURE
R(t) = 1 - F(t) = P( T > t ) for the random variable T ,
where T is the time to failure (or storm cessation)
( NOTE: TMIN <====> Total # Elapsed Minutes per Event )
( Cancel after t minutes to be [100-R(t)] % certain of no more strikes.)
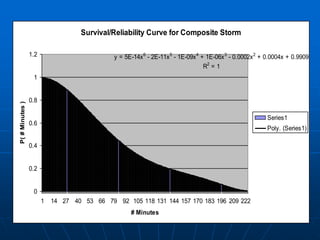
[*] <====> The Composite Storm
==============================================================================
------- ---- ---- ---- ---- ---- ---- ---- ---- ---- ---- ----
R(t) --> 50 % 45 % 40 % 30 % 20 % 15 % 10 % 5 % 3 % 1 % TMIN
------- ---- ---- ---- ---- ---- ---- ---- ---- ---- ---- ----
EVENT # TIME t TO FAILURE for each R(t)
------- ---- ---- ---- ---- ---- ---- ---- ---- ---- ---- ----
1 ). 40 44 48 55 64 76 83 88 89 93 --> 98
2 ). 52 56 61 97 127 145 199 237 246 249 --> 260
3 ). 104 107 110 114 120 124 130 148 155 164 --> 208
4 ). 35 38 40 44 48 51 59 61 63 65 --> 65
. . . . .
. . . . .
. . . . .
57 ). 112 119 122 130 140 146 246 256 259 270 --> 303
58 ). 40 44 48 55 64 76 83 88 89 93 --> 98
59 ).[*] 75 82 89 108 139 160 179 199 205 215 --> 219
------- ---- ---- ---- ---- ---- ---- ---- ---- ---- ---- ----
MEAN t --> 65 68 71 77 84 90 99 109 113 125 --> 141
------- ---- ---- ---- ---- ---- ---- ---- ---- ---- ---- ----
StdDev --> 43 44 44 46 47 47 54 55 55 77
------- ---- ---- ---- ---- ---- ---- ---- ---- ---- ---- ----
Mean Duration of Storms = mu = 139 Minutes
Mean Total Number of Strikes per Storm = 339 Strikes](https://image.slidesharecdn.com/presentation3-191116072001/85/Statistical-Forecasting-of-Lightning-Cessation-_-PPT-Presentation-19-320.jpg)


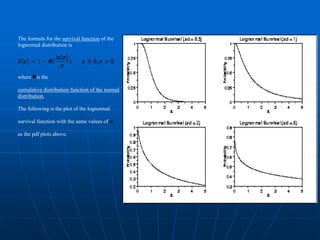
![Software Developed (continued)
======================== PROGRAM F-STAR ========================
F-STAR READS A SEQUENCE OF PMAX STORM EVENTS CONSISTING OF Q0
VARYING LIGHTNING STRIKE RATES AS A FUNCTION OF TIME t IN UNIT
INCREMENTS OF MINUTES AND FILTERS THOSE STORMS FROM THE SEQUENCE
FOR WHICH TM LIES IN THE DESIRED INTERVAL [ T1,T2 ] AND
CS LIES IN THE DESIRED INTERVAL [ CS1,CS2 ] , WHERE TM
IS THE TOTAL DURATION OF EACH STORM (IN MINUTES) AND CS
IS THE CUMULATIVE NUMBER OF STRIKES OF EACH STORM. FILTERED
STORMS ARE PRINTED IN F-STAR.OT2 WITH HEADERS FOR FURTHER
ANALYSIS.
==================================================================](https://image.slidesharecdn.com/presentation3-191116072001/85/Statistical-Forecasting-of-Lightning-Cessation-_-PPT-Presentation-29-320.jpg)