1. CHARACTERIZING THE PROPERTIES OF 3-D
PRINTED PLASTIC SCINTILLATORS
INTRODUCTION TRANSMISSION SPECTRUM LIGHT OUTPUT
We are determining various characteristics and aspects of the performance of 3-D
printed scintillators. A scintillator becomes excited and glows when an energetic particle
raises electrons to an excited state by depositing some of its energy in the atom. When
these excited electrons fall back down to their stable states, they emit the excess energy in
the form of light. We use an Asiga Pico 3-D printer for making the 3-D printed scintillators.
The Asiga 3-D printer implements a process of UV curing. This process allows layers to
polymerize together, allowing for transparency in our 3-D printed scintillators. The
transparency is necessary when creating scintillating material, since the light must be able
to escape the material to be detected by PMT’s. Because of the transparency, the UV
curing process is preferred over the traditional filament printing methods. Scintillator
material has two chemicals that are added to the resin:
• Scintillating chemical, POP; part of resin that luminesces when exposed to energetic
particles
• Wavelength shifting chemical, POPOP; shifts light produced by luminescence of POP
up to ~410 nm
• A tungsten-halogen lamp is used as the light source for measuring the
transmission spectrum
• Transmission spectrum is important because it may influence the light output of
the 3-D printed scintillators. If a scintillator has a very low transmissivity, the
photomultiplier may not be measuring the actual light output of the scintillation
chemical because there is internal absorption occurring within the scintillator
material.
Given in the graph below are the transmission spectra of air, a 3-D printed
scintillator, and a commercial
Many sources of uncertainty/error:
• Efficiency of tungsten halogen lamp, sensitivity of photodiode
• Range is constrained by optical elements; focusing lenses and internal elements
of the monochromator
• Monochromator is not vacuum tight
In order to try to correct for some of these errors, we measure the transmissivity
of air and the scintillator and take the ratio. Furthermore, we restrict our
measurements to the range 400-700 nm.
By taking ratios, we hope to minimize influence from the sources of error present
in the data. From data we can see that:
• The transmission ratio starts falling off from 500 nm and lower for the 3-D printed
scintillator, while the transmission ratio for the commercial scintillator begins falling
off from around 450 nm and lower.
• Measured transmission of 3-D printed scintillator seems to be zero for wavelength
<460 nm.
• The transmission ratio for the 3-D printed scintillator is a fraction of the
transmission ratio for the commercial scintillator. This just means that a larger
fraction of light produced by the luminescence of the scintillator material will be
internally absorbed. This information will be useful in analyzing data collected
regarding the light output of the 3-D printed scintillators.
The light output of the scintillators is measured using a Photo Multiplier Tube, a black box,
QDC, and a Co-60 source. A Photo Multiplier Tube (PMT) detects incoming photons and
amplifies the signal so that it is in a measureable range; mV usually. Because a PMT is so
sensitive to light, we must be very careful not to expose the PMT to ambient light; this could
damage/destroy the PMT. To prevent this, we place the PMT in a dark box, whose sole
purpose is to prevent light from leaking into the PMT. Data acquisition schematic given below.
We start by collecting data for a commercial scintillator, as well as a 3-D printed
scintillator. By comparing the two types of scintillators, we can get a rough idea of the
performance of the 3-D printed scintillator relative to a commercial scintillator. The graph of
the charge distribution for the commercial and 3-D scintillator is given below.
Looking at the graph, we can see what looks like two peaks that are denoted by arrows.
The Co-60 that we are using decays into beta particles. However, this decay also yields
photons of two distinct energies. It seems as though the two peaks correspond to these two
photon energies. If this is true, then we will be able to relate graphs by comparing the position
of these two peaks. We look for those two peaks in the graph of the charge distribution for the
3-D printed scintillator below. This data has a 6x amplification. From the graph, we can guess
that the two peaks are somewhere near the arrows. If this is true, we are able to relate the two
graphs. Since the midpoint of the two peaks is around 1500 for the 3-D printed scintillator with
a 6x amplification and around 3500 for the commercial scintillator, we naively say that the 3-D
printer is around 10% as efficient in its light output as the commercial scintillator. This very low
light output may be due to the poor transmissivity of the 3-D printed scintillator at 500 and
lower. This may be a problem, since the PMT that we are using has its peak sensitivity at
around 425 nm.
Author: Jacob McCormick
FUTURE WORK
In the future, we hope to take more transmission and light output measurements for all of
the scintillators that we make. We also hope to begin characterizing the physical properties of
the scintillators, as well as looking at other optical properties, such as the emission spectrum.
The next step is to try an eliminate sources of error in the transmission spectrum measuring
apparatus. Finally, it would be nice to be able to try and start manipulating the recipes for the
resin to optimize the light output of the scintillators.
Acknowledgements:
• I would like to thank my advisor, Professor Wouter Deconinck, for his advice and guidance
in this research
• Thanks to Karen Ficenec for printing all of the scintillators, as well as providing a
background for the functioning of the scintillators
• This work was supported in part by the National Science Foundation under Grant Nos.
PHY-1206053, 1359364 and 1405857
• Thanks to Professor David Armstrong for advice and suggestions regarding analysis of data
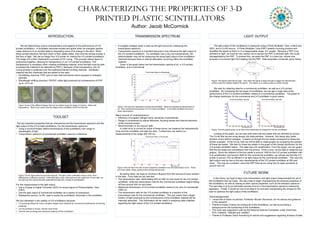
Figure: Some of the different shapes that can be printed using the Asiga 3-D printer. Notice the
transparency. Most of our prints have the shape of the scintillator fourth from the left.
The two important properties that we characterize are the transmission spectrum and the
light output of the 3-D printed scintillators. For the transmission spectrum:
• Using a monochromator define transmissivity of the scintillators over range of
wavelengths of light
• Transmission spectrum of commercial scintillator used as a reference
For the measurement of the light output:
• Use a Charge to Digital Converter (QDC) to record signal on Photomultiplier Tube
(PMT)
• Use the light output of commercial scintillator as a means of comparison
• Radioactive source, Co-60, used to excite the scintillation chemicals in the scintillator
We are interested in the viability of 3-D scintillators because:
• 3-D printing allows for more complex shapes than allowed by commercial subtractive machining
methods
• Can be printed in-house; shorter wait times
• Control over printing and chemical makeup of the scintillator
TOOLSET
Figure: On left, light enters through the input slit. The light is then collimated using a mirror, then
diffracted by a diffraction grating. Collimated light is then refocused onto the output slit. On the right, we
can see how the monochromator separates the light into a range of wavelengths.
Figure: The blue line represents commercial scintillator. Black line represents transmission of
air. Red represents transmission of 3-D printed scintillator. 3-D printed scintillator has much
lower transmission.
Transmission Ratio vs Wavelength
Figure: Here we have the ratio of each respective scintillator over the transmission of air. There
are a few outlier values, general trend of data still persists.
Figure: The signal continues through. Only when the signal is large enough to trigger the discriminator
window does the Digitizer digitize the signal. This allows us to select pulses of certain charge.
Figure: The two graphs gives us an idea of the distribution of charges for the two scintillators.