Recommended

Recommended
More Related Content
Similar to JLL Indianapolis Chart of the Week
Similar to JLL Indianapolis Chart of the Week (18)
More from JLLindianapolisresearch
More from JLLindianapolisresearch (10)
Recently uploaded
Recently uploaded (20)
JLL Indianapolis Chart of the Week
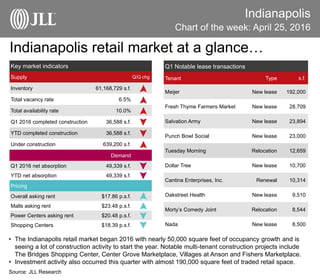
- 1. Indianapolis Chart of the week: April 25, 2016 Source: JLL Research • The Indianapolis retail market began 2016 with nearly 50,000 square feet of occupancy growth and is seeing a lot of construction activity to start the year. Notable multi-tenant construction projects include The Bridges Shopping Center, Center Grove Marketplace, Villages at Anson and Fishers Marketplace. • Investment activity also occurred this quarter with almost 190,000 square feet of traded retail space. Indianapolis retail market at a glance… Key market indicators Supply Q/Q chg Inventory 61,168,729 s.f. Total vacancy rate 6.5% Total availability rate 10.0% Q1 2016 completed construction 36,588 s.f. YTD completed construction 36,588 s.f. Under construction 639,200 s.f. Demand Q1 2016 net absorption 49,339 s.f. YTD net absorption 49,339 s.f. Pricing Overall asking rent $17.86 p.s.f. Malls asking rent $23.48 p.s.f. Power Centers asking rent $20.48 p.s.f. Shopping Centers $18.39 p.s.f. Q1 Notable lease transactions Tenant Type s.f. Meijer New lease 192,000 Fresh Thyme Farmers Market New lease 28,709 Salvation Army New lease 23,894 Punch Bowl Social New lease 23,000 Tuesday Morning Relocation 12,659 Dollar Tree New lease 10,700 Cantina Enterprises, Inc. Renewal 10,314 Oakstreet Health New lease 9,510 Morty’s Comedy Joint Relocation 8,544 Nada New lease 8,500