1. Labor statistics trending in a healthy direction
0.0%
2.0%
4.0%
6.0%
8.0%
10.0%
12.0%
14.0%
16.0%
18.0%
1,600,000
1,650,000
1,700,000
1,750,000
1,800,000
1,850,000
1,900,000
1,950,000
2,000,000
2008 2010 2012 2014
Detroit
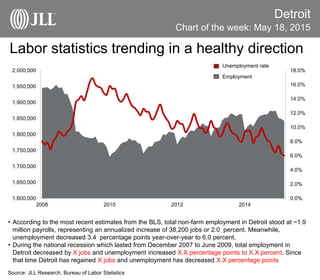
• According to the most recent estimates from the BLS, total non-farm employment in Detroit stood at ~1.9
million payrolls, representing an annualized increase of 38,200 jobs or 2.0 percent. Meanwhile,
unemployment decreased 3.4 percentage points year-over-year to 6.0 percent.
• During the national recession which lasted from December 2007 to June 2009, total employment in
Detroit decreased by X jobs and unemployment increased X.X percentage points to X.X percent. Since
that time Detroit has regained X jobs and unemployment has decreased X.X percentage points
Source: JLL Research, Bureau of Labor Statistics
Chart of the week: May 18, 2015
Employment
Unemployment rate