Download to read offline

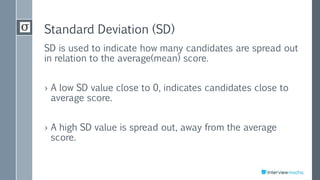
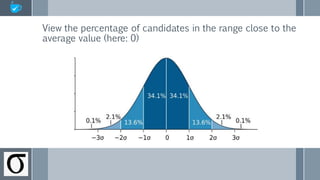
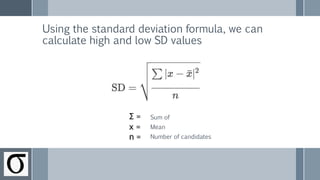
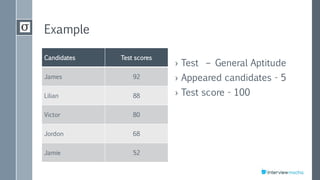
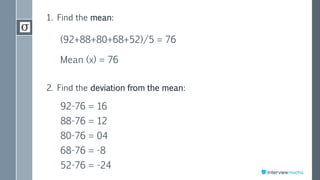
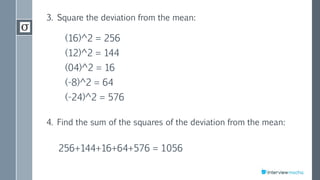
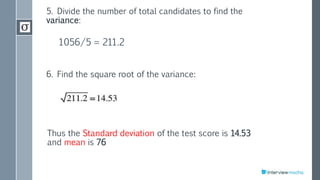
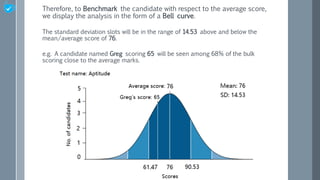


The document discusses using score distribution analysis to help recruiters quickly evaluate how well candidates fit a role. It describes calculating the mean, standard deviation, and bell curve of scores to analyze where candidates fall relative to the average. A low standard deviation means scores are close to the average, while a high value means more variation. An example calculates the mean of 76 and standard deviation of 14.53 for 5 candidates' test scores to benchmark them against the average.