Buy Hindustan Zinc; later part of the year to be stronger due to potential global zinc deficit
•
0 likes•300 views

Buy Hindustan Zinc; later part of year to be stronger due to potential zinc deficit #BrokerAdvice http://goo.gl/KWpgxt

Recommended
More Related Content
What's hot
What's hot (20)
Similar to Buy Hindustan Zinc; later part of the year to be stronger due to potential global zinc deficit
Similar to Buy Hindustan Zinc; later part of the year to be stronger due to potential global zinc deficit (20)
More from IndiaNotes.com
More from IndiaNotes.com (20)
Recently uploaded
Recently uploaded (20)
Buy Hindustan Zinc; later part of the year to be stronger due to potential global zinc deficit
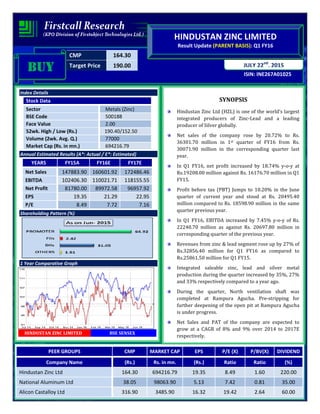
- 1. CMP 164.30 Target Price 190.00 ISIN: INE267A01025 JULY 22nd , 2015 HINDUSTAN ZINC LIMITED Result Update (PARENT BASIS): Q1 FY16 BUYBUYBUYBUY Index Details Stock Data Sector Metals (Zinc) BSE Code 500188 Face Value 2.00 52wk. High / Low (Rs.) 190.40/152.50 Volume (2wk. Avg. Q.) 77000 Market Cap (Rs. in mn.) 694216.79 Annual Estimated Results (A*: Actual / E*: Estimated) YEARS FY15A FY16E FY17E Net Sales 147883.90 160601.92 172486.46 EBITDA 102406.30 110021.71 118155.55 Net Profit 81780.00 89972.58 96957.92 EPS 19.35 21.29 22.95 P/E 8.49 7.72 7.16 Shareholding Pattern (%) 1 Year Comparative Graph HINDUSTAN ZINC LIMITED BSE SENSEX SYNOPSIS Hindustan Zinc Ltd (HZL) is one of the world’s largest integrated producers of Zinc-Lead and a leading producer of Silver globally. Net sales of the company rose by 20.72% to Rs. 36301.70 million in 1st quarter of FY16 from Rs. 30071.90 million in the corresponding quarter last year. In Q1 FY16, net profit increased by 18.74% y-o-y at Rs.19208.00 million against Rs. 16176.70 million in Q1 FY15. Profit before tax (PBT) Jumps to 10.20% in the June quarter of current year and stood at Rs. 20495.40 million compared to Rs. 18598.90 million in the same quarter previous year. In Q1 FY16, EBITDA increased by 7.45% y-o-y of Rs. 22240.70 million as against Rs. 20697.80 million in corresponding quarter of the previous year. Revenues from zinc & lead segment rose up by 27% of Rs.32856.40 million for Q1 FY16 as compared to Rs.25861.50 million for Q1 FY15. Integrated saleable zinc, lead and silver metal production during the quarter increased by 35%, 27% and 33% respectively compared to a year ago. During the quarter, North ventilation shaft was completed at Rampura Agucha. Pre-stripping for further deepening of the open pit at Rampura Agucha is under progress. Net Sales and PAT of the company are expected to grow at a CAGR of 8% and 9% over 2014 to 2017E respectively. PEER GROUPS CMP MARKET CAP EPS P/E (X) P/BV(X) DIVIDEND Company Name (Rs.) Rs. in mn. (Rs.) Ratio Ratio (%) Hindustan Zinc Ltd 164.30 694216.79 19.35 8.49 1.60 220.00 National Aluminum Ltd 38.05 98063.90 5.13 7.42 0.81 35.00 Alicon Castalloy Ltd 316.90 3485.90 16.32 19.42 2.64 60.00
- 2. QUARTERLY HIGHLIGHTS (PARENT BASIS) Results updates- Q1 FY16, Hindustan Zinc Ltd. is the world’s largest integrated producer of Zinc-Lead. It has a metal production capacity of over 1.0 million MT per annum, has reported its financial results for the quarter ended 30th June, 2015. The company has registered its net sales of Rs. 36301.70 million for the 1st quarter of the financial year 2016 as against Rs. 30071.90 million in the corresponding quarter of the previous year. The increase was driven by higher zinc volumes & LME prices and rupee depreciation. This was partly offset by lower prices & volumes of silver and lead as also lower zinc premium. The company has reported an EBITDA of Rs. 22240.70 million, an increase of 7.45% y-o-y against Rs. 20697.80 million in corresponding quarter of the previous year, due to higher revenues and lower cost of production, partly offset by one-time expense related to renewable energy purchase obligation for earlier years, In Q1 FY16, net profit grown by 18.74% y-o-y of Rs. 19208.00 million against Rs. 16176.70 million in Q1 FY15. This has driven by higher operating profit, partly offset by lower investment income due to mark to market losses on a small portion of the portfolio, which is expected to get recovered in the coming quarters. The company has registered an EPS of Rs. 4.55 for the June quarter of current financial year as against an EPS of Rs. 3.83 in the corresponding quarter of the previous year. Break up of Expenditure: During the quarter, Total expenditure rose up by 15 per cent, mainly on account of Employee Benefit Expenses by 17%, Mining Royalty 217%, Other Mining & Manufacturing Expenses 25% and Power & fuel 136% are the main attribute for the increase of Expenditure when compared to corresponding quarter of the previous year. Total expenditure in Q1 FY16 stood to Rs. 21427.40 million as against Rs. 18570.70 million in Q1 FY15. Rs. in million Jun-15 Jun-14 % Change Net Sales 36301.70 30071.90 20.72 PAT 19208.00 16176.70 18.74 EPS 4.55 3.83 18.74 EBITDA 22240.70 20697.80 7.45 Particulars Rs. Millions Q1 FY16 Q1 FY15 Cost of Material Consumed 411.30 1498.90 Other Expenditure 1344.20 1288.00 Power & Fuel 5369.20 2276.40 Depreciation & Amortization Expense 1729.20 2022.90 Employee Benefit Expenses 1900.20 1617.40 Consumption of Stores & Spare Parts 2499.00 2962.00 Other Mining & Manufacturing Exp 4578.40 3665.40 Mining Royalty 6290.80 1986.80
- 3. Segment Revenue Latest Updates • Total Income is Rs. 41938.90 million for the quarter ended June 30, 2015 where as the same was at Rs. 37245.60 million for the quarter ended June 30, 2014. Operational Performance during the 1st Quarter of FY 2015-16. • Mined metal production increased by 42% at 232,162 MT during the quarter, as compared with 163,131 MT a year ago. The increase was driven primarily by higher ore production from Rampura Agucha, Kayad and Sindesar Khurd mines. • Integrated saleable zinc, lead and silver metal production during the quarter increased by 35%, 27% and 33% respectively compared to a year ago. • The zinc metal cost of production before royalty during the quarter was Rs. 50955 ($802), which is lower by 19% in USD term from a year ago., due to higher volumes and lower commodity prices, partly offset by higher Power & Fuel cost on account of water cess & electricity duty and renewable energy purchase obligation on captive power consumption which had an impact of $48 per MT on COP. Expansion Projects • During the quarter, North ventilation shaft was completed at Rampura Agucha. Pre-stripping for further deepening of the open pit at Rampura Agucha is under progress. • Kayad mine ramp up is on track and expected to achieve 1 million MT production capacity by yearend.
- 4. Sales Performance in Product wise COMPANY PROFILE Hindustan Zinc Ltd is the one of the largest integrated producers of zinc-lead with a capacity of 1.0 million MT per annum and a leading producer of silver. The Company is headquartered in Udaipur, Rajasthan in India and has zinc-lead mines at Rampura Agucha, Sindesar Khurd, Rajpura Dariba, Zawar and Kayad; primary smelter operations at Chanderiya, Dariba and Debari, all in the state of Rajasthan; and finished product facilities in the state of Uttarakhand. Hindustan Zinc is a subsidiary of the BSE, NSE and NYSE listed Sesa Sterlite Limited, a part of London listed FTSE 100 diversified metals and mining major, Vedanta Resources plc. Hindustan Zinc has a world-class resource base with total reserves & resources of 375.1 million MT and average zinc-lead reserve grade of 11.5%. The Company has a track record of consistently growing its reserves & resource base since 2003 and currently has a mine life of over 25 years. Business Activities HZL core business comprises of mining and smelting of zinc and lead along with captive power generation. It manufacturers three qualities of zinc -- special high grade zinc used in construction, infrastructure, household appliances etc; high grade zinc and prime western zinc. HZL manufactures 99.99% pure lead used in lead acid battery, ceramic glazes, electrodes, etc. It manufactures silver used in photographic material, conducter, jewellery, etc. The mineral major produces cadmium, whose purity ranges from 99.95-99.99%. It is used in Ni-Cd batteries, stablizers, coating and alloys. HZL also manufactures sulphuric acid used in fertilizers, dyes, textiles, sugar refining, etc. The Company is self-sufficient in power with an installed base of 474 MW coal-based captive power plants. Additionally, it has green power capacity of 309 MW including 274 MW of wind power and 35 MW of waste heat power. The company has an operating workforce of over 18,000 including contract workforce. Products Rs. (in millions) Q1 FY16 Q1 FY15 CHNG % Zinc 27870.00 20570.00 35% Lead 4110.00 4520.00 -9% Silver 2590.00 3180.00 -19% Others 1390.00 1360.00 2% Total 35960.00 29630.00 21%
- 5. The worlds largest integrated Zinc-Lead producer; it is and one of the lowest cost producers in the world. Hindustan is also one of the leading Silver producers globally. It has mining, smelting and power operations in multiple locations throughout India. The principal products are: refined Zinc metal and refined Lead metal. In addition it recovers Silver, Cadmium and Sulphuric acid. Products India's largest and the world's second largest integrated zinc-lead producer; and also one of the lowest cost zinc- lead producers in the world. We have mining, smelting and power operations in multiple locations throughout India ZINC • Galvanizing • Zinc Oxide • Die Casting • Alloys • Rolled Zinc Silver o Silverware o Jewellery o Silver plating o Photography o Dentol alloys Lead o SLI ( Starting Lighting Ignition) batteries o Industrial batteries Cadmium
- 6. FINANCIAL HIGHLIGHT (PARENT BASIS) (A*- Actual, E* -Estimations & Rs. In Millions) Balance Sheet as at 31st March, 2014 -2017E FY-14A FY-15A FY-16E FY-17E I EQUITY AND LIABILITY A) Shareholder's Funds a) Share Capital 8450.60 8450.60 8450.60 8450.60 b) Reserves and Surplus 365725.50 425080.10 483741.15 543725.06 Sub-Total Net worth 374176.10 433530.70 492191.75 552175.66 B) Non Current Liabilities a) Deferred Tax Liabilities 16581.10 25186.20 31835.36 36610.66 b) Other Long term liabilities 563.70 1320.80 1827.99 2412.94 Sub-Total Non Current Liabilities 17144.80 26507.00 33663.34 39023.60 C) Current Liabilities a) Trade payables 5103.20 6307.90 7657.79 8921.33 b) Other Current Liabilities 10184.80 10459.10 11023.89 11751.47 c) Short term Provisions 10157.80 13115.30 16262.97 18702.42 Sub-Total Current Liabilities 25445.80 29882.30 34944.65 39375.22 TOTAL EQUITY AND LIABILITIES (A + B + C) 416766.70 489920.00 560799.75 630574.48 II APPLICATION OF FUNDS D) Non-Current Assets i. Tangible assets 90234.30 93290.50 95156.31 96107.87 ii. Intangible assets 1238.20 1171.20 1206.34 1230.46 iii. Capital Work in Progress 15409.40 20047.10 24357.23 28741.53 a) Sub- Total Fixed Assets 106881.90 114508.80 120719.87 126079.86 b) Non-current investments 28.10 0.00 0.00 0.00 c) Long Term loans and advances 29393.60 43373.20 58987.55 73734.44 Sub-Total Non-Current Assets 136303.60 157882.00 179707.42 199814.30 E) Current Assets a) Current Investment 225035.80 272535.90 312714.74 353490.57 b) Inventories 11982.40 12117.50 12650.67 13030.19 c) Trade receivables 3995.10 6588.20 9421.13 12247.46 d) Cash and Bank Balances 30314.20 35315.10 40400.47 45652.54 e) Short-terms loans & advances 3349.30 3641.40 3910.86 4145.52 f) Other current assets 5786.30 1839.90 1994.45 2193.90 Sub-Total Current Assets 280463.10 332038.00 381092.33 430760.18 TOTAL ASSETS ( D+E ) 416766.70 489920.00 560799.75 630574.48
- 7. Annual Profit & Loss Statement for the period of 2014 to 2017E Value(Rs.in.mn) FY14A FY15A FY16E FY17E Description 12m 12m 12m 12m Net Sales 136360.40 147883.90 160601.92 172486.46 Other Income 18993.90 28210.50 30523.76 33637.18 Total Income 155354.30 176094.40 191125.68 206123.64 Expenditure -66745.20 -73688.10 -81103.97 -87968.09 Operating Profit 88609.10 102406.30 110021.71 118155.55 Interest -449.40 -235.10 -246.86 -253.27 Gross profit 88159.70 102171.20 109774.85 117902.28 Depreciation -7845.90 -6441.90 -6119.81 -6456.39 Exceptional Items -616.70 -28.10 0.00 0.00 Profit Before Tax 79697.10 95701.20 103655.05 111445.88 Tax -10650.90 -13921.20 -13682.47 -14487.96 Net Profit 69046.20 81780.00 89972.58 96957.92 Equity capital 8450.60 8450.60 8450.60 8450.60 Reserves 365725.50 425080.10 483741.15 543725.06 Face value 2.00 2.00 2.00 2.00 EPS 16.34 19.35 21.29 22.95 Quarterly Profit & Loss Statement for the period of 31 DEC, 2014 to 30 SEP, 2015E Value(Rs.in.mn) 31-Dec-14 31-Mar-15 30-Jun-15 30-Sep-15E Description 3m 3m 3m 3m Net sales 38531.40 41256.80 36301.70 40440.09 Other income 8121.50 5948.80 5637.20 6595.52 Total Income 46652.90 47205.60 41938.90 47035.62 Expenditure -17639.40 -21472.60 -19698.20 -20017.85 Operating profit 29013.50 25733.00 22240.70 27017.77 Interest -7.90 -138.10 -16.10 -7.73 Gross profit 29005.60 25594.90 22224.60 27010.04 Depreciation -2090.10 -268.00 -1729.20 -1746.49 Profit Before Tax 26915.50 25326.90 20495.40 25263.55 Tax -3121.80 -5352.50 -1287.40 -3233.73 Net Profit 23793.70 19974.40 19208.00 22029.82 Equity capital 8450.60 8450.60 8450.60 8450.60 Face value 2.00 2.00 2.00 2.00 EPS 5.63 4.73 4.55 5.21
- 8. Ratio Analysis Particulars FY14A FY15A FY16E FY17E EPS (Rs.) 16.34 19.35 21.29 22.95 EBITDA Margin (%) 64.98% 69.25% 68.51% 68.50% PBT Margin (%) 58.45% 64.71% 64.54% 64.61% PAT Margin (%) 50.64% 55.30% 56.02% 56.21% P/E Ratio (x) 10.05 8.49 7.72 7.16 ROE (%) 18.45% 18.86% 18.28% 17.56% ROCE (%) 25.78% 25.11% 23.60% 22.57% EV/EBITDA (x) 4.95 3.77 3.10 2.50 Book Value (Rs.) 88.56 102.60 116.49 130.68 P/BV 1.86 1.60 1.41 1.26 Charts
- 9. OUTLOOK AND CONCLUSION At the current market price of Rs. 164.30, the stock P/E ratio is at 7.72 x FY16E and 7.16 x FY17E respectively. Earning per share (EPS) of the company for the earnings for FY16E and FY17E is seen at Rs.21.29 and Rs.22.95 respectively. Net Sales and PAT of the company are expected to grow at a CAGR of 8% and 9% over 2014 to 2017E respectively. On the basis of EV/EBITDA, the stock trades at 3.10 x for FY16E and 2.50 x for FY17E. Price to Book Value of the stock is expected to be at 1.41 x and 1.26 x respectively for FY16E and FY17E. The company anticipates later part of the year to be stronger on expectation of global zinc deficit due to mine closures. Indian manufacturing sector is showing signs of recovery with improved order books and flow of funds backed by Government initiatives, thus providing a positive outlook for the industry.” We recommend ‘BUY’ in this particular scrip with a target price of Rs.190.00 for Medium to Long term investment. INDUSTRY OVERVIEW Zinc Global zinc demand witnessed a 4.3% growth in 2014 against the previous year growth of 3.8%, an indication that zinc continues to have positive fundamentals despite the lingering pressure on commodity market. Refined zinc production growth declined from 3.9% last year to 3.3% in 2014. The deficit of 516 kt in 2014 is an indication of the widening gap between the global zinc demand and its supply, although it has fallen short of the 700 kt gap estimated at the beginning of the year. This was primarily due to Chinese smelters operating at higher utilization rates on the back of improved metal prices and higher treatment charges. China's export figures peaked in 2014, driven by the local price arbitrage as well as weak demand in China, although it remained a net importer of zinc by 440 kt, lowest since 2010. With adequate availability of concentrate in 2015 and the potential to increase production further, China's zinc smelting output continues to be one of the key uncertainty factors surrounding the zinc market. Demand growth would create the need for 4 million MT a year of new zinc production by 2020. Even if the entire population of currently identified probable projects were built, it would only replace 2.2 million MT of the requirement, at an estimated cost of $8 billion. The outlook for Indian steel and zinc market in FY 2016 remains positive and expect CAGR of around 6% in zinc demand in the coming years. The 'Make in India' programme of the government and its supporting policies is expected to provide immense potential to the Indian metal market. The government envisions 300 million MT of steel capacity for the country by 2025, against the current capacity of about 100 million MT. In the recently announced union budget, the government has placed thrust on infrastructure projects such as upgradation of
- 10. railway stations, new airports and road projects, developing 100 smart cities, rural electrification projects and investment in transmission corridors etc., which will further boost the country's zinc demand. Lead For several years, lead supply has been exceeding demand. During 2014, the market moved back into deficit, although only marginally by 48 kt. Global lead demand witnessed a growth of 3.7% over last year while the primary refined lead production growth was higher at 4.9%. Total global lead supply witnessed a slower growth rate of 2.2% due to flat secondary production. Despite reductions in Peruvian and US output, influenced by the closure of operations at La Oroya in June 2014 and Herculaneum in December 2013 respectively, global output of refined lead metal increased principally due to higher production in China, India, Italy, Kazakhstan and the Republic of Korea. China's e-bike is a major market for lead consumption, which is levelling off to market saturation and witnessed reduced growth for the second consecutive year. The overall trend in 2015 for global lead market is likely to be marginally bullish with an estimated demand growth rate of 4%. The coming years are promising for Indian automobile industry amid falling fuel prices and interest rates as well as government stimulus for foreign investments. India is expected to be among the world's top four auto producers by FY 2016 which will lead to a surge in lead consumption in the country. Silver Global silver mine production witnessed a growth of about 3.5% in 2014 while the physical demand declined by 6.7%. Despite the downtrend, the year ahead appears positive and is expected to register a growth of 1.4%. From watch batteries to massive solar energy systems, the special properties of silver are often indispensable in industrial applications, including silver coated bearings, catalysts, medical care and many products in our daily lives. Along with technological improvements, more and more applications of silver have been developed and commercialised. In the Indian context, the metal is primarily used in jewellery and for investments. Global industrial demand for silver is expected to grow by 27% in the next four years and the demand of silver in the subcontinent is expected to regain its lustre. Disclaimer: This document is prepared by our research analysts and it does not constitute an offer or solicitation for the purchase or sale of any financial instrument or as an official confirmation of any transaction. The information contained herein is from publicly available data or other sources believed to be reliable but we do not represent that it is accurate or complete and it should not be relied on as such. Firstcall Research or any of its affiliates shall not be in any way responsible for any loss or damage that may arise to any person from any inadvertent error in the information contained in this report. Firstcall Research and/ or its affiliates and/or employees will not be liable for the recipients’ investment decision based on this document.
- 11. Firstcall India Equity Research: Email – info@firstobjectindia.com C.V.S.L.Kameswari Pharma & Diversified U. Janaki Rao Capital Goods B. Anil Kumar Auto, IT & FMCG M. Vinayak Rao Diversified G. Amarender Diversified Firstcall Research Provides Industry Research on all the Sectors and Equity Research on Major Companies forming part of Listed and Unlisted Segments For Further Details Contact: Tel.: 022-2527 2510/2527 6077 / 25276089 Telefax: 022-25276089 040-20000235 /20000233 E-mail: info@firstobjectindia.com www.firstcallresearch.com