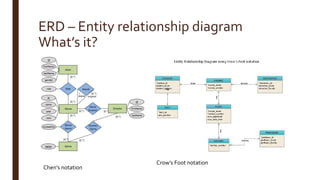
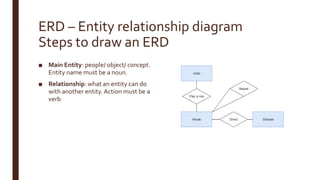
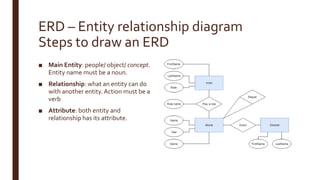
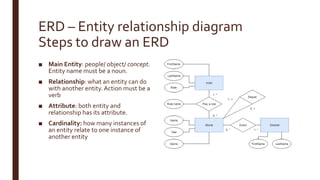
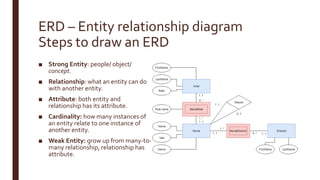
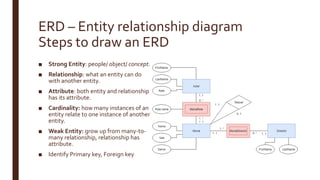
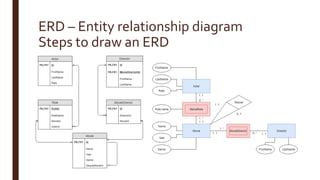
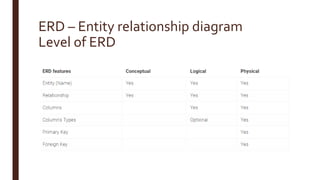
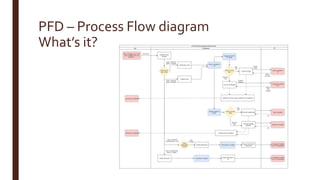
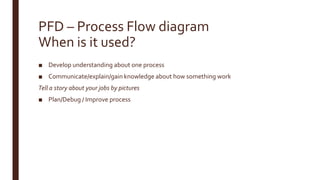
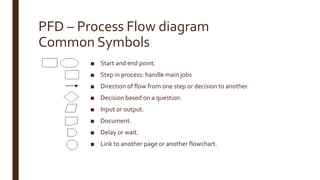
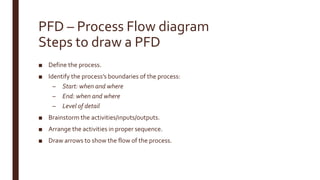
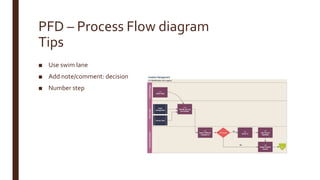
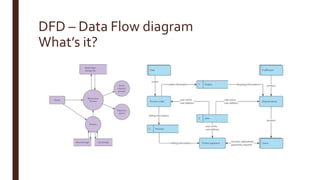
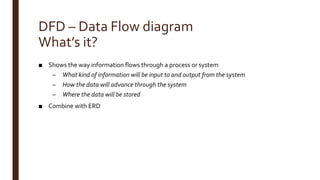
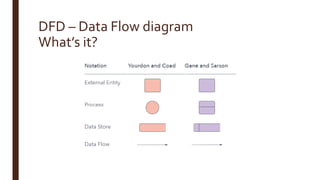
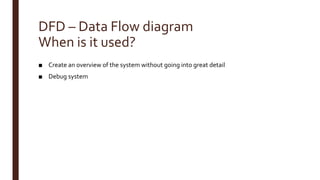
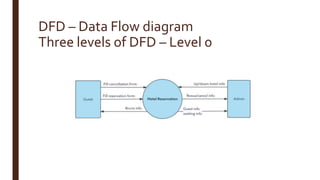
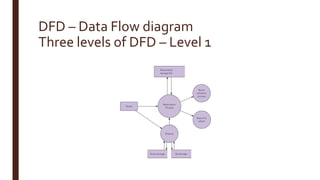
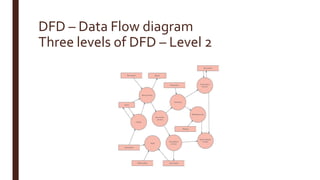
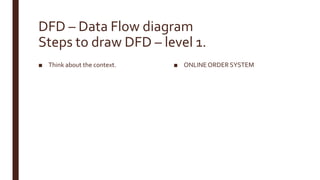
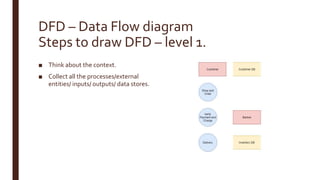
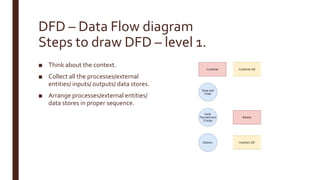
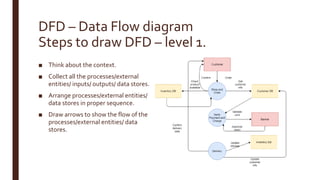
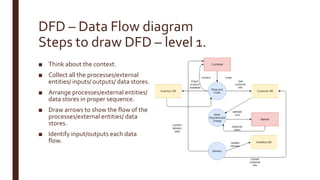
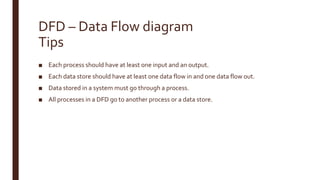
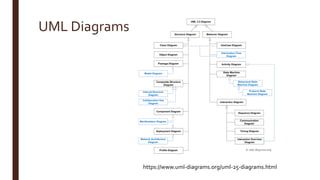
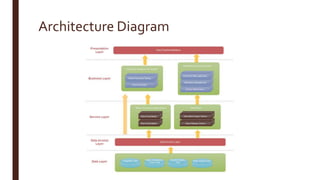
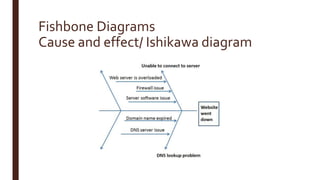
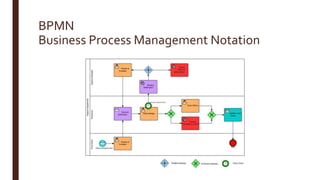
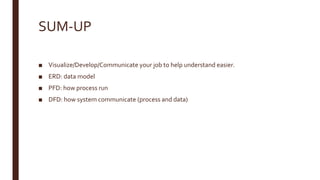
INTRODUCETO DIAGRAMS
WHY/WHEN/HOW USETHEM
Designed by Huong NgocVo
WARM-UP
Prepare for your brain
Why should we know about diagrams?
■ Natural language may arise misunderstanding.
■ Complex concepts/processes are hard to transfer literally.
■ Image speaks louder than words.
(Human brain can process images up to 60,000 times faster than words)
=> A standard, common convention to help everyone to gain and share same recognition
visually.
When can we use diagrams?
■ Capture, clean, and develop ideas
■ Transfer and present ideas/information
■ Keep information
FIGHTING!
Common baby!
ROUND ONE: ERD
Entity Relationship Diagram
ERD – Entity relationship diagram
What’s it?
Chen’s notation
Crow’s Foot notation
ERD – Entity relationship diagram
When is it used?
■ Design/Debug database
■ Gather requirements.
■ Understand system from data model aspect.
■ Document system.
ERD – Entity relationship diagram
How to use it?
■ For beginner, student who starts learn how to architect database: using Chen’s
notation to learn about how architect database
■ For database senior/expert: use Crow’s Foot notation
ERD – Entity relationship diagram
Steps to draw an ERD
■ Main Entity: people/ object/ concept.
Entity name must be a noun.
ERD – Entity relationship diagram
Steps to draw an ERD
■ Main Entity: people/ object/ concept.
Entity name must be a noun.
■ Relationship: what an entity can do
with another entity.Action must be a
verb
ERD – Entity relationship diagram
Steps to draw an ERD
■ Main Entity: people/ object/ concept.
Entity name must be a noun.
■ Relationship: what an entity can do
with another entity.Action must be a
verb
■ Attribute: both entity and
relationship has its attribute.
ERD – Entity relationship diagram
Steps to draw an ERD
■ Main Entity: people/ object/ concept.
Entity name must be a noun.
■ Relationship: what an entity can do
with another entity.Action must be a
verb
■ Attribute: both entity and
relationship has its attribute.
■ Cardinality: how many instances of
an entity relate to one instance of
another entity
ERD – Entity relationship diagram
Steps to draw an ERD
■ Strong Entity: people/ object/
concept.
■ Relationship: what an entity can do
with another entity.
■ Attribute: both entity and
relationship has its attribute.
■ Cardinality: how many instances of
an entity relate to one instance of
another entity.
■ Weak Entity: grow up from many-to-
many relationship, relationship has
attribute.
ERD – Entity relationship diagram
Steps to draw an ERD
■ Strong Entity: people/ object/ concept.
■ Relationship: what an entity can do
with another entity.
■ Attribute: both entity and relationship
has its attribute.
■ Cardinality: how many instances of an
entity relate to one instance of another
entity.
■ Weak Entity: grow up from many-to-
many relationship, relationship has
attribute.
■ Identify Primary key, Foreign key
ERD – Entity relationship diagram
Steps to draw an ERD
ERD – Entity relationship diagram
Level of ERD
ROUNDTWO: PFD
Process Flow Diagram
PFD – Process Flow diagram
What’s it?
PFD – Process Flow diagram
When is it used?
■ Develop understanding about one process
■ Communicate/explain/gain knowledge about how something work
Tell a story about your jobs by pictures
■ Plan/Debug / Improve process
PFD – Process Flow diagram
Common Symbols
■ Start and end point.
■ Step in process: handle main jobs
■ Direction of flow from one step or decision to another.
■ Decision based on a question.
■ Input or output.
■ Document.
■ Delay or wait.
■ Link to another page or another flowchart.
PFD – Process Flow diagram
Steps to draw a PFD
■ Define the process.
■ Identify the process’s boundaries of the process:
– Start: when and where
– End: when and where
– Level of detail
■ Brainstorm the activities/inputs/outputs.
■ Arrange the activities in proper sequence.
■ Draw arrows to show the flow of the process.
PFD – Process Flow diagram
Tips
■ Use swim lane
■ Add note/comment: decision
■ Number step
ROUNDTHREE: DFD
Data Flow Diagram
DFD – Data Flow diagram
What’s it?
DFD – Data Flow diagram
What’s it?
■ Shows the way information flows through a process or system
– What kind of information will be input to and output from the system
– How the data will advance through the system
– Where the data will be stored
■ Combine with ERD
DFD – Data Flow diagram
What’s it?
DFD – Data Flow diagram
When is it used?
■ Create an overview of the system without going into great detail
■ Debug system
DFD – Data Flow diagram
Three levels of DFD – Level 0
DFD – Data Flow diagram
Three levels of DFD – Level 1
DFD – Data Flow diagram
Three levels of DFD – Level 2
DFD – Data Flow diagram
Steps to draw DFD – level 1.
■ Think about the context. ■ ONLINEORDER SYSTEM
DFD – Data Flow diagram
Steps to draw DFD – level 1.
■ Think about the context.
■ Collect all the processes/external
entities/ inputs/ outputs/ data stores.
DFD – Data Flow diagram
Steps to draw DFD – level 1.
■ Think about the context.
■ Collect all the processes/external
entities/ inputs/ outputs/ data stores.
■ Arrange processes/external entities/
data stores in proper sequence.
DFD – Data Flow diagram
Steps to draw DFD – level 1.
■ Think about the context.
■ Collect all the processes/external
entities/ inputs/ outputs/ data stores.
■ Arrange processes/external entities/
data stores in proper sequence.
■ Draw arrows to show the flow of the
processes/external entities/ data
stores.
■ Identify input/outputs each data
flow.
DFD – Data Flow diagram
Tips
■ Each process should have at least one input and an output.
■ Each data store should have at least one data flow in and one data flow out.
■ Data stored in a system must go through a process.
■ All processes in a DFD go to another process or a data store.
STRENGTHEN
You rock!
UML Diagrams
https://www.uml-diagrams.org/uml-25-diagrams.html
Architecture Diagram
Mind Map
Fishbone Diagrams
Cause and effect/ Ishikawa diagram
UX Maps
Empathy Map
BPMN
Business Process Management Notation
Tools to draw these chart
■ Office (not recommend)
■ Draw.io
■ Lucidchart.com
■ Smartdraw.com
■ Gliffy (chrome extension)
■ Visual Paradigm
■ Start UML
RELAX
SUM-UP
■ Visualize/Develop/Communicate your job to help understand easier.
■ ERD: data model
■ PFD: how process run
■ DFD: how system communicate (process and data)

Introduce to diagrams

  • 1.
  • 2.
  • 3.
    Why should weknow about diagrams? ■ Natural language may arise misunderstanding. ■ Complex concepts/processes are hard to transfer literally. ■ Image speaks louder than words. (Human brain can process images up to 60,000 times faster than words) => A standard, common convention to help everyone to gain and share same recognition visually.
  • 4.
    When can weuse diagrams? ■ Capture, clean, and develop ideas ■ Transfer and present ideas/information ■ Keep information
  • 5.
  • 6.
    ROUND ONE: ERD EntityRelationship Diagram
  • 7.
    ERD – Entityrelationship diagram What’s it? Chen’s notation Crow’s Foot notation
  • 8.
    ERD – Entityrelationship diagram When is it used? ■ Design/Debug database ■ Gather requirements. ■ Understand system from data model aspect. ■ Document system.
  • 9.
    ERD – Entityrelationship diagram How to use it? ■ For beginner, student who starts learn how to architect database: using Chen’s notation to learn about how architect database ■ For database senior/expert: use Crow’s Foot notation
  • 10.
    ERD – Entityrelationship diagram Steps to draw an ERD ■ Main Entity: people/ object/ concept. Entity name must be a noun.
  • 11.
    ERD – Entityrelationship diagram Steps to draw an ERD ■ Main Entity: people/ object/ concept. Entity name must be a noun. ■ Relationship: what an entity can do with another entity.Action must be a verb
  • 12.
    ERD – Entityrelationship diagram Steps to draw an ERD ■ Main Entity: people/ object/ concept. Entity name must be a noun. ■ Relationship: what an entity can do with another entity.Action must be a verb ■ Attribute: both entity and relationship has its attribute.
  • 13.
    ERD – Entityrelationship diagram Steps to draw an ERD ■ Main Entity: people/ object/ concept. Entity name must be a noun. ■ Relationship: what an entity can do with another entity.Action must be a verb ■ Attribute: both entity and relationship has its attribute. ■ Cardinality: how many instances of an entity relate to one instance of another entity
  • 14.
    ERD – Entityrelationship diagram Steps to draw an ERD ■ Strong Entity: people/ object/ concept. ■ Relationship: what an entity can do with another entity. ■ Attribute: both entity and relationship has its attribute. ■ Cardinality: how many instances of an entity relate to one instance of another entity. ■ Weak Entity: grow up from many-to- many relationship, relationship has attribute.
  • 15.
    ERD – Entityrelationship diagram Steps to draw an ERD ■ Strong Entity: people/ object/ concept. ■ Relationship: what an entity can do with another entity. ■ Attribute: both entity and relationship has its attribute. ■ Cardinality: how many instances of an entity relate to one instance of another entity. ■ Weak Entity: grow up from many-to- many relationship, relationship has attribute. ■ Identify Primary key, Foreign key
  • 16.
    ERD – Entityrelationship diagram Steps to draw an ERD
  • 17.
    ERD – Entityrelationship diagram Level of ERD
  • 18.
  • 19.
    PFD – ProcessFlow diagram What’s it?
  • 20.
    PFD – ProcessFlow diagram When is it used? ■ Develop understanding about one process ■ Communicate/explain/gain knowledge about how something work Tell a story about your jobs by pictures ■ Plan/Debug / Improve process
  • 21.
    PFD – ProcessFlow diagram Common Symbols ■ Start and end point. ■ Step in process: handle main jobs ■ Direction of flow from one step or decision to another. ■ Decision based on a question. ■ Input or output. ■ Document. ■ Delay or wait. ■ Link to another page or another flowchart.
  • 22.
    PFD – ProcessFlow diagram Steps to draw a PFD ■ Define the process. ■ Identify the process’s boundaries of the process: – Start: when and where – End: when and where – Level of detail ■ Brainstorm the activities/inputs/outputs. ■ Arrange the activities in proper sequence. ■ Draw arrows to show the flow of the process.
  • 23.
    PFD – ProcessFlow diagram Tips ■ Use swim lane ■ Add note/comment: decision ■ Number step
  • 24.
  • 25.
    DFD – DataFlow diagram What’s it?
  • 26.
    DFD – DataFlow diagram What’s it? ■ Shows the way information flows through a process or system – What kind of information will be input to and output from the system – How the data will advance through the system – Where the data will be stored ■ Combine with ERD
  • 27.
    DFD – DataFlow diagram What’s it?
  • 28.
    DFD – DataFlow diagram When is it used? ■ Create an overview of the system without going into great detail ■ Debug system
  • 29.
    DFD – DataFlow diagram Three levels of DFD – Level 0
  • 30.
    DFD – DataFlow diagram Three levels of DFD – Level 1
  • 31.
    DFD – DataFlow diagram Three levels of DFD – Level 2
  • 32.
    DFD – DataFlow diagram Steps to draw DFD – level 1. ■ Think about the context. ■ ONLINEORDER SYSTEM
  • 33.
    DFD – DataFlow diagram Steps to draw DFD – level 1. ■ Think about the context. ■ Collect all the processes/external entities/ inputs/ outputs/ data stores.
  • 34.
    DFD – DataFlow diagram Steps to draw DFD – level 1. ■ Think about the context. ■ Collect all the processes/external entities/ inputs/ outputs/ data stores. ■ Arrange processes/external entities/ data stores in proper sequence.
  • 35.
    DFD – DataFlow diagram Steps to draw DFD – level 1. ■ Think about the context. ■ Collect all the processes/external entities/ inputs/ outputs/ data stores. ■ Arrange processes/external entities/ data stores in proper sequence. ■ Draw arrows to show the flow of the processes/external entities/ data stores.
  • 36.
    DFD – DataFlow diagram Steps to draw DFD – level 1. ■ Think about the context. ■ Collect all the processes/external entities/ inputs/ outputs/ data stores. ■ Arrange processes/external entities/ data stores in proper sequence. ■ Draw arrows to show the flow of the processes/external entities/ data stores. ■ Identify input/outputs each data flow.
  • 37.
    DFD – DataFlow diagram Tips ■ Each process should have at least one input and an output. ■ Each data store should have at least one data flow in and one data flow out. ■ Data stored in a system must go through a process. ■ All processes in a DFD go to another process or a data store.
  • 38.
  • 39.
  • 40.
  • 41.
  • 42.
    Fishbone Diagrams Cause andeffect/ Ishikawa diagram
  • 43.
  • 44.
  • 45.
  • 46.
    Tools to drawthese chart ■ Office (not recommend) ■ Draw.io ■ Lucidchart.com ■ Smartdraw.com ■ Gliffy (chrome extension) ■ Visual Paradigm ■ Start UML
  • 47.
  • 48.
    SUM-UP ■ Visualize/Develop/Communicate yourjob to help understand easier. ■ ERD: data model ■ PFD: how process run ■ DFD: how system communicate (process and data)

Editor's Notes

  • #8 Flowchart Relationship of entity RDBMS: a table
  • #9 Construct a relational database.
  • #13 A key attribute is the unique, distinguishing characteristic of the entity
  • #20 Flowchart Chemical engineering Illustrate process visually.
  • #22 The question is written in the diamond. More than one arrow goes out of the diamond, each one showing the direction the process takes for a given answer to the question. (Often the answers are “ yes” and “ no.”)
  • #26 Flowchart
  • #27 Flowchart Shows the way information flows through a process or system What kind of information will be input to and output from the system, How the data will advance through the system, Where the data will be stored Combine with ERD to understand data system more.
  • #29 Preliminary step Can later be elaborated
  • #40 Various diagrams OOP Programming
  • #41 System AD Website AD Application AD Software AD https://www.edrawsoft.com/architecture-diagram.php
  • #42 organize concepts and ideas develop ideas
  • #43 Root and cause
  • #44 Empathy maps help team members understand the user’s mindset. Customer journey maps focus on a specific customer’s interaction with a product or service. Experience maps generalize the concept of customer-journey maps across user types and products. Service blueprints are counterparts to customer journey maps, focused on the employees.
  • #45 Why use it: To build empathy for your users To force alignment and understanding about a user type When to use it: Beginning of any design process When categorizing research notes from a user interview