More Related Content
Similar to Optimizing Capillary Nozzles Poster
Similar to Optimizing Capillary Nozzles Poster (20)
Optimizing Capillary Nozzles Poster
- 1. RESEARCH POSTER PRESENTATION DESIGN © 2015
www.PosterPresentations.com
Introduction Methods Continued Results Continued
References
Mentors: Dr. Alfred DeGennaro, Dr. Elaine Parshall, and Dr. David Whitbeck
Jack Madden, Hunter Damron, Kaitlyn Baldizzi, Chloe Harris
Optimizing Capillary Nozzles for Maximum Droplet Distance after
Ejection in a Microgravity Environment
● Using the models, ejection distances
were calculated as a function of the
ratio between the nozzle’s inner
diameter and the tube’s inner diameter.
● This function sampled a two
dimensional range of values between
zero and one was samples for the ratios
to find the largest ejection distance.
● Equations Used:
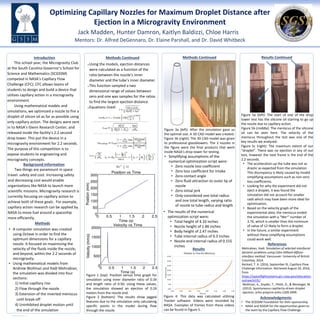
Figure 2 (bottom): The results show jagged
features due to the simulation only calculating
specific points in the model during flow
through the nozzle.
Figure 1 (top): Position versus time graph for
simulation using inner diameter ratio of 0.34
and length ratio of 0.50. Using these values,
the simulation showed an ejection of 0.24
meters from the nozzle end.
Mehrabian, Hadi. Simulation of selected interfacial
dynamic problems using Cahn-Hilliard diffuse-
interface method. Vancouver: University of British
Columbia, 2014.
Reckart, T. A. (2016, September 9). Capillary Flow
Challenge Information. Retrieved August 20, 2016,
from
https://spaceflightsystems.grc.nasa.gov/education-
outreach/cfc/
Wollman, A., Snyder, T., Pettit, D., & Weislogel, M.
(2012). Spontaneous capillarity-driven droplet
ejection. arXiv preprint arXiv:1209.3999.
This school year, the Microgravity Club
at the South Carolina Governor’s School for
Science and Mathematics (SCGSSM)
competed in NASA’s Capillary Flow
Challenge (CFC). CFC allows teams of
students to design and build a device that
utilizes capillary action in a microgravity
environment.
Using mathematical models and
simulations, we optimized a nozzle to fire a
droplet of silicon oil as far as possible using
only capillary action. The designs were sent
in to NASA’s Glenn Research Center, and
released inside the facility's 2.2 second
drop tower. This put the device in a
microgravity environment for 2.2 seconds.
The purpose of this competition is to
expose students to engineering and
microgravity concepts.
Two things are paramount in space
travel: safety and cost. Increasing safety
and decreasing cost would enable
organizations like NASA to launch more
scientific missions. Microgravity research is
currently focusing on capillary action to
achieve both of these goals. For example,
capillary action research can be applied by
NASA to move fuel around a spaceship
more efficiently.
Figure 3a (left): After the simulation gave us
the optimal size. A 3D CAD model was created.
Figure 3b (right): The 3D CAD model was given
to professional glassblowers. The 3 nozzles in
the figure were the final products that went
inside NASA’s drop tower for testing.
Methods Continued
Background Information
Methods
• A computer simulation was created
using Octave in order to find the
optimum dimensions for a capillary
nozzle. It focused on maximizing the
velocity of the fluids inside the nozzle,
and beyond, within the 2.2 seconds of
microgravity.
• Using mathematical models from
Andrew Wollman and Hadi Mehrabian,
the simulation was divided into four
sections:
1) Initial capillary rise
2) Flow through the nozzle
3) Extension of the inverted meniscus
until break-off
4) Uninhibited droplet motion until
the end of the simulation
• The results of the numerical
optimization script were:
• Total height of 4.33 inches
• Nozzle height of 1.86 inches
• Body height of 2.47 inches
• Tube internal radius of 0.3 inches
• Nozzle end internal radius of 0.155
inches
Figure 5a (left): The start of one of the drop
tower test has the silicone oil starting to go up
the nozzle due to capillary action.
Figure 5b (middle): The meniscus of the silicone
oil can be seen here. The velocity of the
meniscus throughout the test was one of the
key results we analyzed.
Figure 5c (right): The maximum extent of our
“droplet”. There was no ejection in any of our
test, however the next frame is the end of the
2.2 seconds.
0.00
5.00
10.00
15.00
20.00
25.00
30.00
35.00
0.00 0.50 1.00 1.50 2.00 2.50 3.00 3.50
Position(mm)
Time (s)
Position vs Time for Meniscus
Figure 4: This data was calculated utilizing
Tracker software. Videos were recorded by
NASA. Examples of frames from these videos
can be found in Figure 5.
• Simplifying assumptions of the
numerical optimization script were:
• Zero nozzle loss coefficient
• Zero loss coefficient for intake
• Zero contact angle
• Zero fluid attraction to outer lip of
nozzle
• Zero initial jerk
• Only considered one total radius
and one total length, varying ratio
of nozzle to tube radius and length
Results
• The acceleration up the tube was not as
drastic as expected from the simulation
This discrepancy is likely caused by invalid
simplifying assumptions such as non-zero
loss coefficients.
• Looking for why the experiment did not
eject a droplet, it was found the
simulation did not account for smaller
radii which may have been more ideal for
optimization.
• Based on the velocity graph of the
experimental data, the meniscus ended
the simulation with a “We+” number of
3.76, which is smaller than the minimum
of value of 12 likely to form a droplet.
• In the future, a similar experiment
without these simplifying assumptions
could work well.
Acknowledgments
• The SCGSSM Foundation for their sponsorship
• NASA and ASGSR for the opportunities given to
the team by the Capillary Flow Challenge.