1. Honori Yamada
Bio 2
Sept/2/10
Introduction:
The cell membrane is a thin barrier of a cell which consists of proteins and a
phospholipid bilayer. However, only particular materials are able to diffuse in and out of
the cell membrane and this is due to its size, charge, and polarity. Diffusion is a
movement of any substance or particle in which they move in areas from high
concentration to low concentration until equilibrium is reached. Out of several ways of
diffusion that are possible, simple diffusion only allows nonpolar substances such as
oxygen and carbon dioxide (O2, CO2) to get across the cell membrane. There are other
ways such as the active transport which allows only ion charged particles as well as the
protein transports, which allows specific polar molecules such as water (H2O) to enter
in and out of the cell membrane.
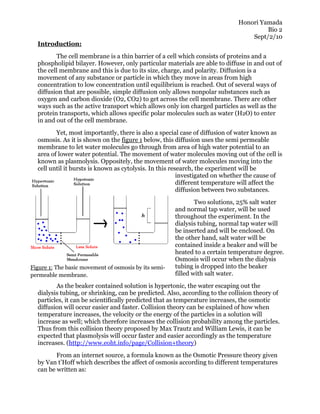
Yet, most importantly, there is also a special case of diffusion of water known as
osmosis. As it is shown on the figure 1 below, this diffusion uses the semi permeable
membrane to let water molecules go through from area of high water potential to an
area of lower water potential. The movement of water molecules moving out of the cell is
known as plasmolysis. Oppositely, the movement of water molecules moving into the
cell until it bursts is known as cytolysis. In this research, the experiment will be
investigated on whether the cause of
different temperature will affect the
diffusion between two substances.
Two solutions, 25% salt water
and normal tap water, will be used
throughout the experiment. In the
dialysis tubing, normal tap water will
be inserted and will be enclosed. On
the other hand, salt water will be
contained inside a beaker and will be
heated to a certain temperature degree.
Osmosis will occur when the dialysis
Figure 1: The basic movement of osmosis by its semi- tubing is dropped into the beaker
permeable membrane. filled with salt water.
As the beaker contained solution is hypertonic, the water escaping out the
dialysis tubing, or shrinking, can be predicted. Also, according to the collision theory of
particles, it can be scientifically predicted that as temperature increases, the osmotic
diffusion will occur easier and faster. Collision theory can be explained of how when
temperature increases, the velocity or the energy of the particles in a solution will
increase as well; which therefore increases the collision probability among the particles.
Thus from this collision theory proposed by Max Trautz and William Lewis, it can be
expected that plasmolysis will occur faster and easier accordingly as the temperature
increases. (http://www.eoht.info/page/Collision+theory)
From an internet source, a formula known as the Osmotic Pressure theory given
by Van t’Hoff which describes the affect of osmosis according to different temperatures
can be written as:
2. Honori Yamada
Bio 2
Sept/2/10
π = c R T, (1)
where π indicates the osmotic pressure, c is the molecular concentration, R is the
gas constant, and T is the temperature. Van t’Hoff’s theory proves how the osmosis
pressure does not depend on the type of solute or the size of the molecules, but more of
the 2 factors of concentration and temperature. As the temperature increases, so will the
osmotic pressure. Similarly, as the concentration increases, so will the osmotic pressure.
(http://urila.tripod.com/) From equation 1, it can be predicted that as the temperature
increases, there will obviously be an effect on the osmotic pressure or in this
experimental case, the diffusion across the semi permeable membrane.
Design:
Research Question:
How will temperature affect the rate of diffusion between water and 25% salt water?
Table 1: Important Variables
Variable Type How
Temperature Independent Variable Water bath, thermometer,
hot plate
Mass of dialysis tubing Dependent Variable Beaker, water
Size of dialysis tubing Controlled Variable Ruler measurement, scissor
Concentration of salt water Controlled Variable Electronic Balance, beaker,
- Amount of salt water, stirrer
- Amount of water
Length of time Controlled Variable Stopwatch
Size of Beaker Controlled Variable -------------
▲Table 1: These are the important independent, dependent, and controlled variables
that are shown as well as the process of how it was done.
Materials:
- Dialysis Tube
- Hot Plate
- Beaker Figure 3: Dialysis tubing and 2 clamps
- Thermometer used through the experiment
- Dialysis tubing clamps
- Water
- Salt
- Electronic Balance
- Timer Figure 2: Electronic Balance used
- Graduated cylinder to measure all the dialysis tubings
- Ice
- Large bowl
3. Honori Yamada
Bio 2
Sept/2/10
Procedure:
Step 1. Prepare 320 ml of 25% salt water solution in a beaker (300 water, 75g of salt)
Step 2. Cut the Dialysis tubing into 13cm lengths and rub it in water for friction to get an
opening
Step 3. Close one side of the Dialysis tubing with a dialysis tubing clamps
Step 4. Insert 30 ml of plain water into the Dialysis tubing and secure the other side
with a green clip
Step 5. Prepare the hot plate or an ice bowl to the given temperatures (0˚C, 15˚C, 30˚C,
60˚C)
Step 6. Place the beaker filled with 25% salt water onto the heating plate / ice bowl
Step 7. Once the beaker reaches the certain temperature, keep it in a constant
temperature and insert the Dialysis tubing
Step 8. Time the experiment for 10 minutes
Step 9. Remove the Dialysis Tubing and measure its mass on the measuring scale
(repeat this 5 times for each 3 trials)
Step 10. Later, repeat the whole process 3 times with the different given temperatures
Step 11. After the experiment, calculate the averages of each 3 masses and its
uncertainties
Data Collection & Processing:
Table 2: Percent Change in Mass at Different Temperature
1°C Initial Result Average of Change in Mass Percent Average
Weight(g) Mass (g) Masses (g) (g) Change D= Percent
(A) (B) C= B – A Change
100
Trial 1 40.68 1) 39.50 39.60 -1. 08 - 2.65
2) 39.66
3) 39.60
4) 39.65
5) 39.57
Trial 2 42.49 1) 41.86 41.47 -1.02 -2.40
2) 41.68 -2.46 ± 0.16
3) 41.43
4) 41.26
5) 41.20
Trial 3 42.12 1) 41.26 41.14 -0.98 -2.33
2) 41.15
3) 41.10
4) 41.12
5) 41.07
4. Honori Yamada
Bio 2
Sept/2/10
15°C Initial Result Average of Change in Mass Percent Average
Weight(g) Mass (g) Masses (g) (g) Change D= Percent
(A) (B) C= B – A Change
100
Trial 1 41.75 1) 40.16 39.98 -1.77 -4.24
2) 39.83
3) 40.23
4) 39.78
5) 39.90
Trial 2 41.04 1) 39.48 39.37 -1.67 -4.07
2) 39.32 -4.21 ± 0.13
3) 39.02
4) 39.67
5) 39.35
Trial 3 40.55 1) 38.95 38.80 -1.75 -4.32
2) 38.96
3) 38.72
4) 38.71
5) 38.64
30°C Initial Result Average of Change in Mass Percent Average
Weight(g) Mass (g) Masses (g) (g) Change D= Percent
(A) (B) C= B – A Change
100
Trial 1 41.95 1) 40.53 39.98 -1.97 -4.70
2) 40.30
3) 40.19
4) 40.03
5) 40.09
Trial 2 42.22 1) 40.22 39.77 -2.45 -5.80
2) 39.91 -5.56 ± 0.75
3) 39.73
4) 39.65
5) 39.35
Trial 3 43.62 1) 40.93 40.92 -2.70 -6.19
2) 41.09
3) 40.83
4) 40.95
5) 40.82
60°C Initial Result Average of Change in Mass Percent Average
Weight(g) Mass (g) Masses (g) (g) Change (%) Percent
(A) (B) C= B – A D= 100 Change (%)
Trial 1 40.05 1) 37.98 37.63 -2.42 -6.04
2) 37.95
3) 36.95
4) 37.73
5) 37.55
Trial 2 39.17 1) 36.88 34.78 -4.40 -11.23
2) 34.84 -9.05 ± 2.17
3) 34.74
4) 34.65
5) 34.45
Trial 3 40.60 1) 36.93 36.59 -4.01 -9.89
2) 36.83
3) 36.55
4) 36.37
5) 36.25
▲Table 2: Five dialysis tubings were weighed for each three trials and the average
percent change in each mass were calculated with uncertainties.
5. Honori Yamada
Bio 2
Sept/2/10
Sample Calculations:
i. Finding the Mean of all 5 result masses (trial 1 at temperature 1°C)
= (result mass 1+result mass 2+result mass 3+result mass 4+result mass5)/5
= (39.50 + 39.66 + 39.60 + 39.65 + 39.57) / 5
39.60 (g)
ii. Finding the Change in Mass (trial 1 at temperature 1°C)
= Average of Result Mass – Initial Weight
= 39.60 – 40.68
-1. 08 (g)
iii. Finding the Percentage Change (trial 1 at temperature 1°C)
= Change in Mass / Initial Weight × 100
= -1.08 / 40.68 × 100
- 2.65 %
iv. Finding the Average Percent Change at 1°C
= Trial 1 Percent Change + Trial 2 Percent Change + Trial 3 Percent Change / 3
= (- 2.65) + (-2.40) + (-2.33) / 3
-2.46
v. Calculating the Uncertainty at temperature 1°C
= Range / 2
= [(-2.65) + (-2.33)] / 2
± 0.16
Figure 4: The graph above shows how the percent change in mass is affected by the
different temperatures.
6. Honori Yamada
Bio 2
Sept/2/10
Conclusion & Evaluation:
Conclusion:
According to the graph in figure 4, the linear fit equation or the slope shows a
descending line. The slope which was -0.11 signifies how when the temperature
increases, the percent change in the mass of the dialysis tubing gets smaller. As the
percent change in the mass gets smaller at a high rate of temperature, this therefore
specifies a faster process of shrinking or hypertonic solution. The percent change in
mass after placing the dialysis tubing in 1°C shrunk by -2.46%. However, the percent
change in mass after placing the tubing in 60°C shrunk by -9.05%. Again, this can be
concluded as to how the percent change in mass of the dialysis tubing decreases as the
temperature rises.
From figure 4, the correlation of the graph was shown as -0.9989 which is a
decent result and makes sense since the number is very close to -0.1. As the correlation
was very to -0.1, this means that there is a visible actual pattern or an effect of the
independent variable used throughout this experiment.
The uncertainty of the graph above shows a difference in each average percent
change in mass. The experiment when placed in 1°C does not result with a huge
difference in uncertainty than when experimenting at 60°C. This is due to the
inconstant masses that resulted during the experiment during high temperatures. At
0°C, the uncertainty was ± 0.16, but the uncertainty resulted with ± 2.17 during the
experiment at 60°C.
Evaluation:
Throughout this experiment, there was one big error which was the size of the
dialysis tubing. On the first day of the experiment, the medium size dialysis tubings
were used. However, it was on the second day in which it was discovered that there were
three sizes to the dialysis tubing. So the dialysis tubing used on the first day of the
experiment might have been the different size it was used during the second day of the
experiment. Although there were no major mass differences on the data results from the
first day of the experiment, there was a possibility that the size of the dialysis tubing
might have changed. This can be improved by carefully examining and by recording the
specific length, width and height for each dialysis tubings. This will prevent such
careless mistakes since all the specific measurement would be written for the continuing
day of the experiment.
Along with the size of the dialysis tubing that was used, the accurate length of the
tubing might have not all been the same length. As the dialysis tubing was trimmed off
with a knife, the length of each side was not equally straight. This therefore might have
affected the average percent change in mass as a whole. Also, as the dialysis tubings
were trimmed into pieces, it was not double checked to make sure that they were all the
same sizes. For next time, scissors should be used for more accuracy with the length.
Also it would be better if each side of the dialysis tubings are marked so that the tubings
would be trimmed equally on both sides.
7. Honori Yamada
Bio 2
Sept/2/10
As it is shown in table 3, another error that might have affected the inconstant
data results was the stability of the given temperatures. As a dialysis tubing was placed
in salt water for 10 minutes, there were some difficulties in keeping the temperature
stabled. A thermometer was placed in the beaker to keep the temperature stabled, but at
times the temperature increased and decreased by 1°C. So from the instability of
keeping the temperature at the same degree, the percent mass of the tubing might have
been affected overall. To prevent this from happening next time, an instrument known
as the constant temperature bath should be used to keep the temperature at a steady
degree. This we surely prevent the solution from increasing or decreasing the
temperature and therefore will not affect the overall result of the experiment.
Tissue papers were used to dry and rescale the dialysis tubing five times for each
trial. As drying the tubings were rushed through so that time would not have affected
the results, properly drying the dialysis tubings each time was another error. Since some
measurements were too different from the other five measurements in the trial, it was
considered as an outlier. This was due to how inaccurate the dialysis tubings were dried
each time as some bits of water might have been still left in between the dialysis tubing
clamps. For a better accurate experiment, more time in drying each tubings should be
done. One person should be the dryer who constantly paper towel dries each dialysis
tubing the same way precisely.
Weakness How/what Solve
Size of dialysis tubing Thought there was only Look to see if there are any
type of dialysis tubing other sizes by width of the
(width) dialysis tubing and recond
it somewhere on data
Length of dialysis Trimmed with knife and Mark each end sides of the
tubing used ruler dialysis tubing and cut with
scissors
Instability Temperature Used thermometer to keep Use instrument known as
eye on exact temperature constant temperature bath
Measurement error Used tissue paper to Accurately take more time
quickly dry out water and dry each tubing in
surrounding the tubings between small edges/gaps
▲Table 3: The different weaknesses that appeared during the experiment and how it
should be solved is shown
The Effect on Osmosis with Temperature