1. Analysis of the Properties of Sucrose Crystals Formed through the
Nucleation of Amorphous Sucrose Solutions
Taisha L. Bowman, Cody C. Kendig, and Chad N. Regner
_________________________________________________________________________________________________________
ABSTRACT: Amorphous sucrose has many practical applications. For example, it is an important ingredient in candy, sweeteners,
medication coating, and biological energy production. Understanding its thermodynamic properties is essential for optimizing these
applications. This experiment used differential scanning calorimetry (DSC) to investigate the temperature dependence of sucrose’s
(amorphous and recrystallized) thermodynamic properties. For amorphous sucrose, the temperature dependence of its heat capacity
was investigated. For recrystallized sucrose, the temperature dependences of the mass of crystal formation, melting point, and density
were investigated. Nine total amorphous sucrose solutions were created at 85°C, 95°C, and 105°C (3 solutions per temperature). The
heat capacities of the amorphous sucrose solutions decreased as the temperature increased as the result of uneven heating. The mass
of the recrystallized sucrose varied due to insufficient drying time and mass loss during extraction. The melting point of the recrys-
tallized sucrose was about 10°C lower than the melting point of commercial grade sucrose because of sample impurities. The average
density of recrystallized sucrose (1.5 g mL-1
± 0.2 g mL-1
) was lower than the density of the commercial grade sucrose before nucle-
ation (1.626 g mL-1
). It is suspected that the solution within the weighted mass of the sample resulted in a lower average density. It is
also suspected that some recrystallized sucrose dissolved as density was being determined.
INTRODUCTION:
There are three types of super solutions: supersaturated solu-
tions, supercooled solutions, and superheated solutions. A solu-
tion becomes supercooled when its temperature is rapidly de-
creased past its freezing point such that it remains a liquid. A
solution becomes superheated when its temperature is rapidly
increased past its boiling point such that it remains a liquid. A
solution becomes supersaturated when the amount of dissolved
solute is greater than the maximum amount that can be dis-
solved at room temperature1
. This is accomplished by increas-
ing the temperature of the solvent (above room temperature)
while dissolving the solute.
When sucrose is supersaturated in water, it becomes amorphous
sucrose. An amorphous substance has a loosely rigid structure,
a high dissolution rate, and a high solubility (compared to STP)
2
. When an amorphous sucrose solution is created, it undergoes
a liquid to solid physical process2
that is referred to as nuclea-
tion1
.
Nucleation is a disturbance that causes a liquid to solid or liquid
to vapor phase transition. These disturbances are referred to as
seeds. These transitions occur when an outside substance is in-
troduced to another substance that is in a supersaturated, super-
cooled, or superheated state. When a seed is introduced to a su-
persaturated solution or a supercooled solution, there is a liquid
to solid phase transition. When a seed is introduced to a super-
heated solution, there is a liquid to vapor phase transition1
.
The properties of these solutions are dependent on the temper-
ature at which the solutions are created. As temperature in-
creases, the rate of nucleation exponentially increases3
. Once
the solution is disturbed in this manner, it transitions into the
phase it would be under normal conditions through nucleation1
.
These transitions occur rapidly because surface area perpetuates
the potential to grow3
.
Supersaturated sucrose solutions are used in agriculture, food
chemistry, biochemistry, and pharmacology. Understanding the
many forms of sucrose and how to use it is necessary to create
products under favorable conditions. Amorphous sucrose is
used to make candy, sweeteners, quickly dissolving products,
coating and filling of medication, biological energy production,
and various other applications4
. Thermodynamic properties are
obtained by understanding how temperature affects the proper-
ties of amorphous and recrystallized sucrose, aiding the creation
of consumer products.
Heat capacity is a second order transition property4
. The phys-
ical properties of sucrose were determined by using various
temperatures to supersaturate it in water. The goal of this exper-
iment was to determine how temperature affects the properties
of sucrose crystals that are formed through the nucleation of
amorphous sucrose solutions.
EXPERIMENTAL:
Amorphous sucrose solutions were prepared using commercial
grade sucrose (Dominos Brand) and distilled water. Nine 1.08
g mL-1
solutions were prepared by dissolving 108 g of sucrose,
measured with an analytical balance (PB402-S, Mettler To-
ledo), in 100 mL of boiling distilled water, measured with a 100
mL ± 1 mL graduated cylinder. Then, 10 g increments of su-
crose were measured with an analytical balance and added to
each solution until undissolved sucrose was observed.
Next, the solutions were heated until boiling was observed. The
boiling point was measured with a mercury thermometer with
an uncertainty of ± 1°C. The solutions were then allowed to
reach room temperature and the volume of the new solution was
recorded.
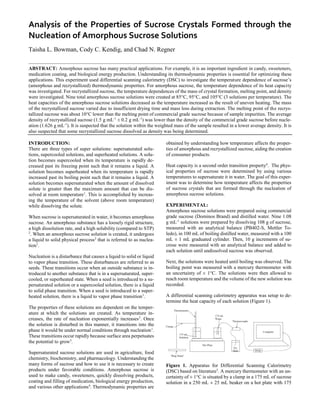
A differential scanning calorimetry apparatus was setup to de-
termine the heat capacity of each solution (Figure 1).
Figure 1. Apparatus for Differential Scanning Calorimetry
(DSC) based on literature5
. A mercury thermometer with an un-
certainty of ± 1°C is situated by a clamp in a 175 mL of sucrose
solution in a 250 mL ± 25 mL beaker on a hot plate with 175
2. mL of water in a 250 mL ± 25 mL beaker. A Type J iron-con-
stantan thermocouple has one end in the water and the other end
in an ice bath. Data was collected on a Data Acquisition card
(NI USB-6009, National Instruments) and recorded on a
MATLAB program that records temperature as a function of
time.
Nine total amorphous sucrose solutions were created at 85°C,
95°C, and 105°C (3 solutions per temperature). After recording
temperature as a function of time, the sucrose solutions were
allowed to cool for 10 to 15 minutes. Once cooled, wooden
skewers were dipped halfway in the solution and covered in su-
crose to form a seed for nucleation3
. The prepared skewers were
placed into the beaker without touching the bottom of the
beaker and secured with tape.
Crystals were not observed after 5 days because the solutions
were not supersaturated, as expected. To fix this, about 22 g of
commercial grade sucrose, measured with an analytical bal-
ance, was added to each solution. The volumes were reduced to
about 150 mL due to water loss from boiling.
The solution from Trial 1 for 85°C (85T1) was tampered with. It
was remade with reagent grade sucrose due to supply issues.
The volume of the new solution for 85TI was 175 mL. This so-
lution did not lose as much water due to boiling, compared to
the other trials.
Crystals formed mostly on the sides and bottom of the beakers
after 7 days. A small amount of crystals formed on the skewers.
The beaker was scraped with a scoopula to extract the remain-
ing crystals. The crystals were extracted from the remaining so-
lution with filter paper (Cat No 1001 055, Whatman) using vac-
uum filtration.
Only solution 85T1 was able to be vacuum filtered due to time
constraints. For the remaining solutions, each solution was
poured out of the beaker while keeping on the crystals intact on
the beaker. The crystals were scraped from the beaker, then
placed in weigh boats to air dry for a 7 days.
The dried crystals were weighted on an analytical balance to
determine the mass of crystal formation. Unknown amounts of
crystals from each trial were placed in separate capillary tubes
to prepare samples for a Melt Temp (1001D, Barnstead Interna-
tional). The reference melting point was determined by using
the Melt Temp on the commercial grade sucrose.
The densities of the crystals were determined by adding the
weighted amount of each crystal sample into 5.00 mL ± 0.01
mL of distilled water, measured with a 10.00 mL ± 0.01 mL
graduated cylinder, and recording the change in volume (Equa-
tion 1).
𝜌 =
𝑚 𝑐𝑟𝑦𝑠𝑡𝑎𝑙
𝛥𝑉𝑠𝑜𝑙
[1]
Where 𝜌 is the crystal’s density (g mL-1
), 𝑚 𝑐𝑟𝑦𝑠𝑡𝑎𝑙 is the mass
of crystals (g), and 𝛥𝑉𝑠𝑜𝑙 is the observed volume change when
the weighted amount of crystal sample was added to 5 mL ±
0.01 mL of distilled water (mL).
RESULTS/DISCUSSION:
DETERMINING HEAT CAPACITY
The data acquired to calculate heat capacity are in Table 1.
Table 1. Data obtained through differential scanning calorime-
try. Uncertainties include: ∆T ± 0.01°C from mercury thermom-
eter, 𝑚 𝐻2 𝑂 ± 1 g from 100 mL graduated cylinder, and 𝑚 𝑠𝑜𝑙. ±
0.001 g from analytical balance.
Differential scanning calorimetry requires the rate of heat trans-
fer to be spatially equivalent throughout a given time interval1
.
It was assumed that the heat transferred to the distilled water
was equal to the heat transferred to the sucrose solution. The
heat capacity of the solution was determined using Equation 2.
𝑄 = 𝑠𝑚∆𝑇 [2]
Where Q is the total heat transferred (J), s is the heat capacity
of the substance (J °C-1
g-1
), 𝑚 is the mass of the substance (g),
and 𝛥𝑇 is the temperature difference between the beginning and
end of each trial (°C).
Using Equation 2 and the assumption that the amount of heat
transferred to each beaker (1 beaker with solution and 1 beaker
with distilled water) is equivalent yields Equation 3.
𝑠𝑠𝑜𝑙 𝑚 𝑠𝑜𝑙 𝛥𝑇𝑠𝑜𝑙 = 𝑠 𝐻2 𝑂 𝑚 𝐻2 𝑂 𝛥𝑇 𝐻2 𝑂 [3]
Where 𝑠𝑠𝑜𝑙 is the heat capacity of the sucrose solution (J °C-1
g-
1
), 𝑚 𝑠𝑜𝑙 is the mass of the solution (g), 𝛥𝑇𝑠𝑜𝑙 is the change in
temperature of the solution (°C), 𝑠 𝐻2 𝑂 is the heat capacity of the
water (J °C-1
g-1
), 𝑚 𝐻2 𝑂 is the mass of water (g), and 𝛥𝑇 𝐻2 𝑂 is
the change in temperature of water (°C).
Rearranging Equation 3 yields Equation 4.
𝑠𝑠𝑜𝑙 =
𝑠 𝐻2 𝑂 𝑚 𝐻2 𝑂 𝛥𝑇𝐻2 𝑂
𝑚 𝑠𝑜𝑙 𝛥𝑇𝑠𝑜𝑙
[4]
3. It was expected that the heat capacities of the solutions increase
as temperature increases1
. However, the heat capacity decreased
as temperature increased (Table 1).
The change in water temperature (𝛥𝑇 𝐻2 𝑂) did not vary greatly
(the standard deviation was 4.16°C ± 0.01°C) from trial-to-trial.
However, the change in solution temperature (𝛥𝑇𝑠𝑜𝑙) increased
as temperature of the hot plate increased. Applying these obser-
vations to Equation 4, the numerator does not change greatly
relative to the denominator. This resulted in a trend where the
heat capacities of the solutions decreased as temperature in-
creased.
The discrepancy between the data and literature was investi-
gated. The assumption that the same amount of heat was trans-
ferred to each beaker was incorrect – the heat transfer rate per
unit area (heat flux) was different for each beaker. The magni-
tude of heat flux is directly proportional to the difference be-
tween the bulk liquid and hot plate temperatures1
. Since each
beaker was on the hot plate for the same amount of time, differ-
ent total amounts of heat were transferred to each beaker. This
resulted in the calculated heat capacity to decrease as tempera-
ture increased.
It was also assumed that the system was at steady state. How-
ever, temperature changed as a function of time, which was not
accounted for in the calculations.
DETERMINING MASS OF CRYSTAL FORMATION
The resulting masses of crystal formation are in Table 2.
Table 2. The mass of recrystallized sucrose of each trial. The
mass was measured with an analytical balance with an uncer-
tainty of ± 0.001 g. Trial 85T1 was not measured because crys-
tals were not formed.
It was expected that more crystals would form in the solutions
at lower temperatures2
. A seed is more likely to cause a disturb-
ance if it maintains its crystalline structure4
.
All the solutions were allowed to reach the same maximum tem-
perature when the 22 g of commercial grade sucrose was added.
This resulted in the solutions having the same amount of heat
added. It was expected that each solution would produce the
same amount of crystals because each solution was heated to
the same maximum temperature before nucleation.
The amount of crystals formed varied greatly (the standard de-
viation was 12.277 g ± 0.001 g) from trial-to-trial. It is sus-
pected that the amount of seeds had a large impact on the
amount of crystals formed. It is also suspected that some of the
250 mL ± 25 mL beakers were less clean than others. This re-
sulted in more crystals forming due to more present impurities.
Solution was still present after air drying the crystals. Also,
mass was lost when crystals were scraped from the beaker.
Solution 85TI did not form any crystals. The solution was not
supersaturated although it had the same amount of sucrose as
the other solutions. Solution 85T1 was made with reagent grade
sucrose, which has a higher purity than commercial grade su-
crose. Also, the seeds used for 85T1 were commercial grade su-
crose and not reagent grade sucrose.
DETERMINING MELTING TEMPERATURE
The resulting melting temperatures are in Table 3.
Table 3. The melting point of sucrose before nucleation
(𝑇𝑖𝑛𝑖𝑡𝑖𝑎𝑙) and the melting point of sucrose after nucleation
(𝑇𝑓𝑖𝑛𝑎𝑙). Temperatures were found with a Melt Temp and a mer-
cury thermometer with an uncertainty of ± 1°C. Trial 85T1 was
not measured because crystals were not formed.
It was expected that the melting point of the recrystallized su-
crose would be lower than the melting point of sucrose before
nucleation because of added impurities1
.
The melting points of the sucrose crystals formed through nu-
cleation were about 10°C less than the melting point of sucrose
before nucleation. The melting point of a crystalline structure
coincides with the temperature at which the substance begins to
decompose. These processes lead to a phase change from solid
to liquid and occur more quickly when the crystals come into
contact with liquid1
.
4. The recrystallized sucrose is contained in one bulk structure.
However, there are trace amounts of amorphous sucrose that did
not form a crystalline structure. Also the structure of the recrys-
tallized sucrose was not as tightly packed and uniform as it was
before nucleation4
. These reasons resulted in recrystallized su-
crose with more impurities.
Decomposition and melting point are influenced by the amount
of impurities in a sample. The more impurities present, the
greater the depressions in decomposition temperature and melt-
ing point6
.
DETERMINING DENSITY
The data acquired to calculate density are in Table 4.
Table 4. The density of sucrose before nucleation (𝜌𝑖𝑛𝑖𝑡𝑖𝑎𝑙) and
the experimental density of sucrose (𝜌 𝑓𝑖𝑛𝑎𝑙) using Equation 1.
Densities were found with a 10 mL graduated cylinder with an
uncertainty of ± 0.01 mL and an analytical balance with an un-
certainty of ± 0.001 g. Trial 85T1 was not measured because no
crystals were formed.
The tabulated value for the density of sucrose is 1.5805 g mL-1
[7]
while the experimental value determined for the density su-
crose was 1.626 g mL-1
. Error between the values was calcu-
lated using Equation 5.
Error =
|𝜌𝑡𝑎𝑏 − 𝜌𝑖𝑛𝑖𝑡𝑖𝑎𝑙|
𝜌𝑡𝑎𝑏
× 100%
[5]
Where 𝜌𝑡𝑎𝑏 is the tabulated density (g mL-1
).
There was a 2.88% percent error between the tabulated and ex-
perimental values of the density of sucrose. The difference is
suspected to be a result of using commercial grade sucrose,
which was less pure than the sucrose that was tested for the tab-
ulated value. When a substance has impurities, its density in-
creases8
. The commercial grade sucrose has a higher density
than the tabulated sucrose because it has more impurities.
It was expected that the average density of the recrystallized
sucrose would be higher than the density of the commercial
grade sucrose because of present impurities8
.
After recrystallization, the average density was 1.5 g mL-1
± 0.2
g mL-1
. This value is lower than the density of the commercial
grade sucrose. It was suspected that the presence of water in the
crystals was the cause of the average density being lower than
the experimental value for density (𝜌𝑖𝑛𝑖𝑡𝑖𝑎𝑙). It is also suspected
that some of the recrystallized sucrose dissolved in the distilled
water as density was being determined. These possible sources
of error changed the measured mass of crystals formed
(𝑚 𝑐𝑟𝑦𝑠𝑡𝑎𝑙) and the change in volume of solution (Δ𝑉𝑠𝑜𝑙). These
changes resulted in a skewed reading of the 10.00 mL ± 0.01
mL graduated cylinder. Also, the trace amounts of amorphous
sucrose solution caused the structure to be less compact and uni-
form, resulting in a lower density.
CONCLUSION:
This experiment used DSC to investigate the temperature de-
pendence of sucrose’s (amorphous and recrystallized) thermo-
dynamic properties. For amorphous sucrose, the temperature
dependence of its heat capacity was investigated. For recrystal-
lized sucrose, the temperature dependences of the mass of crys-
tal formation, melting point, and density were investigated.
Nine total amorphous sucrose solutions were created at 85°C,
95°C, and 105°C (3 solutions per temperature). The heat capac-
ities of the amorphous sucrose solutions decreased as tempera-
ture increased. This trend is not reliable because it does not
agree with the established theory that sucrose’s heat capacity
increases as temperature increases1
. This was a result of the hot
plate not having a uniformly heated surface. The masses of the
recrystallized sucrose varied trial-to-trial (Table 2). These re-
sults are not reliable because amorphous sucrose solution was
still present within the crystals. These results were also not re-
liable because of mass loss due to extraction methods. The melt-
ing points of the recrystallized sucrose were about 10°C lower
than the melting point of commercial grade sucrose (Table 3).
These results were reliable because they were lower than the
melting point of commercial grade sucrose before nucleation.
The melting points of recrystallized sucrose observed were
lower because of impurities in the recrystallized sucrose8
. The
melting point was also lower because of structural changes4
.
The average density of recrystallized sucrose (1.5 g mL-1
± 0.2
g mL-1
) was lower than the density of the commercial grade su-
crose before nucleation (1.626 g mL-1
). This result is not relia-
ble because it does not agree with the established theory that the
density of a substance increases when impurities are intro-
duced8
. It is suspected that the recrystallized sucrose samples
did not dry completely, which lowered the average density. It is
also suspected that some recrystallized sucrose dissolved as
density was being determined.
REFERENCES:
1. Atkins, P., de Paula, J. Physical Chemistry: Thermo-
dynamics, Structure, and Change, Tenth Edition; W.
H. Freeman and Company: New York, NY, 2014.
2. Mathlouthi, M., Reiser, P. Sucrose: Properties and
Application; Blackie Academic and Professional:
Glasgow, Scotland, 1995.
3. Hartwell, R. W.; Ergun, R.; Vogel, S. Compr. Rev.
Food Sci Food Saf 2011, 10, 17 – 32.
5. 4. Lee, J. W.; Thomas, L. C.; Schmidt, S. J. J. Argic.
Food Chem. 2011, 59, 3311 – 3319.
5. Brown, M. E. J. Chem. Educ. 1979, 56, 310 – 313.
6. Roos, Y. H.; Karel, M.; Labuza, T. P.; Levine, H.;
Mathlouthi, M.; Reid, D.; Shalaev, E.; Slade, L. J.
Argic. Food Chem. 2013, 61, 3167 – 3178.
7. Lide, L. R. CRC Handbook of Chemistry and Phys-
ics; CRC Press: Boca Raton, FL, 1998.
8. Cate, W. E.; Deming, M. E. J. Chem. Eng. Data
1970, 15, 290 – 29
![mL of water in a 250 mL ± 25 mL beaker. A Type J iron-con-
stantan thermocouple has one end in the water and the other end
in an ice bath. Data was collected on a Data Acquisition card
(NI USB-6009, National Instruments) and recorded on a
MATLAB program that records temperature as a function of
time.
Nine total amorphous sucrose solutions were created at 85°C,
95°C, and 105°C (3 solutions per temperature). After recording
temperature as a function of time, the sucrose solutions were
allowed to cool for 10 to 15 minutes. Once cooled, wooden
skewers were dipped halfway in the solution and covered in su-
crose to form a seed for nucleation3
. The prepared skewers were
placed into the beaker without touching the bottom of the
beaker and secured with tape.
Crystals were not observed after 5 days because the solutions
were not supersaturated, as expected. To fix this, about 22 g of
commercial grade sucrose, measured with an analytical bal-
ance, was added to each solution. The volumes were reduced to
about 150 mL due to water loss from boiling.
The solution from Trial 1 for 85°C (85T1) was tampered with. It
was remade with reagent grade sucrose due to supply issues.
The volume of the new solution for 85TI was 175 mL. This so-
lution did not lose as much water due to boiling, compared to
the other trials.
Crystals formed mostly on the sides and bottom of the beakers
after 7 days. A small amount of crystals formed on the skewers.
The beaker was scraped with a scoopula to extract the remain-
ing crystals. The crystals were extracted from the remaining so-
lution with filter paper (Cat No 1001 055, Whatman) using vac-
uum filtration.
Only solution 85T1 was able to be vacuum filtered due to time
constraints. For the remaining solutions, each solution was
poured out of the beaker while keeping on the crystals intact on
the beaker. The crystals were scraped from the beaker, then
placed in weigh boats to air dry for a 7 days.
The dried crystals were weighted on an analytical balance to
determine the mass of crystal formation. Unknown amounts of
crystals from each trial were placed in separate capillary tubes
to prepare samples for a Melt Temp (1001D, Barnstead Interna-
tional). The reference melting point was determined by using
the Melt Temp on the commercial grade sucrose.
The densities of the crystals were determined by adding the
weighted amount of each crystal sample into 5.00 mL ± 0.01
mL of distilled water, measured with a 10.00 mL ± 0.01 mL
graduated cylinder, and recording the change in volume (Equa-
tion 1).
𝜌 =
𝑚 𝑐𝑟𝑦𝑠𝑡𝑎𝑙
𝛥𝑉𝑠𝑜𝑙
[1]
Where 𝜌 is the crystal’s density (g mL-1
), 𝑚 𝑐𝑟𝑦𝑠𝑡𝑎𝑙 is the mass
of crystals (g), and 𝛥𝑉𝑠𝑜𝑙 is the observed volume change when
the weighted amount of crystal sample was added to 5 mL ±
0.01 mL of distilled water (mL).
RESULTS/DISCUSSION:
DETERMINING HEAT CAPACITY
The data acquired to calculate heat capacity are in Table 1.
Table 1. Data obtained through differential scanning calorime-
try. Uncertainties include: ∆T ± 0.01°C from mercury thermom-
eter, 𝑚 𝐻2 𝑂 ± 1 g from 100 mL graduated cylinder, and 𝑚 𝑠𝑜𝑙. ±
0.001 g from analytical balance.
Differential scanning calorimetry requires the rate of heat trans-
fer to be spatially equivalent throughout a given time interval1
.
It was assumed that the heat transferred to the distilled water
was equal to the heat transferred to the sucrose solution. The
heat capacity of the solution was determined using Equation 2.
𝑄 = 𝑠𝑚∆𝑇 [2]
Where Q is the total heat transferred (J), s is the heat capacity
of the substance (J °C-1
g-1
), 𝑚 is the mass of the substance (g),
and 𝛥𝑇 is the temperature difference between the beginning and
end of each trial (°C).
Using Equation 2 and the assumption that the amount of heat
transferred to each beaker (1 beaker with solution and 1 beaker
with distilled water) is equivalent yields Equation 3.
𝑠𝑠𝑜𝑙 𝑚 𝑠𝑜𝑙 𝛥𝑇𝑠𝑜𝑙 = 𝑠 𝐻2 𝑂 𝑚 𝐻2 𝑂 𝛥𝑇 𝐻2 𝑂 [3]
Where 𝑠𝑠𝑜𝑙 is the heat capacity of the sucrose solution (J °C-1
g-
1
), 𝑚 𝑠𝑜𝑙 is the mass of the solution (g), 𝛥𝑇𝑠𝑜𝑙 is the change in
temperature of the solution (°C), 𝑠 𝐻2 𝑂 is the heat capacity of the
water (J °C-1
g-1
), 𝑚 𝐻2 𝑂 is the mass of water (g), and 𝛥𝑇 𝐻2 𝑂 is
the change in temperature of water (°C).
Rearranging Equation 3 yields Equation 4.
𝑠𝑠𝑜𝑙 =
𝑠 𝐻2 𝑂 𝑚 𝐻2 𝑂 𝛥𝑇𝐻2 𝑂
𝑚 𝑠𝑜𝑙 𝛥𝑇𝑠𝑜𝑙
[4]](data:image/gif;base64,R0lGODlhAQABAIAAAAAAAP///yH5BAEAAAAALAAAAAABAAEAAAIBRAA7)