
Recommended
More Related Content
What's hot
What's hot (20)
Similar to Catalyze Lab: Enzyme Reaction Temperatures
Similar to Catalyze Lab: Enzyme Reaction Temperatures (20)
Catalyze Lab: Enzyme Reaction Temperatures
- 1. Tang Chairatana IB Biology SL Period 8 Catalyze Lab Defining the Problem and Selecting Variables In this investigation, catalyze, which is an enzyme that breakdowns chemical reaction in human bodies, is being investigated. Temperature is the area being tested with the catalyze enzyme, which is, in this case the chicken liver. In this lab, equal amount of chicken liver is being added to the same amount of 3% H2O2 solution that was set in four different temperatures (3°C, 25°C, 45°C, and 60°C). This is the test to see which temperature will the catalyze enzyme works best at. The prediction would be that the enzyme reaction will work best at 45°C. Controlling Variables Concentration of substrate: same % of H2O2 solution was added to the same % of chicken liver or the ratio of 1:1. In this case, 5 ml of chicken liver is added to 5 ml of H2O2 solution. Ph level: By having the same amount of the two solutions, the pH level is the same Concentration of enzyme: same % of chicken liver was added to the same % of H2O2 solution or the ratio of 1:1. In this case, 5 ml of chicken liver is added to 5 ml of H2O2 solution. Volume of Container: test tubes have to be the same size every trial and test. In this lab, open- mouth test tubes are being used. Describing a Method for Collection of Data 1. Set up 12 test tubes in one test tube rack for 4 racks. In each test tube rack, 6 of the test tubes will be for the solution and another half will be for the enzyme. So be sure to know which on is for which. Each rack will be at different temperatures. 2. Pour 3% H2O2 solution into a 250 ml beaker. Just enough to fulfill all 24 test tubes. 3. Pour the chicken liver that has been grinded into a 250 ml beaker. Just about 1/8 of the beaker. Then added water to the beaker just enough to fulfill the rest of the 24 test tubes. Remembered to stir the chicken liver and the water till they mixed together well. 4. Used a pipette to measure the amount of solution and the enzyme so they are the same. In this case, an equal amount of both is 5 ml. The solution and the enzyme are being added to different test tubes that have been set up in the beginning.
- 2. 5. Set up a computer to logger pro and attach the gas pressure sensor lab to it in order to measure the gas pressure of the enzyme that will react in different temperatures. Temperature Observations 6. After all the set up, put each of the (°C) test tube rack that contained both 6 test tubes of 5 ml of the 3% H2O2 25(°C) Yellow, green color after solution and 6 test tubes of 5 ml of mixing with little bubble the chicken liver in different 45(°C) The color of the mixing temperatures which are in this case, solution was white and lots 3°C, 25°C, 45°C, and 60°C. of bubble 7. Leave the test tubes in different 3(°C) Little bubble temperatures for 30 minutes. 60(°C) White with some bubbles 8. After 30 minutes, check the temperature inside and outside of the test tubes with the thermometer in order to see whether the temperatures were the same or not. If not, wait a little more, then measured again. If yes, continued with the procedure. 9. Pour one of the chicken livers into one of the test tubes that contained the H2O2 solution. Put the gas pressure sensor lab on top of the test tube and click ‘collect’ in logger pro. This should be done within the temperature itself which means that do not take the test tube racks out of the water when measure. 10. Did it for every test tube in every temperature, record data and save the graph on logger pro Temperature Trial 1 (kPa/ Trial 2 (kPa/ Trial 3 (kPa/ Trial 4 (kPa/ Trial 5 (kPa/ (°C) s) ±0.01 s) ±0.01 s) ±0.01 s) ±0.01 s) ±0.01 25(°C) 21.57 12.99 17.52 23.56 25.45 45(°C) 37.53 29.83 44.08 59.85 35.03 3(°C) 0.63 0.46 0.23 0.45 0.06 60(°C) 2.82 1.41 4.08 1.22 1.68 11. Used only five trails of each temperature to make the table. To have six trials is just to have spares because one might be messed up. Recording Raw Data Table 1: Quantitative raw data of the enzyme reactions in different temperatures Table 2: Qualitative raw data of the enzyme reactions in different temperatures
- 3. Processing Raw Data Table 3: The average of the measurements of the enzyme reaction to different temperatures Temperatur Trial 1 Trial 2 Trial 3 Trial 4 Trial 5 Average e (°C) (kPa/s) (kPa/s) (kPa/s) (kPa/s) (kPa/s) (kPa/s) ±0.01 ±0.01 ±0.01 ±0.01 ±0.01 ±0.01 25(°C) 21.57 12.99 17.52 23.56 25.45 20.22 45(°C) 37.53 29.83 44.08 59.85 35.03 41.26 3(°C) 0.63 0.46 0.23 0.45 0.06 0.37 60(°C) 2.82 1.41 4.08 1.22 1.68 2.24 Sample Calculations: • Average o 45°C (37.53 + 29.83 + 44.08 + 59.85 + 35.03 + 41.26) / 5 = 41.26 Presenting Processed Data Graph 1: Trail 4 of an enzyme reaction VS. 25 °C temperature
- 4. Graph 2: Trial 4 of an enzyme reaction VS. 45 °C temperature Graph 3: Trial 3 of an enzyme reaction VS. 3 °C temperature Graph 4: Trial 4 of an enzyme reaction VS. 60 °C temperature
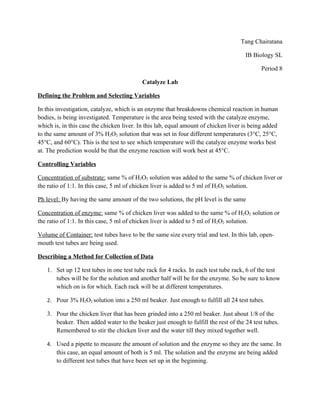
- 5. Graph 5: Average kPa/s of an Enzyme reaction to four different temperatures Caption: at 45 °C is the maximum point that an enzyme will work best at and lower than that will cause the enzyme to denature or stop working. Concluding Through the investigation, the conclusion of this lab was that according to graph 5 above, the enzyme worked best at 45 °C and the other temperatures were causing the enzyme to be denatured or slowing down till it stopped working. This also supported the prediction that the enzyme will work best at 45 °C because that was where the graph peaked. Evaluating Procedure
- 6. There are several weaknesses of this lab. The biggest concern in this lab was time. There was not enough time to do the lab. There should be more data in order to get accurate results. Also, the materials in this lab were not enough for everybody because one person if he or she was doing temperature has to use 48 test tubes at a time to complete the lab and there were like 13 students doing a lab at once. Moreover, having more temperatures to work on would have had more data to compare and see the results. Furthermore, 3% H2O2 solution was too strong to work with because closing the test tubes with the stoppers; they just popped out because the reactions were really fast. Improving the Investigation To improve this lab, 3-4 hours are needed to complete this lab because in order to collect more trails of each temperature, lots of time is needed. Also, lots of materials should be prepared, especially test tubes, to complete this lab because one person is going to need a lot to complete the lab in a given amount of time. Additionally, at least five temperatures should be worked on in order to see easier comparison among them. Moreover, only 1.5% of H2O2 solution is suggested using because greater percentage than this would make the reaction goes too fast.