
Recommended
More Related Content
What's hot
What's hot (20)
Similar to Gradually Varied Profile & Rapidly Varied Profile - Hydraulics And Hydraulics Machines
Similar to Gradually Varied Profile & Rapidly Varied Profile - Hydraulics And Hydraulics Machines (20)
Recently uploaded
Recently uploaded (20)
Gradually Varied Profile & Rapidly Varied Profile - Hydraulics And Hydraulics Machines
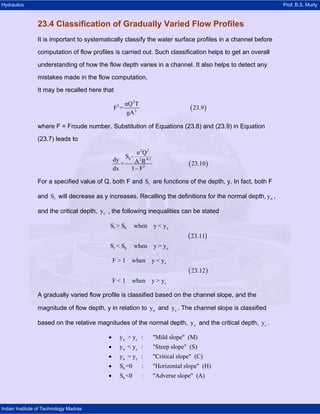
- 1. Hydraulics Prof. B.S. Murty Indian Institute of Technology Madras 23.4 Classification of Gradually Varied Flow Profiles It is important to systematically classify the water surface profiles in a channel before computation of flow profiles is carried out. Such classification helps to get an overall understanding of how the flow depth varies in a channel. It also helps to detect any mistakes made in the flow computation. It may be recalled here that ( ) 2 2 3 αQ T F = 23.9 gA where F = Froude number. Substitution of Equations (23.8) and (23.9) in Equation (23.7) leads to ( ) 2 2 0 2 4/3 2 n Q S - dy A R= 23.10 dx 1 F− For a specified value of Q, both F and fS are functions of the depth, y. In fact, both F and fS will decrease as y increases. Recalling the definitions for the normal depth, ny , and the critical depth, cy , the following inequalities can be stated ( ) f 0 n f 0 n S > S when y < y 23.11 S < S when y > y ( ) c c F > 1 when y < y 23.12 F < 1 when y > y A gradually varied flow profile is classified based on the channel slope, and the magnitude of flow depth, y in relation to ny and cy . The channel slope is classified based on the relative magnitudes of the normal depth, ny and the critical depth, cy . n c n c n c 0 0 y > y : "Mild slope" (M) y < y : "Steep slope" (S) y = y : "Critical slope" (C) S =0 : "Horizontal slope" (H) S <0 : "Adverse slo • • • • • pe" (A)
- 2. Hydraulics Prof. B.S. Murty Indian Institute of Technology Madras It may be noted here that slope is termed as "sustainable" slope when 0S 0> because flow under uniform conditions can occur for such a channel. Slope is termed as "unsustainable" when 0S 0≤ since uniform flow conditions can never occur in such a channel. Flow profiles associated with mild, steep, critical, horizontal, and adverse slopes are designated as M, S, C, H and A profiles, respectively. The space above the channel bed can be divided into three zones depending upon the inequality defined by equations (23.11) and (23.12). Figure 23.2 shows these zones for a mild and a steep channel. (a) Mild Channel (b) Steep Channel NDL: Normal depth line CDL: Critical depth line Figure 23.2: Profile Classification Zone - 1 Yc Yn 2 3 NDL CDL Bed Yc Yn 2 3 NDL CDL Bed 1 The space above both the CDL and the NDL is designated as zone-1. The space between the CDL and the NDL is designated as zone-2. The space between the channel bed and CDL/NDL (whichever is lower) is designated as zone-3. Flow profiles are finally classified based on (i) the channel slope and (ii) the zone in which they occur. For example, if the water surface lies in zone-1 in a channel with mild slope (Figure 23.3), it is designated as M1 profile. Here, M stands for a mild channel and 1 stands for zone-1. It may be noted that an M1 profile indicates a subcritical flow since flow depth, y is greater than the critical depth, cy .
- 3. Hydraulics Prof. B.S. Murty Indian Institute of Technology Madras Figure 23.3: M1 Profile M1 NDL CDL Bed Water Surface Similarly, an S2 profile (Figure 23.4) indicates the water surface lies in zone-2 in a steep channel. It may be noted that a S2 profile indicates a supercritical flow since flow depth, y is lower than cy . S2 Figure 23.4: S2 Profile CDL Water Surface NDL Bed Table 23.1 presents types of flow profiles in prismatic channels. In this table, a channel slope is described as critical slope when critical conditions occur for uniform flow i.e. when n cy y= . Table 23.1: Types of Flow Profiles (Sc: Critical Slope) Profile DesignationSlope zone - 1 zone - 2 zone - 3 Relative position of y Type of Flow Adverse S0 = 0 None A2 A3 y > yc y < yc Subcritical Supercritical Horizontal S0 = 0 None H2 H3 y > yc y < yc Subcritical Supercritical Mild 0<S0<Sc = 0 M1 M2 M3 y > yn > yc yn > y > yc yn > yc> y Subcritical Subcritical Supercritical Critical S0 = Sc > 0 C1 C2 y > yc = yn Subcritical uniform -
- 4. Hydraulics Prof. B.S. Murty Indian Institute of Technology Madras C3 y = yc = yn yc = yn > y critical Supercritical Steep S0 > Sc > 0 S1 S2 S3 y > yc> yn yc > y > yn yc > yn > y Subcritical Supercritical Supercritical 23.5 Variation of Flow Depth Qualitative observations about various types of water surface profiles can be made and the profile can be sketched without performing any computations. This is achieved by considering the signs of the numerator and the denominator in Equation (23.10). The following analysis helps to know (i) whether the depth increases or decreases with distance; and (ii) how the profile approaches the upstream and downstream limits. First, consider the following general points: • cy > y ; flow is subcritical; F<1 ; denominator is positive. • cy < y ; flow is supercritical; F>1; denominator is negative. • ny = y ; flow is uniform; f 0S = S ; numerator is zero. • n f 0y > y ; S < S ; numerator is positive. • n f 0y < y ; S > S ; numerator is negative. • As ny y→ (y tends to ny ); f 0S S ;→ f 0S S ;→ numerator approaches zero; dy 0; dx → the surface profile appraches normal depth asymptotically. • As cy y→ ; Flow tends to critical conditions; F 1;→ denominator tends to zero; dy ; dx → ∞ water surface profile approaches the critical depth vertically. It is not possible to have a vertical water-surface profile. Therefore, it is assumed that the water surface profile approaches the CDL at a very steep slope. It may be noted that when the water surface slope is very steep, it cannot be assumed that accelerations in the vertical direction are negligible. This means that the theory of gradually varied flow should breakdown in such a situation because pressure is no
- 5. Hydraulics Prof. B.S. Murty Indian Institute of Technology Madras longer hydrostatic in those regions. Thus equation (23.10) is not valid whenever flow depth is close to the critical depth. As f 0 dy y ; S 0; F 0; S ; dx → ∞ → → → Water surface profile becomes horizontal as flow depth becomes very large. For a wide channel, hydraulic mean radius R h≈ and 2 2 3 q F gy = . Equation (23.10) can be simplified to ( ) ( ) 3 10/3 2 2 0 10/3 3 2 gy S y -q ndy = dx y gy -q where q = flow rate per unit width. It can be seen from the above equation that dy dx → ∞ as y 0→ . In other words, water surface profile tends to become vertical as the flow depth tends to zero. The qualitative characteristic of any type of water-surface profile may be studied using the points discussed earlier. For example, consider an M1 profile. For an M1 profile, n cy>y >y . cy > y implies that F<1 and ny > y implies that f 0S < S . Therefore, 0 f 2 S -Sdy dx 1-F + = = = + + This means that flow depth increases with distance x. On the downstream side, as y keeps increasing dy dx tends to 0S and the water surface becomes horizontal. On the upstream side, as y approaches the normal depth, ny , it approaches asymptotically. The sketch of an M1 profile is shown in Figure 23.5.
- 6. Hydraulics Prof. B.S. Murty Indian Institute of Technology Madras ApproachesNDL asymptotically becomes horizontal Water Surface CDL Bed x Figure 23.5: Sketch of an M1 profile NDL Similarly, consider an M2 profile. In an M2 profile, n cy >y>y . cy > y implies that F<1 and the denominator is positive. On the other hand, ny<y implies that f 0S > S . Therefore, 0 f 2 S -Sdy Ve Ve dx 1-F Ve − = = = − + This means that flow depth decreases with distance x. On the downstream side, as the flow depth decreases and approaches the CDL, it approaches vertically. On the upstream side as the depth increases and approaches the normal depth, it approaches asymptotically. The sketch of an M2 profile is shown in Figure 23.6. Figure 23.6: Sketch of an M2 profile Water Surface NDL CDL Bed Now, Consider an S2 profile. In an S2 profile, c ny > y > y . cy < y implies that F>1 and the denominator is negative. ny > y implies that f 0S < S . Therefore, 0 f 2 S -Sdy Ve Ve dx 1-F Ve + = = = − − This means that flow depth decreases with distance x. On the downstream side, as y decreases towards ny it approaches NDL asymptotically. On the upstream side, as y increases toward Cy , it approaches CDL almost vertically. The sketch of an S2 profile is shown in Figure 23.7.
- 7. Hydraulics Prof. B.S. Murty Indian Institute of Technology Madras CDL NDL Bed Figure 23.7: Sketch of an S2 profile Water Surface Proceeding in a similar manner, other water surface profiles can be sketched. These sketches are shown in Figure 23.8. The profiles are shown in dashed lines as they approach the CDL and the channel bed to indicate that gradually varied flow assumption is not valid in those regions. Zone -1 M1 NDL CDL M2 NDL CDL M3 NDL CDL Zone -2 Zone -3MILD CRITICAL NDL / CDL C1 C2 C3 S1 S2 S3 CDL NDL NDL STEEP
- 8. Hydraulics Prof. B.S. Murty Indian Institute of Technology Madras HORIZONTAL CDL NONE CDL H2 H3 A3A2 NONE CDL Bed Figure 23.8: Water Surface Profiles ADVERSE