More Related Content
Similar to JLL Nashville employment update q1 2017 (20)
JLL Nashville employment update q1 2017
- 1. © 2017 Jones Lang LaSalle IP, Inc. All rights reserved. All information contained herein is from sources deemed reliable; however, no representation or warranty is made to the accuracy thereof.
Employment by industry
19%
16%
16%12%
11%
9%
6%
5%
4%2%
Educational & Health Services
Trade, Transportation & Utilities
Professional & Business Services
Government
Manufacturing
Leisure & Hospitality
Financial Activities
Other Services
Mining, Logging & Construction
Information
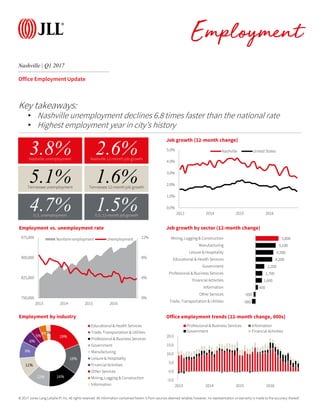
Nashville | Q1 2017
Employment
Office Employment Update
Job growth (12-month change)
Job growth by sector (12-month change)
Office employment trends (12-month change, 000s)
Employment vs. unemployment rate
4.7%U.S. unemployment
1.5%U.S. 12-month job growth
3.8%Nashville unemployment
2.6%Nashville 12-month job growth
5.1%Tennessee unemployment
1.6%Tennessee 12-month job growth
0.0%
1.0%
2.0%
3.0%
4.0%
5.0%
2013 2014 2015 2016
Nashville United States
-900
-500
600
1,600
1,700
2,200
4,200
4,500
5,100
5,800
-7,500 -5,500 -3,500 -1,500 500 2,500 4,500 6,500 8,500
Trade, Transportation & Utilities
Other Services
Information
Financial Activities
Professional & Business Services
Government
Educational & Health Services
Leisure & Hospitality
Manufacturing
Mining, Logging & Construction
-5.0
0.0
5.0
10.0
15.0
20.0
2013 2014 2015 2016
Professional & Business Services Information
Government Financial Activities
0%
4%
8%
12%
750,000
825,000
900,000
975,000
2013 2014 2015 2016
Nonfarm employment Unemployment
Key takeaways:
• Nashville unemployment declines 6.8 times faster than the national rate
• Highest employment year in city’s history
- 2. © 2017 Jones Lang LaSalle IP, Inc. All rights reserved. All information contained herein is from sources deemed reliable; however, no representation or warranty is made to the accuracy thereof.
Employment by industry
19%
16%
16%12%
11%
9%
6%
5%
4%2%
Educational & Health Services
Trade, Transportation & Utilities
Professional & Business Services
Government
Manufacturing
Leisure & Hospitality
Financial Activities
Other Services
Mining, Logging & Construction
Information
Nashville | Q1 2017
Employment
Industrial Employment Update
Job growth (12-month change)
Job growth by sector (12-month change)
Industrial employment trends (12-month change, 000s)
Employment vs. unemployment rate
4.7%U.S. unemployment
1.5%U.S. 12-month job growth
3.8%Nashville unemployment
2.6%Nashville 12-month job growth
5.1%Tennessee unemployment
1.6%Tennessee 12-month job growth
0.0%
1.0%
2.0%
3.0%
4.0%
5.0%
2013 2014 2015 2016
Nashville United States
-900
-500
600
1,600
1,700
2,200
4,200
4,500
5,100
5,800
-7,500 -5,500 -3,500 -1,500 500 2,500 4,500 6,500 8,500
Trade, Transportation & Utilities
Other Services
Information
Financial Activities
Professional & Business Services
Government
Educational & Health Services
Leisure & Hospitality
Manufacturing
Mining, Logging & Construction
-5.0
0.0
5.0
10.0
15.0
2013 2014 2015 2016
Trade,Transportation & Utilities Manufacturing
Other Services Mining, Logging & Construction
0%
4%
8%
12%
750,000
825,000
900,000
975,000
2013 2014 2015 2016
Nonfarm employment Unemployment
Key takeaways:
• Nashville unemployment declines 6.8 times faster than the national rate
• Highest employment year in city’s history