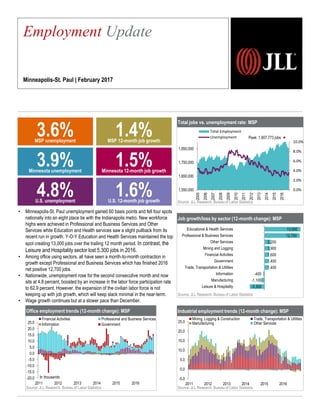
Minneapolis-St. Paul unemployment gained 60 basis points and fell four spots nationally into an eight place tie with the Indianapolis metro. New workforce highs were achieved in Professional and Business Services and Other Services while Education and Health services saw a slight pullback from its recent run in growth. Y-O-Y Education and Health Services maintained the top spot creating 13,000 jobs over the trailing 12 month period. In contrast, the Leisure and Hospitality sector lost 5,300 jobs in 2016.
Among office using sectors, all have seen a month-to-month contraction in growth except Professional and Business Services which has finished 2016 net positive 12,700 jobs.
Nationwide, unemployment rose for the second consecutive month and now sits at 4.8 percent, boosted by an increase in the labor force participation rate to 62.9 percent. However, the expansion of the civilian labor force is not keeping up with job growth, which will keep slack minimal in the near-term.
Wage growth continues but at a slower pace than December.
Minneapolis-St. Paul JLL employment update January 2017Carolyn Bates
Minneapolis-St. Paul maintains it’s fourth-lowest unemployment rate in the nation among all large metros, according to the most recent BLS estimates.
New workforce highs were achieved in Education and Health Services and Government while professional and Business services have seen a slight pullback from its recent run in growth. Y-O-Y Education and Health Services claims the top spot creating 9,700 jobs over the trailing 12 month period.
Among office using sectors, all have seen a month to month contraction in growth except information which maintains still a negative overall growth rate, losing 300 jobs Y-O-Y.
Nationwide, unemployment dropped by 30bp over the year to 4.7 percent. Declines in unemployment came as a result of a steadily increasing workforce, marginally boosting participation, and job growth outperforming the rate of expansion in the workforce.
Wage growth continues to outpace inflation, reaching highest rate of increase this cycle.
Minneapolis–St. Paul Employment Update | September 2016Carolyn Bates
Minneapolis-St. Paul has the second-lowest unemployment rate in the nation among all large metros, according to the most recent BLS estimates.
Financial services has reached its largest-ever employment count in MSP. The sector has seen steady gains since 2010 and even surpassed pre-Recession highs earlier this year. And once again, MSP achieved record-breaking employment totals for professional and business services, a fundamental component to the metro’s economic growth. Nearly 6,000 jobs have been added in the industry year-over-year.
Nationwide, 151,000 net new jobs were created in August, falling below the 250,000+ monthly additions over the previous two months. Although still at average levels of growth, August demonstrated the continued volatility of the labor market in 2016. Unemployment remained stable at 4.9 percent as growth in the workforce has aligned with employment gains. The Federal Reserve is likely to hold off on the next rate hike due to inconsistent monthly additions and weaker-than-expected wage growth.
Minneapolis–St. Paul Employment Update | August 2016Carolyn Bates
According to the most recent BLS estimates, Minneapolis-St. Paul’s unemployment has ticked up from last month’s 3.1%, yet still sits comfortably below the 4 percent mark. Having the second-lowest unemployment rate in the nation among all large metros offers its own challenges as employers prepare for a potentially looming talent shortage.
Once again, MSP achieved record-breaking employment totals for professional and business services, a fundamental component to the metro’s economic growth. Approximately 6,000 jobs have been added in the industry year-over-year.
The U.S. economy saw the addition of 255,000 net new jobs in July, the second consecutive month of healthy additions after a volatile first quarter and next to no growth in May.
Nationally, average weekly wages continue to rise at an annual clip of 2.6 percent, more than double inflation at 1.0 percent. This will boost disposable income and, in turn, personal consumption that drives GDP.
Minneapolis–St. Employment Update | April 2016Carolyn Bates
The Minneapolis-St. Paul metro has achieved its largest total employment and labor force in its history: 1.89 million people are now employed in the region, according to the most recent estimates available from the BLS.
Educational and health services were responsible for the largest share of Minneapolis-St. Paul’s 12-month employment growth, adding 11.3 thousand jobs. Continuing the trend of recent months, industrial sectors once again outperformed office sectors, contributing 25.4% of total growth compared to office’s contribution of 23.%.
At the national level, March employment growth was slightly lower than February, but still strong with 215,000 net new jobs. Unemployment ticked up slightly to 5.0 percent as labor force participation rose to 63.0 percent. At the subsector level, goods-producing segments such as manufacturing fell into contractionary mode, while education, health and retail continue to surpass professional and business services (PBS).
Minneapolis–St. Paul Employment Update | February 2016Carolyn Bates
According to the most recent estimates from the Bureau of Labor Statistics, total nonfarm employment in Minneapolis-St. Paul stood at 1.95 million payrolls, representing an annualized increase of 34,000 jobs or 1.8 percent.
MSP’s office-using sectors accounted for 44.7 percent of the 12-month total employment growth. Non-office sectors, in particular education and healthcare, were the largest job creators of 2015. And year-over-year, the industrial sectors experienced a job loss of 8.2 percent, largely due to contractions in trade, transportation & utilities.
At the national level, 2016 began on a relatively soft note, with only 151,000 net new jobs created during the month. In comparison, the six-month average totals 214,500 new jobs.
Hourly wage growth remains steady at 2.5 percent as inflation is flat and labor shortages, particularly for educated workers and in many metro areas, are becoming more apparent.
Minneapolis–St. Employment Update | March 2016Carolyn Bates
Minneapolis-St. Paul’s unemployment rose to 3.9 percent, according to the most recent estimates available from the BLS. Although still 100 basis points lower than the national rate, this month is the first time since July 2015 that the metro unemployment rate is higher than the state of Minnesota’s.
Industrial sectors were responsible for 26.7 percent of the 12-month total employment growth, outperforming office-using sectors which saw 19.6 percent of total growth. Trade, transportation, and utilities added 3,200 jobs year-over-year and drove the bulk of industrial growth throughout 2015.
Although national year-to-date figures are down compared to 2015, January saw significant upward revisions to 172,000 jobs, improving the year’s initial performance. Despite global tensions and economic shifts, the U.S. economy seems to be holding its own, although certain sectors such as energy and trade could be impacted by fluctuations in domestic and international demand.
Minneapolis–St. Paul Employment Update | October 2016Carolyn Bates
Minneapolis-St. Paul has the fifth-lowest unemployment rate in the nation among all large metros, according to the most recent BLS estimates.
Once again, MSP achieved record-breaking employment totals for professional and business services, a fundamental component to the metro’s economic growth. A net total of 8,300 jobs have been added in the industry year-over-year (Y-O-Y).
While office-using sectors were responsible for 31% of growth this month, educational and health services continue to drive regional employment gains and currently account for 39% of Y-O-Y job growth.
Nationwide, unemployment rose by 10bp to 5.0% in September on the back of rising labor force participation, which also saw a bump to 62.9%. At the same time, initial unemployment claims continue to fall, with the moving average resting near a cyclical low of 250,000 per week.
U.S. job openings have jumped by 3.9% over the year even as employment is only up 1.7%. This signals strong demand by employers but lagging labor force growth that is failing to keep up with demand.
After increasing in July, the local labor market contracted by 2,000 workers in August. Along with that employment held flat, still near a historic high. As a result, unemployment edged down 40 basis points to 3.3 percent.
U.S. employment update and outlook: December 2014JLL
November gain of 321,000 jobs confirms the strength of the recovery
The U.S. economy saw the growth of an additional 321,000 net new jobs in November. With revisions of earlier months' data, makes November the ninth consecutive month with gains surpassing 200,000 jobs.
Unemployment remained steady from the previous month at 5.8 percent. Total unemployment—which includes detached workers—dropped by 10 basis points to a recovery low of 11.4 percent, as the number of marginally detached workers slowly declines.
See more economic, office and real estate research at http://bit.ly/1s2tk4M
Minneapolis–St. Employment Update | May 2016Carolyn Bates
The Minneapolis-St. Paul metro’s unemployment rate ticked up slightly to 4.0% from 3.9% while the total labor force shrunk by nearly 3,000 jobs, according to the most recent estimates available from the BLS.
Educational and health services were responsible for the largest share of Minneapolis-St. Paul’s 12-month employment growth, adding 11.3 thousand jobs. Continuing the trend of recent months, industrial sectors once again outperformed office sectors, contributing 25.4% of total growth compared to office’s contribution of 23.4%.
At the national level, employment growth slowed sharply in April to 160,000 net new jobs, the lowest figure since early 2015. Slow job growth mirrored underwhelming GDP growth of 0.5 percent in Q1 2016. Although labor-market performance was disappointing in April, employee confidence in particular showed a very different story. A record 5.4 million job openings were recorded (+6.1 percent year-over-year) as companies seek to expand their headcounts to handle new demand for goods and services.
Minneapolis–St. Employment Update | December 2015Carolyn Bates
The local unemployment rate of 2.9% has hit its lowest point since 2001. Coupled with year-over-year labor force growth of 34.2 thousand jobs, Minneapolis-St. Paul currently has one of the strongest economies of any major metro in the United States.
As is typically the case, MSP’s office-using sectors dominated hiring by taking 48.0 percent of the 12-month total employment growth, while the industrial sectors experienced a loss of 1.8 percent.
At the national level, monthly growth of 211,000 jobs over the course of November represented the second consecutive month of rebound after a slowdown in mid-2015. At the current rate of growth, a mid-to-late-2016 timeframe seems likely for the first stage of tightening.
The size of the local labor force declined by 32,000 workers in August. That contraction caused the unemployment rate to decline 40 basis points to 5.7 percent.
U.S. employment showed a healthy return to growth in February with 242,000 net new jobs. Unemployment remained at 4.9 percent, but total unemployment dropped to just 9.7 percent—the lowest rate since before the recession.
U.S. employment update and outlook: January 2015 JLL
December recorded yet another strong month of employment growth. 252,000 net new jobs were added to the national economy, and unemployment dropped by an additional 20 basis points to 5.6 percent.
As a result, roughly 3.0 million jobs have been created over the course of 2014, and we expect this momentum to increase as we start off 2015.
See more economic, office and real estate research at http://bit.ly/1x52B8B
The local labor force remained flat in July as the influx of college graduates leveled off. That, coupled with a growth in employment caused the unemployment rate to decline 20 basis points to 6.1 percent.
Following 12 consecutive months of employment growth surpassing 200,000 jobs per month, the U.S. labor market slowed down in March, adding just 126,000 net new jobs. In turn, unemployment stayed stable at 5.5 percent, while total unemployment dropped by an additional 10 basis points to 10.9 percent.
Because external indicators, jobless claims and other labor market measures continue to trend in a positive direction, we believe March may have been an aberrant month, and expect further growth ahead.
The national labor market continues to add jobs and maintain the momentum gained over the past few quarters, with 295,000 jobs added in February alone. Year-to-date, the economy has already seen 534,000 new jobs and is poised to sustain this level of growth over the next 12 to 18 months as other macroeconomic indicators—from consumer spending to bond issuance to business investment—continue their upward trajectory.
Unemployment dropped by 20 basis points to 5.5 percent, also enabling the 30-basis-point drop in total unemployment—which includes those not actively seeking work—to 11.0 percent, down from 11.3.
U.S. employment rate data and trends: March 2014JLL
The U.S. economy added 192,000 jobs in March, a reversal from three months of slowing growth. Unemployment remained stable at 6.7 percent, but improved confidence increased the number of people looking for work. Total unemployment remains above historic norms at 12.7 percent, but 95 percent of jobs have been recovered since the recession. Positive signs include March growth being evenly distributed across industries and spreading more geographically. We expect continued positive momentum throughout 2014.
See details on the data, including demographic, geographic and industry breakdowns, in this report featuring research from the Bureau of Labor Statistics and JLL.
October 2015 U.S. employment update and outlookJLL
September’s jobs figures were below expectations, with only 142,000 jobs added and August downwardly revised to 136,000. Although some of this may be attributed to seasonality, strong external fundamentals signal that slower figures may be the result of an impending talent crunch.
Chairs take up a large part of your living space, they also can offer comfort after a long hard day, a romantic corner for a couple catching up or simply a welcoming seat after a big night out, embracing you and your Sunday of hangover movies and comfort food…. whatever they’re needed for, Chairs are like old friends, they’re always there, we may not always need them, but when we do they’re familiar, comfortable and always inviting! Have a look at our thorough selection of chairs for all occasions and décor- you’ll find there’s something for everyone’s taste!
Minneapolis-St. Paul employment update | December 2016Carolyn Bates
•Minneapolis-St. Paul has the fourth-lowest unemployment rate in the nation among all large metros, according to the most recent BLS estimates.
•Once again, MSP achieved record-breaking employment totals for professional and business services, a fundamental component to the metro’s economic growth. A net total of 8,800 jobs have been added in the industry year-over-year (Y-O-Y).
•While office-using sectors were responsible for 52% of growth this month, educational and health services continue to drive regional employment gains and currently account for 37% of Y-O-Y job growth.
•Nationwide, unemployment dropped by 30bp to a cyclical low of 4.6 percent. This is possible by consistent job growth and a slight decline in the labor force participation rate to 62.7 percent.
•With continued wage growth and inflation now at 1.6 percent, nearing the Federal Reserve’s 2.0-percent target and unemployment at its lowest point since August 2007, the stage has been set for a rate hike by the end of the year.
According to the most recent estimates from the Bureau of Labor Statistics, total nonfarm employment in Cleveland increased by 17,700 jobs or 1.7 percent year-over-year. Meanwhile, unemployment decreased 20 basis points year-over-year to 6.4 percent.
Minneapolis–St. Paul Employment Update | July 2016Carolyn Bates
This year has been filled with milestones for the Minneapolis-St. Paul economy, and once again the metro has achieved its largest ever employment count and labor force: 1.91 million and 1.97 million, respectively.
Additionally, this month marked Minneapolis-St. Paul’s peak employment in professional and business services, a fundamental component to the metro’s economic growth. Over 4 thousand jobs have been added month-over-month, an impressive gain after an addition of 8,500 jobs last month.
At the national level, June saw 287,000 net new jobs added to the U.S. labor market, a return to healthy growth after a weak May that saw gains revised downward to just 11,000 jobs. This is the highest monthly figure in eight months and will be reassuring to decision makers such as the Federal Reserve.
High-performing markets across the U.S. have seen and expect further slowdowns in the rate of job growth as employers run up against talent shortages–a challenge that is especially pertinent to Minneapolis-St. Paul.
According to the most recent estimates from the BLS, total nonfarm employment in Cincinnati stood at ~1.07 million payrolls, representing an annualized increase of 28,400 jobs or 2.7 percent.
Minneapolis–St. Paul Employment Update | January 2016Carolyn Bates
The local unemployment rate of 2.7% has once again hit its lowest point since 2001. Coupled with a monthly labor force growth of 10.3 thousand jobs, Minneapolis-St. Paul currently has one of the strongest economies of any major metro in the United States.
As is typically the case, MSP’s office-using sectors dominated hiring by taking 34.9 percent of the 12-month total employment growth, while the industrial sectors experienced a gain of 8.1 percent.
At the national level, 2015 ended on a very high note, with December gaining 292,000 net new jobs and revisions in October and November resulting in a three-month increase of 851,000 jobs.
The national rise in hourly earnings by 2.5 percent is significantly more meaningful, which will likely lead to accelerated GDP growth from the end of 2015 and into 2016 as consumer spending elsewhere pushes up the largest component of output: personal consumption expenditures.
Minneapolis–St. Employment Update | November 2015Carolyn Bates
The local labor force has declined slightly since July’s peak, but year-over-year numbers show an increase of over 35,000 non-farm jobs since September 2014.
As is typically the case, MSP’s office-using sectors dominated the hiring by taking 45.9 percent of the 12-month total employment growth while the industrial sectors accounted for 2.3 percent of the annual growth.
February 2016 U.S. employment update and outlook JLL
The labor market recorded a soft opening to 2016, adding only 151,000 new jobs, although unemployment fell below 5.0 percent for the first time since 2008.
U.S. unemployment rate data and trends: February 2014JLL
U.S. economy added 175,000 jobs in February, representing below-average growth but exceeding some expectations. The unemployment rate increased 10 basis points to 6.7 percent, causing some to blame this winter’s frigid weather on halted growth. Unemployment for high school and college graduates remains lower, and labor force participation among this key demographic is up, though still suppressed. Total unemployment remains above historic norms at 12.6 percent.
See details on the data, including demographic, geographic and industry breakdowns, in this report featuring research from the Bureau of Labor Statistics and JLL.
U.S. unemployment rate data and trends: December 2013 JLL
After adding 74,000 jobs in December, the U.S. unemployment rate fell 30 basis points to 6.7 percent—though total unemployment, which includes individuals who have stopped actively seeking jobs, stuck at 13.1 percent. The economy has recovered 86.5 percent of jobs lost in the downturn and we’re now 0.9 percent below previous peak unemployment, with office-using employment 47.1 percent higher than the previous peak.
See details on the data, including demographic, geographic and industry breakdowns, in this report featuring research from the Bureau of Labor Statistics and Jones Lang LaSalle.
U.S. employment update and outlook: November 2014JLL
October records another month of 200,000+ job gains
The U.S. economy saw the addition of 214,000 net new jobs in October. With revisions of earlier months’ data, this makes October the eighth consecutive month with gains surpassing 200,000 jobs.
This steady expansion has helped to push down unemployment, which fell by 10 basis points to 5.8 percent. Total unemployment—which includes detached workers—dropped by 30 basis points to a recovery low of 11.5 percent, also below the long-term average.
See more economic, office and real estate research at http://bit.ly/1wCNyXQ
October 2016 U.S. employment update and outlookJLL
While September saw relatively average job growth, market fundamentals are steady and momentum remains as wage growth rose once again and consumer confidence continued its rise.
November 2015 U.S. employment update and outlookJLL
October saw the labor market return to form after a two-month slowdown, adding 271,000 net new jobs across industries, in turn bringing down unemployment to 5 percent, the lowest rate seen during the recovery so far.
Notable over the past few months has been a rise in wages in an otherwise low-inflation environment, which will boost the personal expenditures component of GDP in the coming quarters.
U.S. employment update and outlook: October 2014JLL
Unemployment dips to 5.9 percent in September—its first time below 6.0 percent during the recovery.
The U.S. economy got back on track in September, bouncing back from a sluggish August with 248,000 net new jobs. Growth occurred across sectors and geographies, with office-using industries in particular benefiting from improved corporate confidence leading to permanent hiring.
Total unemployment, which includes discouraged and marginally detached workers, also declined slightly to 11.8 percent, bringing it below the 10-year average.
With numerous other employment metrics all pointing up—including job openings, voluntary quits and CEO confidence—sentiment will only become more optimistic over the coming months.
See more real estate and economic research at: http://bit.ly/1vIGt6m
December 2015 U.S. employment update and outlookJLL
Employers added 211,000 net new jobs in November, but the unemployment rate remained at 5 percent. The Federal Reserve's anticipated interest rate hike is now very likely.
Similar to Minneapolis-St. Paul Employment Update | February13, 2016 (20)
Minneapolis-St. Paul Chart of the Week | February 22, 2016Carolyn Bates
For nearly a century, bars within the City of Minneapolis were restricted to Liquor Patrol Limits encompassing the oldest neighborhoods adjacent to the Mississippi River and those most populated by immigrants. Even after the end of Prohibition in 1934, Minneapolis reinstated its patrol limits which were not repealed until 1974. Bars that were within the city but outside of the patrol areas could serve only low-alcohol or 3.2 percent beer.
•The recent purchase of the Sunrise Inn in South Minneapolis is the beginning of the end of an era. The only 3.2 bar that remains is the T-Shoppe Bar in North Minneapolis’ Camden neighborhood.
•Coupled with the impending repeal of the 159-year-old Sunday liquor sales ban, the future earning potential for Minneapolis’ hospitality and retail sectors looks rosy.
Minneapolis-St. Paul Chart of the Week | February 10, 2017Carolyn Bates
The Macy’s building is among many other buildings in the Minneapolis CBD that are currently undergoing decisions about future usage. Wells Fargo’s move out of Northstar and Baker Block in 2016 has already prompted the consideration of renovation versus conversion into other uses.
Baker Block and the TCF Bank Building are undergoing remodels that will increase tenant amenities and add features more typical of creative office like open floorplates and raised ceilings.
Additional opportunities will hit the market when YMCA relocates its facilities and office operations to Gaviidae and when Art Institutes International closes its downtown campus in the LaSalle Building.
Minneapolis-St. Paul Chart of the Week | January 27th, 2017Carolyn Bates
The record setting sale of the City Center office building in 2016 purchased by Chinese investor HNA Group opened the door for increased overseas investment within the Minneapolis CBD.
The year failed to provide high value transaction volume among apartment buildings compared to the year prior.
Notable hotel transactions however remained within close proximity to records with the second sale of the Hilton Towers within the last 6 years.
A final price for the upcoming sale of the Macy’s building has yet to be released, however it is expected to clear the high-water mark for retail transactions set in 2013 when the Gaviidae Commons closed for $26.5M.
Minneapolis-St. Paul Chart of the Week | January 16th, 2017Carolyn Bates
According to preliminary Q4 2016 numbers from RCA, total foreign investment into U.S. commercial real estate declined since its peak in 2015. However, as coastal markets are seeing their cross-border deal flow tighten, Midwest markets like Minneapolis-St. Paul are benefiting from more affordable inventory and less volatile economic growth.
In the final quarter of 2016, Shorenstein Properties sold 33 South Sixth Street to Chinese investor HNA Group for $315 million. This was the largest office sale in Minneapolis’ history. The opportunity for additional foreign direct investment (FDI) will escalate as Asian and European firms seek real estate investments in growing, stable markets.
Minneapolis Chart of the week January 12th, 2017Carolyn Bates
Over the last year and into 2017 three retailers each occupying 20,000 square feet or more have announced their departure from the downtown CBD, adding to vacancy totals.
The recent acquisition, and plan to redevelop former Macy’s building eludes to a market consensus where the excess space will be best suited as diversified mixed uses.
Minneapolis-St. Paul Chart of the Week | December 12, 2016Carolyn Bates
Many factors support metro transit ridership, lack of parking at a place of work is certainly one. Where there is a low ratio of available parking to number of workers there is a workforce highly dependent on metro transit. The opposite exists, as visualized above, where space abounds and parking is available.
As the gradient fades from purple to green, overall ridership numbers are visualized, while marker sizes depict a workplace’s total available parking capacity divided by the number of workers to create a normalized ratio
Minneapolis-St. Paul Chart of the Week | December 5, 2016Carolyn Bates
Metro-region shoppers are planning to spend $918 per household this holiday season, the highest amount since the St. Thomas Holiday Sentiment Survey began 15 years ago. The average is up $68 or 8 percent over last year. It is predicted that that Minneapolis-St. Paul residents will spend a cumulative $1.24 billion this holiday season.
Minneapolis-St. Paul Chart of the Week | November 28, 2016Carolyn Bates
Last year, over 37 percent of residents in the Twin Cities volunteered, with more than 1 million people giving 88.4 million hours of service worth about $1.9 billion. Increased civic engagement in communities is linked to lower crime rates, lower rates of mental and physical illness, improved academic outcomes for children, and improved employment outcomes for job seekers.
Minneapolis-St. Paul Chart of the Week | November 14, 2016Carolyn Bates
Data released from the Minnesota Department of Employment and Economic Development (DEED) paints a picture of the current demand for workers in the Minneapolis Metro Area, also providing wage data by industry.
This chart takes a look at the ratio between available jobs as of Q2 2016 and the median wage paid. This look allows for high level snapshot into the balance of employer demand for workers and the wages workers are willing to accept, within the Twin-Cities Metro.
Overall DEED reports 1.2 unemployed person for each vacancy, equivalent to 2015 - which indicates a stable labor market within the State.
Minneapolis-St. Paul Chart of the Week | November 7, 2016Carolyn Bates
Minnesota’s population is among the most trusting of its state government and is the largest state to have a confidence rate of more than 66%, according to a recent Gallup poll.
There is a strong positive relationship between residents' ratings of their state's economy and their confidence in state government. Certainly an unemployment rate of 4.0%, among the lowest in the nation, is an important factor in Minnesotan’s high confidence in their state government.
JLL Minneapolis-St. Paul Chart of the Week | October 31, 2016Carolyn Bates
This fall, T3 was the first speculative office development to deliver in Minneapolis since the Recession. What will break ground next? United Properties, Schafer Richardson, Hines, Swervo and CPM Cos. all have proposed developments in the North Loop. It’s only a matter of time until one lands a cornerstone tenant and construction begins again.
Minneapolis-St. Paul Chart of the Week | October 24, 2016Carolyn Bates
Office product in the CBD area northwest of Nicollet Mall has historically performed better than the southeastern part of the CBD, and that trend has only become more pronounced. Even with T3 delivering fully vacant this quarter, total vacancy on the northwest side of Nicollet is 0.9 million square feet (m.s.f.) with an average building vacancy rate of 12.3%. Comparatively, to the southeast of Nicollet Mall, total office vacancy is 2.9 m.s.f. and the average building vacancy rate is 16.9%.
Minneapolis-St. Paul Chart of the Week | October 17, 2016Carolyn Bates
Hotel development is finally on track to meet demand in the Minneapolis CBD. It is expected that more than 2,000 rooms will be delivered in the next few years. AC Marriott and Embassy Suites opened within the last month along Hennepin Ave; Radisson Red was recently completed near the US Bank Stadium. The Nordic-themed 124-room Hewing Hotel in the North Loop is slated to open in November.
Thresher Square and Federal Plaza were both formerly used for office. After recent acquisitions, the historic buildings will be respectively redeveloped into a Canopy by Hilton and a new boutique inn.
Minneapolis-St. Paul Chart of the Week | October 10, 2016Carolyn Bates
Los Angeles-based Colony Capital REIT spent $62.5 million for four bulk warehouse properties totaling just over 899,000 square feet and averaging $69.57 per square foot (p.s.f.). TA Realty of Boston was the seller. The trade, which occurred in early July, greatly boosted local industrial sales for Q3 to a total of $206.2 million and made it the highest performing quarter year-to-date.
The four transacted properties included Xenium Distribution Center in Plymouth, Highway 55 Distribution Center in Eagan, Minnesota Valley Distribution Center II in Shakopee, and 6240 Carmen in Inver Grove Heights.
Minneapolis-St. Paul Chart of the Week | October 3, 2016Carolyn Bates
Currently, just over 12,000 people living in the Minneapolis CBD are 20-34 years old and make up the largest share of the total population of 29,200. In the next five years, the share of Millennials living downtown is expected to grow to 45% of the total population. Within the same timeframe, the average household income among downtown dwellers is expected to jump from $85,000 to $95,000. The Minneapolis CBD includes the North Loop neighborhood, which Forbes recently ranked among its Top Ten “Best Cities and Neighborhoods” for Millennials.
Minneapolis-St. Paul Chart of the Week | September 19, 2016Carolyn Bates
Although the third quarter of 2016 only saw four transactions for office buildings at least 50,000 square feet in size, the average price per square foot increased 82 percent quarter-over-quarter. This is largely due to the sale of Ameriprise Financial Center, which sold for $200 million to Florida-based Morning Calm Management at the end of August. The transaction is the largest deal of the year, surpassing the $82 million sale of PwC Plaza (formerly known as Plaza Seven) back in June.
Expect more transaction volume in Q4, as there are already four pending sales totaling $37.7 million.
Minneapolis-St. Paul Chart of the Week | September 12, 2016Carolyn Bates
From 2010 to 2015, Minneapolis-St. Paul added 169,043 net new people to its population total, a growth rate of 5.0 percent. The average growth rate for all U.S. metros during that same period was 4.6 percent. MSP’s gains are largely due to a healthy ratio of births to deaths and an increase in foreign immigration.
In general, metro areas in the Midwest and Northeast are seeing slower population growth than the rest of the nation, particularly compared to the South. Minneapolis-St. Paul’s Midwest peers like Chicago, St. Louis, and Detroit all saw single-digit growth over the last five years.
US Technology Outlook | Minneapolis | JLL | 2016Carolyn Bates
The Minneapolis-St. Paul metro has a unique mix of technological innovation across very diverse industries, including life sciences, retail, and food. Meanwhile, national VC firms have been branching outside of medical devices (MSP’s traditionally strongest tech cluster) when seeking investment opportunities, including local solar panel manufacturers and “Internet of Things” apps. As awareness of MSP’s highly-productive tech economy grows, new occupiers (particularly from more costly real estate markets) will continue to enter the market either via acquisitions or strategic expansion into the Midwest.
Minneapolis-St. Paul Chart of the Week | August 29, 2016Carolyn Bates
It is widely reported that healthcare will be one of the fastest growing sectors nationwide due to an aging population, and the state of Minnesota is no exception.
Of twenty-two major occupations, DEED projects Minnesota will outperform the nation in job creation on only three: personal care; farming, fishing, and forestry; and production. However, considering that Minnesota already has one of the highest labor force participation rates in the nation and slower-than-average population growth, it is no surprise that other less-developed states will grow at a faster pace.
Minneapolis-St. Paul Chart of the Week | August 22, 2016Carolyn Bates
Nearly a quarter of a million people in Minneapolis-St. Paul are pursuing a higher education degree. The University of Minnesota alone has over 50,000 enrolled students.
The MSP metro consistently ranks among the most educated places in the U.S. Nationwide, 29 percent of adults have at least a bachelor’s degree, a full 10 percentage points below Minneapolis-St. Paul’s attainment levels. And among younger MSP residents (25 to 44 years old), approximately 45 percent have at least a bachelor’s degree, substantially greater than the national average of 32 percent.
Scanning tenants in NYC requires a thorough and compliant approach to ensure you find reliable renters. For a positive rental experience, consider hiring a property management service. Belgium Management LLC specializes in NYC rental property management and tenant relationship management. We prioritize tenant satisfaction, making us a trusted name in New York property management. Our dedicated team ensures tenants feel valued and supported throughout their lease.
The SVN® organization shares a portion of their new weekly listings via their SVN Live® Weekly Property Broadcast. Visit https://svn.com/svn-live/ if you would like to attend our weekly call, which we open up to the brokerage community.
The KA Housing - Catalogue - Listing TurkeyListing Turkey
Welcome to KA Housing, a distinguished real estate development nestled in the heart of Eyüpsultan, one of Istanbul’s most promising districts.
Just 10 minutes from the bustling city center, Eyüpsultan offers a serene escape with the convenience of urban living. The direct metro line ensures seamless connectivity to all parts of Istanbul, making it an ideal location for residents who seek both tranquility and vibrancy.
KA Housing boasts unparalleled accessibility, with proximity to Istanbul Airport only 30 minutes away, facilitating easy international travel. Effortless city access is guaranteed by direct metro and transportation links to Istanbul’s cultural and commercial hubs. Quick access to key metro lines connects you to every corner of the city within minutes, making commuting and exploring the city hassle-free.
The development offers luxurious living spaces with a range of unit layouts from 1+1 to 4+1, designed with meticulous attention to detail. Each unit features balconies or terraces, providing stunning vistas of Istanbul and enhancing the living experience. High-quality materials and superior craftsmanship ensure durability and elegance, while sound-proof insulation and high ceilings (2.95 m) offer comfort and sophistication.
Residents of KA Housing enjoy exclusive on-site amenities, including a state-of-the-art gym, outdoor swimming pool, yoga area, and walking paths. Entertainment options abound with a private cinema, children’s playground, and a variety of dining options including a café and restaurant. Security and convenience are paramount with 24/7 security, a dedicated carpark garage, and an IP intercom system.
KA Housing represents a prime investment opportunity with limited availability in a high-demand area, ensuring enduring value and potential for lucrative returns. Homes in this development provide exceptional value without compromising on quality, offering affordable luxury for discerning buyers. The construction is of the highest quality, built to the latest seismic and disaster resistance standards, ensuring safety and resilience.
The community and surroundings of KA Housing are enriched by close proximity to prestigious universities such as Haliç University, Bilgi University, and Istanbul Ticaret University, making it an ideal location for students and academics. The development is adjacent to the Alibeyköy stream leading into the Halic waters, offering serene natural escapes amidst lush greenery. Residents can enjoy the cultural richness of the area, surrounded by historical and cultural landmarks that blend leisure, nature, and culture seamlessly.
https://listingturkey.com/property/the-ka-housing/
One FNG by Group 108 Sector 142 Noida Construction UpdateOne FNG
One FNG by Group 108 is launching a new commercial project in Sector 142 Noida. Office space and high street retail shops on the FNG and Noida Expressway. For more information visit the website https://www.onefng.com/
Investing In The US As A Canadian… And How To Do It RIGHT!! (feat. Erwin Szet...Volition Properties
=== Investing In The US As A Canadian… And How To Do It RIGHT!! (feat. Erwin Szeto) ===
Ever been curious about Real Estate Investing in the US?? At Volition, for the past 14 years, we have been focused on helping investors invest in over $250M of real estate and generate $100M of wealth in the Toronto market, but we are always open to learning more about other business models and learning from other investors.
The US has always been an intriguing market to invest in. But the US is a big place… if you’re interested in investing in the US, you probably have a lot of questions, like:
☑️ Specifically WHERE should you invest?
☑️ What are the best markets to invest in and why?
☑️ How much are property prices there?
☑️ What are the returns like?
☑️ What is cashflow like?
☑️ Compared to investing in Toronto or other cities in Ontario, what are the benefits / tradeoffs?
☑️ What ownership structure should I use?
☑️ What are the tax implications?
☑️ Can I get financing?
☑️ What are tenants like?
Enter Erwin Szeto, a longtime friend of Volition. Since 2005, Erwin Szeto and his team have navigated the challenging landscape of being landlords in Ontario. Now, they are shifting their focus and guiding their clients' investments toward the more landlord-friendly environment of the USA. This decision comes after assisting Canadian clients in transacting over $440,000,000 in income properties. Faced with issues like affordability constraints, tenant-friendly laws, rent control, and rental licensing in Canada, Erwin sees a clear opportunity in the U.S. Here, there is a significant influx of investments leading to the creation of high-paying manufacturing jobs. Erwin and his clients are poised to capitalize on these opportunities where landlord rights are stronger and there is no rent control.
To facilitate this transition, Erwin has partnered with and become a client of SHARE, a one-stop-shop U.S. Asset Manager. Founded by Canadians for Canadians, SHARE enables as passive an ownership experience as possible for landlords in the U.S., while still maintaining direct, 100% ownership.
Erwin is “Making Real Estate Investing Great Again”!!
Website: https://www.infinitywealth.ca/
Facebook: https://www.facebook.com/iwinrealestate and https://www.facebook.com/ErwinSzetoOfficial
Podcast: https://www.truthaboutrealestateinvesting.ca/
Instagram: https://www.instagram.com/iwinrealestate/ and https://www.instagram.com/erwinszeto/
Sense Levent Kagithane Catalog - Listing TurkeyListing Turkey
Sense Levent offers a luxurious living experience in the heart of Istanbul’s vibrant Levent district.
This cutting-edge development seamlessly integrates modern design with natural elements, featuring live evergreen plants maintained by an advanced irrigation system, ensuring lush greenery year-round.
The building’s elegant ceramic balconies are both stylish and durable, enhancing the overall aesthetic and functionality. Residents can enjoy the 700m Sky Lounge, which provides breathtaking views of Istanbul and a perfect space to relax and unwind.
Sense Levent promotes a healthy and active lifestyle with a full gym, swimming pool, sauna, and steam room, all available in the building. The interiors are crafted with high-quality materials, ensuring a luxurious and inviting living space.
Designed with young professionals in mind, Sense Levent features 1+1 and 2+1 units with smart floor plans and balconies. The project promises high investment returns, with an expected annual return of 6.5-7%, significantly above Istanbul’s average ROI.
Located in the rapidly growing and highly desirable Levent area, the development benefits from ongoing urban regeneration projects. Its prime location offers proximity to shopping malls, municipal buildings, universities, and public transportation, adding immense value to your investment.
Early investors can take advantage of discounted units during the construction phase, with an expected capital appreciation of +45% USD upon completion. Property Turkey provides comprehensive rental management services, ensuring a seamless and profitable investment experience.
Additionally, robust legal support and significant tax advantages are available through Property Turkey’s licensed Real Estate Investment Fund. Levent is a dynamic urban hub, ideal for young professionals with its numerous corporate headquarters and shopping malls.
Sense Levent is more than just a residence; it’s a place where dreams and opportunities come to life. Contact us today to secure your place in this exclusive development and experience the best of Istanbul living. Sense Levent: Sense the Opportunity. Live the Dream.
https://listingturkey.com/property/sense-levent/
Flat available for sale
Location- Tupudana, Ranchi
Savitri enclave
Area- 3BHK
Rate- 4000/sq.ft.
Super Build Up Area-1629 sq.ft.
Build-up area-1253 sq.ft.
Rate- 65lakh16k(approx)
Floor available- Flat available in all floor(G+12)
Balcony- 2
Washroom- 2
Parking - CAR PARKING
Amenities- Joggers track,temple, children's park,gym,banquet hall (5 Lakh)
Possession year (Handover year)- Dec 2025
Outside View from the apartment and flat balcony is very beautiful.
For more information contact AASHIYANA STAR PROPERTIES
7766900371
500 acres of brilliance await you here at Riverview City which offers modern living, effortless convenience, and a beautiful natural setting. It is a mega township by Magarpatta City in Loni Kalbhor, Pune. Enjoy easy access to work, schools, and fun while experiencing a perfect work-life balance.
Visit - magarpattacity.developerprojects.in
Presentation to Windust Meadows HOA Board of Directors June 4, 2024: Focus o...Joseph Lewis Aguirre
Presentation to Windust Meadows HOA Board of Directors June 4, 2024: Focus on Public Safety as Job #1, Engagement, Wealth of HOA, Branding, Communication, Culture, Civic Responsibility
Torun Center Residences Istanbul - Listing TurkeyListing Turkey
THERE IS LIFE IN ITS CENTER!
The most energetic spot of the city that will add utterly different pleasures to your life, with a park that will make Istanbul breathe, delighting indoor and outdoor bistros, cafes, restaurants, the brand-new Food Hall concept, where dozens of unique tastes are served together, market area, cinema, theater, fitness club, SPA and event venue...
All the pleasures that will enrich your lives are awaiting you on the most beautiful side of the city, at Torun Center Residences. In Mecidiyeköy, where the heart of Istanbul beats, business, life and entertainment opportunities are located at the exact center, at Torun Center, the most beautiful side of the city.
Penthouse apartments and different styles of flats from 1 + 1 to 4 + 1, from 100 to 425 square meters in a 42-story residence tower, have been designed for those who want to live in the center of magnificence. Torun Center is the redefinition of a better life with specially landscaped floor gardens, apartment options with private balconies, and automatic glass systems equipped with Trickle Ventilation that offers clean air comfort.
Business and life in the same place
Excellent service
Torun Center has many delightful details, from a swimming pool to sunbathing and resting terrace. With 24/7 concierge services, 24/7 security, valet, technical service, closed-circuit camera system (CCTV), central heating and cooling system, it makes your life easier.
Delightful details
The two-story Torun Center Lounge, with its indoor and outdoor seating areas, children's playroom, private dining and TV lounge, promises unforgettable memories to you and your loved ones with its unique Istanbul view.
Neighboring to the most pleasant square of Istanbul
A few steps from the Torun Center Residences, you can reach the city's most modern city square and open the doors of a quality city life. Torun Center Residences brings together on the same project the long-awaited city life for Istanbul and gourmet restaurants, cafes, gym and SPA, and state-of-the-art cinema and Artı Stage, hosting the most famous plays of the season.
Located at the intersection of alternative public transportation options such as the metro and Metrobus, Torun Center comes to the fore as the most accessible office for both sides of Istanbul. With a central location and rich transportation lines, Torun Center offices make life easier for employees and increase productivity.
Lixin Azarmehr, a Los Angeles-based real estate development trailblazer, co-founded JL Real Estate Development (JL RED) in 2015 and serves as its CEO. Her expertise has propelled the firm to specialize in luxury residential and mixed-use commercial projects, with a portfolio that features upscale retail spaces and sophisticated care facilities.
Simpolo Tiles & Bathware
Tile ho,
toh Simpolo.
Since the first steps were taken in 1977, Simpolo Ceramics has carved its niche as a consistently growing organisation with unparalleled innovation and passion rooted in simplicity.
We endure gratification for every experience we offer, created to share something meaningful. It may not resonate with the majority, but that makes us a class apart. If only a handful were to understand the purpose of our existence, we would be proud to have found our believers. Rather, people with whom we can share our beliefs.
VISUALIZER
Design your space in your style with our very own Visualizer. Now, you can choose the tiles of your liking from our wide selection and see how they would look in a space. Select the tile from the multiple options and the visualiser will replace the surfaces in the image with the selected tiles. This way, instead of just your imagination, you can choose the tiles for your place by getting an actual picture of how they would look in a space. So, design your space the way you desire digitally and implement it in real life to get the best results!
You can also share this visualiser with others to help them design their space.
Committed to delighting customers with world-class ceramic products and services. Make Simpolo synonymous with the best quality and set new benchmarks of excellence for all stakeholders. Pursue best business practices with utmost integrity to make Simpolo an exciting organisation to work with, for vendors, channel partners, investors and employees alike.
Gain worldwide recognition in the field of ceramic building products through Research and Innovation and bring an enhanced lifestyle within reach for every household.
Elegant Evergreen Homes - Luxury Apartments Redefining Comfort in Yelahanka, ...JagadishKR1
Experience unmatched luxury at Elegant Evergreen Homes, offering exquisite 2, 3, and 4 BHK apartments in the serene locality of Yelahanka, Bangalore. These meticulously crafted homes blend modern design with timeless elegance, providing a harmonious living environment. Enjoy top-tier amenities and a prime location, making Elegant Evergreen Homes the ideal choice for discerning homeowners.
Referans Bahcesehir which is being constructed, in the center of the most regional destination as Bahçeşehir, shines out with its central location and unique landscape including social facilities such as a fitness center, sauna, sports facilities, children’s playground and recreational areas.
Not only drawing attention for immediate surroundings including commercial centers and private schools but also providing the easily accessible location with closeness to Tem Highway and connection roads, ongoing construction of 3rd Bridge Connection roads and Metro Projects
Bahcesehir is a rising value in the great city of Istanbul… Located at a new transportation junction in the northwest of the City… Located at such a spot that the access roads for the 3rd bridge and for the 3rd Airport will reach the region in 2016. The Marmaray and the Subway will extend all the way to Referans Bahcesehir respectively in 2018 and 2019.
465 flats and 34 stores are designed with an outstanding approach and arranged with a unique perspective offering the following options: 1 plus 1, 2 plus 1, 3 plus 1, 3.5 plus 1, 4 plus 1, and 4.5 plus 1. It is planned so as to safeguard you and your loved ones based upon a modern, technological safety approach. As you experience the joy and luxury here, you will be content and feet at ease.
It is worth seeing both inside and outside with heart-warming cafes, tasty restaurants and elegant stores… And it is ready to offer a vivacious social life with a warm and cozy space design.
A folding swimming pool and indoor swimming pools, playgrounds, Turkish bath, sauna… It has them all. Everything you need for your well-being and for having a pleasant time will be at your service. You simply need to align the rhythm of life with the rhythm of Referans Bahcesehir.
https://listingturkey.com/property/referans-bahcesehir/
Need MCA leads? No sweat! MCAs are great for small biz funding. Learn how to snag top-notch leads: businesses needing cash, with repayment ability, decision-makers, and accurate contacts. Use content, social ads, lead platforms, partnerships, and capture processes for quality leads.
https://www.leadgeneration.media/blog/b/streamline-your-mca-sales-process-with-pre-qualified-leads
Brigade Insignia offers meticulously designed apartments with modern architecture and premium finishes. The project features spacious 3,3.5,4 and 5 BHK units, each thoughtfully planned to provide maximum comfort, natural light, and ventilation.
https://www.newprojectbangalore.com/brigade-insignia-yelahanka-bangalore.html
Minneapolis-St. Paul Employment Update | February13, 2016
1. Total jobs vs. unemployment rate: MSP
Source: JLL Research, Bureau of Labor Statistics
Job growth/loss by sector (12-month change): MSP
Source: JLL Research, Bureau of Labor Statistics
Industrial employment trends (12-month change): MSP
Source: JLL Research, Bureau of Labor Statistics
• Minneapolis-St. Paul unemployment gained 60 basis points and fell four spots
nationally into an eight place tie with the Indianapolis metro. New workforce
highs were achieved in Professional and Business Services and Other
Services while Education and Health services saw a slight pullback from its
recent run in growth. Y-O-Y Education and Health Services maintained the top
spot creating 13,000 jobs over the trailing 12 month period. In contrast, the
Leisure and Hospitality sector lost 5,300 jobs in 2016.
• Among office using sectors, all have seen a month-to-month contraction in
growth except Professional and Business Services which has finished 2016
net positive 12,700 jobs.
• Nationwide, unemployment rose for the second consecutive month and now
sits at 4.8 percent, boosted by an increase in the labor force participation rate
to 62.9 percent. However, the expansion of the civilian labor force is not
keeping up with job growth, which will keep slack minimal in the near-term.
• Wage growth continues but at a slower pace than December.
Employment Update
Minneapolis-St. Paul | February 2017
4.8%U.S. unemployment
1.6%U.S. 12-month job growth
3.6%MSP unemployment
1.4%MSP 12-month job growth
3.9%Minnesota unemployment
1.5%Minnesota 12-month job growth
Office employment trends (12-month change): MSP
Source: JLL Research, Bureau of Labor Statistics
Peak: 1,907,773 jobs
-20.0
-15.0
-10.0
-5.0
0.0
5.0
10.0
15.0
20.0
25.0
2011 2012 2013 2014 2015 2016
Financial Activities Professional and Business Services
Information Government
In thousands -5.0
0.0
5.0
10.0
15.0
20.0
25.0
2011 2012 2013 2014 2015 2016
Mining, Logging & Construction Trade, Transportation & Utilities
Manufacturing Other Services
-5,300
-1,100
-400
1,400
1,400
1,600
1,900
2,200
12,700
13,000
Leisure & Hospitality
Manufacturing
Information
Trade, Transportation & Utilities
Government
Financial Activities
Mining and Logging
Other Services
Professional & Business Services
Educational & Health Services
0.0%
2.0%
4.0%
6.0%
8.0%
10.0%
1,550,000
1,650,000
1,750,000
1,850,000
2005
2006
2007
2008
2009
2010
2011
2012
2013
2014
2015
2016
Total Employment
Unemployment