Behavioral Public Choice The Behavioral Paradox of Gove.docx
SSRN-id2492209
1. Electronic copy available at: http://ssrn.com/abstract=2492209
Forthcoming UCLA LAW REVIEW
September 19, 2014
2014
BANKRUPTCY SURVIVAL
Lynn M. LoPucki and Joseph W. Doherty*
CONTENTS
I. INTRODUCTION............................................................................................... 3
II. THE SURVIVAL REGRESSION ......................................................................... 8
A. The Data Set ........................................................................................ 8
B. The Survival Concept........................................................................... 9
C. The Bivariate Relationships............................................................... 11
D. Regression Methodology ................................................................... 12
E. Regression Results............................................................................. 15
F. Survival Prediction............................................................................. 18
III. THE SURVIVAL PREDICTORS...................................................................... 19
A. Intention to Sell the Business............................................................. 19
B. Judicial Experience ........................................................................... 20
C. Distance to the Local Bankruptcy Court ........................................... 21
D. Creditors’ Committees ....................................................................... 24
E. DIP Loans........................................................................................... 26
F. Interest Rates ..................................................................................... 29
G. Operating Income Before Filing........................................................ 29
H. Equity Before Filing........................................................................... 31
I. Plan Prenegotiation........................................................................... 34
J. Manufacturer..................................................................................... 37
K. Company Size ..................................................................................... 38
L. Non-Qualifying Variables................................................................... 38
*
Lynn M. LoPucki is the Security Pacific Bank Distinguished Professor of Law at the
UCLA School of Law. Joseph W. Doherty is Director of the Empirical Research Group at
the UCLA School of Law. The study reported in this article was supported by grants from
the endowments of the National Conference of Bankruptcy Judges, the American Bank-
ruptcy Institute, and the Turnaround Management Association. We thank Dan Bussel,
Frances Foster and Chris Mirick for comments on earlier drafts, and Joe Demaio, Doug
Irion, Hayk Mamajanyan and Yvonne Stoddard for assistance with research.
2. Electronic copy available at: http://ssrn.com/abstract=2492209
2 BANKRUPTCY SURVIVAL
IV. A FIVE-DECISION MODEL OF BANKRUPTCY SURVIVAL............................. 41
V. CONCLUSION............................................................................................. 42
3. Electronic copy available at: http://ssrn.com/abstract=2492209
2014 Forthcoming UCLA LAW REVIEW 3
I. INTRODUCTION
In large, public company cases, bankruptcy courts can be analogized to
hospital emergency rooms.1
Companies arrive sick and receive treatment.
Some survive, meaning that they continue in business. Others fail, meaning
that they cease doing business, their employees lose their jobs, and their
assets are liquidated or merged into other companies. These emergency
room visits are high-risk for the companies. The average case duration is
sixteen months. During that brief period, 30% of the companies fail.
The legislative history of the Bankruptcy Code clearly identifies saving
companies and preserving jobs as intended bankruptcy system goals.
The purpose of a business reorganization case, unlike a liqui-
dation case, is to restructure a business’s finances so that it
may continue to operate, provide its employees with jobs, pay
its creditors, and produce a return for its stockholders. . . . It is
more economically efficient to reorganize than to liquidate,
because it preserves jobs and assets.2
Some scholars differ. Adherents to the creditors’ bargain theory3
of
bankruptcy maintain that if liquidation will return more to the creditors and
shareholders4
than reorganization, companies should be liquidated5
– even if
1
E.g., Elizabeth Warren & Jay Lawrence Westbrook, The Success of Chapter 11: A
Challenge to the Critics, 107 MICH. L. REV. 603, 606 (2009) (Because the Chapter 11
hospital is explicitly designed to deal with both ailing patients and corpses, the business
failure rate can be understood better if the two kinds of cases are separated.”).
2
H.R. REP. 95-595, at 220 (1977).
3
Lynn M. LoPucki, A Team Production Theory of Bankruptcy Reorganization, 57
VAND. L. REV. 741, 744-49 (2004) (summarizing the creditors’ bargain theory).
4
THOMAS H. JACKSON, THE LOGIC AND LIMITS OF BANKRUPTCY LAW 32-33 (1986)
(postulating that managers and employees “have no rights that need to be accounted for in
[bankruptcy]”).
5
As Professor Alan Schwartz put it
a conflict exists between the goals of job preservation and maximizing the
bankruptcy monetary return only with regard to firms whose liquidation
values exceed their reorganization values. To find that liquidation value
exceeds going-concern value, however, is to find that the firm’s physical
assets are best redeployed in other uses.
Alan Schwartz, A Contract Theory Approach to Business Bankruptcy, 107 YALE L.J. 1807,
1818 (1998).
4. 4 BANKRUPTCY SURVIVAL
the liquidation eliminates jobs.6
In limiting their concern to the interests of
creditors and shareholders, those scholars ignore the massive economic and
social costs that company failure imposes on employees, suppliers, custom-
ers, and communities.7
One of us has explained elsewhere that, at least in the context of large,
public companies, the creditors’ actual bargain includes the interests of all
stakeholders.8
We believe that once all stakeholders’ interests are taken into
account, if survival is achievable, survival is virtually always economically
preferable to liquidation.
We recognize that survival may not be optimal from the perspectives of
various priority levels of creditors and shareholders. Some or all may find
economic advantage in liquidation or merger and so regard them as success.
But we have chosen to predict and explain “success” defined as business
survival.
Earlier research has explored the relationships between business surviv-
al and a variety of case or company characteristics.9
Our model is, however,
6
Douglas G. Baird, Bankruptcy’s Uncontested Axioms, 108 YALE L.J. 573, 580
(1998) (“The paradigmatic firm is a restaurant in a large city. When the restaurant closes,
workers lose their jobs, but they can find work elsewhere. A new restaurant or another firm
can move into the space, and life goes on.”).
7
Elizabeth Warren, Bankruptcy Policymaking in an Imperfect World, 92 MICH. L.
REV. 336, 355 (1993) (“Business closings affect employees who will lose jobs, taxing
authorities that will lose ratable property, suppliers that will lose customers, nearby proper-
ty owners who will lose beneficial neighbors, and current customers who must go else-
where.”).
8
LoPucki, supra note 3, at 749-52 (explaining the team production theory of reorgani-
zation).
9
Vicki L. Bogan & Chad M. Sandler, Are Firms on the Right Page with Chapter 11?
An Analysis of Firm Choices that Contribute to Post-Bankruptcy Survival, 19 APPLIED
ECON. LETTERS 609 (2012) (testing seven independent variables, including some not
available until after the case is concluded, with survival); Sandeep Dahiya, John Kose,
Manju Puri & Gabriel Ramirez, Debtor-in-Possession Financing and Bankruptcy Resolu-
tion: Empirical Evidence, 69 J. FIN. ECON. 259 (2003) (survival and DIP lending); Maria
Carapeto, Does Debtor-in-Possession Financing Add Value? (July 25, 2014) (unpublished
manuscript) (on file with authors) (survival and DIP lending); Diane K. Denis & Kimberly
J. Rodgers, Chapter 11: Duration, Outcome, and Post-Reorganization Performance, 42 J.
FIN. & QUANTITATIVE ANALYSIS 101 (2007) (testing twelve independent variables, includ-
ing some not available until after the case is concluded, with survival); Michael Lemmon,
Yung-Yu Ma & Elizabeth Tashjian, Survival of the Fittest? Financial and Economic Dis-
tress and Restructuring Outcomes in Chapter 11 (Aug. 2009) (unpublished manuscript) (on
5. 2014 Forthcoming UCLA LAW REVIEW 5
the first data-driven10
comprehensive model of those relationships. We had
two goals in developing it. The first was to identify system changes that
would increase the survival rate. We have identified at least one good pro-
spect. As the system currently operates, the courts assign cases to judges
randomly. Our data suggest that if the courts instead assigned large, public
company cases based on the judges’ experience in presiding over such
cases, the survival rate would be higher. The biggest gains would be among
the riskiest companies. Assignment based on judicial experience could
change some predicted survival rates from under 30% to more than 50%.11
The study’s second goal was to develop an easily applied method for
accurately calculating, at the time a bankruptcy case is filed, the probability
that the company will survive to the end of the bankruptcy case. Accurately
predicting survival is important for two reasons.
First, the parties involved must make decisions during the case, and
many of those decisions are based on predictions regarding survival. For
example, managers, employees, suppliers, and customers decide whether to
continue in their relationships with the debtor during the case. DIP lenders
decide whether to advance funds, and if so, on what terms. Judges decide
whether to lift the automatic stay and permit the repossession of collateral,12
whether to approve DIP lending, and whether to approve applications for
professional fees. Creditors and shareholders decide how much to demand
in settlement of their claims and debtors decide how much to offer. Inves-
tors decide whether to buy and sell claims or interests, and if so, at what
prices. Potential acquirers of the debtor’s business decide whether and how
much to bid. With accurate and timely predictions, each of these parties can
make better decisions.
Second, bankruptcy decision making is a self-reinforcing process. If
the parties involved believe that the debtor will fail and act accordingly,
their decisions may cause an otherwise viable debtor to fail. Similarly,
overly optimistic predictions may enable non-viable debtors to survive in
file with authors) (testing nine independent variables, including some not available until
after the case is concluded, with survival).
10
By data-driven, we mean that we selected variables for inclusion in the model based
on the variables’ performances in the model. We did not follow the usual practice of
selecting and retaining variables based on prior research or our prior beliefs.
11
See infra Figure 3.
12
One of the standards the courts must apply is “a reasonable possibility of a success-
ful reorganization within a reasonable time.” United Sav. Ass’n v. Timbers of Inwood
Forest Assoc., Ltd., 484 U.S. 365 (1988). That standard is roughly equivalent to whether
the debtor will survive.
6. 6 BANKRUPTCY SURVIVAL
the short run while consuming value that could otherwise have been distrib-
uted to creditors through liquidation.
The differences in companies’ survival prospects as they enter bank-
ruptcy are largely invisible, but they are not subtle. Figure 1 shows the
probabilities that the firms we studied would survive bankruptcy, calculated
using our best regression model. If future cases are like the cases we stud-
ied, their survival-probability distributions will approximate that shown in
Figure 1.
Even without a regression model, some differences in companies’ pro-
spects would be apparent. But others would not. At the commencement of
each studied case, the debtor was in business with the publicly avowed
intention of remaining so. Only those privy to inside information could have
had any real sense of their likelihoods of survival. But with the application
of the regression formula, survival probabilities ranging from less than 10%
to more than 95% for a given company become apparent.
We chose bankruptcy survival as the variable we sought to predict and
ultimately to control. We considered as predictors only variables whose
values would be available at or shortly after a bankruptcy filing and that
plausibly might explain survival. Through regression analysis, we tested
more than seventy such variables. We identified the eleven that are concur-
rently statistically significantly correlated with bankruptcy survival. The
result is a regression model that predicts bankruptcy survival. Table 1
defines BANKRUTPCY-SURVIVAL and the eleven independent variables.
7. 2014 Forthcoming UCLA LAW REVIEW 7
Table 1. Variables Qualifying for Inclusion in Our Best Regression Model. BRD source-
variables’ names appear in parentheses beneath the variable names used in this Article.
Variables Definitions
BANKRUPTCYSURVIVAL
(Emerge)
Debtor continued in business indefinitely after dispo-
sition of the bankruptcy case, whether by plan con-
firmation, 363 sale, or otherwise.
1. SALEINTENDED
(SaleIntended)
At the time of filing, the debtor publicly indicated an
intention to sell the business.
2. PRIMERATE
(Prime1YearBefFile)
The prime rate of interest one year prior to filing
3. PRENEGOTIATION
(Prepackaged)
This variable is 2 for a prepackaged case, 1 for a
prenegotiated case, and 0 for a case that is neither.
4. EQUITYBEFORE
(AssetsBefore; LiabBefore)
The ratio of the debtor’s equity before bankruptcy to
the debtor’s assets before bankruptcy, as reported on
the debtor last annual report before bankruptcy.
5. MANUFACTURER
(SICDivision)
Debtor reported its Standard Industrial Classification
code as Division D: Manufacturing.
6. MILESTOLOCALCOURT
(HqToHqCtCity)
Distance in miles from debtor’s headquarters city to
the local bankruptcy court
7. CREDITORSCOMMITTEE
(CommCred; DateCommCred)
Whether the U.S. Trustee appointed a creditors’
committee in the first twenty-four days of the case
8. EBITPOSITIVE
(EbitBefore)
The debtor’s earnings before interest and taxes
(operating profit), in the last year before bankruptcy,
is greater than zero.
9. JUDGEEXPERIENCE
(JudgeDisposition)
Log of the number of large, public company bank-
ruptcies in which the judge signed the disposition
order prior to signing the disposition order in this case
10. COMPANYSIZE
(AssetsCurrDollar)
Debtor’s size, measured by the log of total assets in
current dollars, as shown on the debtor’s last annual
report prior to bankruptcy.
11. DIPLOAN
(DipLoanRes)
Whether the court approved debtor-in-possession
borrowing outside the ordinary course of business
Because the company and case characteristics reflected in these predic-
tive variables exist before survival manifests, the characteristics may cause
survival. Alternatively, other characteristics may cause both the value of the
predictive variable and survival. As that other characteristic varies, so do
the predictive variable and survival, leaving the false impression that the
predictive variable is causing survival. After considering that possibility, we
ultimately concluded that EQUITYBEFORE is not causal, but that the other ten
8. 8 BANKRUPTCY SURVIVAL
variables may be in whole or in part causal. We explain each of these con-
clusions in Part III.
This study is based on UCLA-LoPucki Bankruptcy Research Database
(BRD) data.13
The BRD consists of more than 200 usable fields of data on
each of the more than one-thousand large, public company bankruptcies
filed in the United States Bankruptcy Courts since 1979. All of the data
analyzed in this study are included in the BRD. As a result, any part of this
study can easily be updated or replicated from the BRD.
Part II of this Article presents and explains our regression model and
the dependent variable in that model, company survival. Part III discusses
each of the eleven independent variables. It presents our conclusions re-
garding the causal role each may play in bankruptcy survival and our bases
for those conclusions. Part IV presents a new “five decision” model of
reorganization, based in part on regression analysis of the independent
variables in the main regression model. Part V concludes that more large,
public companies will survive bankruptcy if their cases are assigned to more
experienced judges and if the parties to the cases focus greater attention on
five key decisions in the bankruptcy process.
II. THE SURVIVAL REGRESSION
Multiple regression is a method for determining the directions and
magnitudes of the correlations between multiple independent variables and
one dependent variable. We ran a series of logistic regressions in order to
determine the combination of independent variables that best predicts com-
pany survival. Because we sought to predict survival rather than merely
explain it, we limited our consideration to variables whose values are pub-
licly available at or about the filing of the bankruptcy case.
A. The Data Set
Our study is based on the BRD data set. From that data set, we exclud-
ed cases that remained pending when our study closed on August 16, 2014,
cases of financial institutions,14
cases filed prior to 1994, and cases in which
the debtor did not operate a business at the time of filing or did not intend at
13
http://lopucki.law.ucla.edu/ (last visited July 24, 2014).
14
Financial institutions are companies that reported their Standard Industrial Code di-
vision as “H: Finance, Insurance, and Real Estate.”
9. 2014 Forthcoming UCLA LAW REVIEW 9
that time to continue the business indefinitely. We excluded the bankrupt-
cies of financial institutions because many financial institutions that report
assets of sufficient size to qualify for inclusion in the BRD are in fact small
businesses with few employees.15
We excluded cases filed prior to January
1, 1994 because the BRD does not contain the crucial SALEINTENDED varia-
ble for cases filed prior to that date.
B. The Survival Concept
Bankruptcy survival is the dependent variable in our regression analysis
(hereinafter BANKRUPTCYSURVIVAL when reference is to the variable). We
define BANKRUPTCYSURVIVAL as continuation – with the intent to continue
indefinitely – of the debtor’s business operations after the debtor emerges
from bankruptcy.16
A business that is acquired during the bankruptcy case is
classified as surviving if it operates separately from its acquirer after bank-
ruptcy,17
but not if its operations are merged into those of the acquirer.18
Survival may be by confirmation of the company’s Chapter 11 plan or by
entry of an order approving a sale of the company as a going concern prior
to confirmation.
Bankruptcy survival is a difficult concept to define. Companies may
undergo tumultuous changes during bankruptcy. They may shrink in size,
be split into multiple businesses, sell their businesses to new owners, dis-
charge their managers, change their names, and fundamentally change the
15
Researchers commonly exclude financial institutions from studies of bankruptcy
cases. See, e.g. Dahiya et al., supra note 9, at 264 (“We exclude the financial services firms
such as depository institutions, insurance companies, nonbanking financial firms, and real
estate firms (SIC codes between 6000 and 6999).”).
16
A company does not survive bankruptcy if the company made a decision to cease
operations before the end of the bankruptcy case, even if the company continued to operate
after bankruptcy for the purpose of orderly liquidation. Protocols for the UCLA-LoPucki
Bankruptcy Research Database (May 29, 2014) (unpublished manuscript) (on file with
authors) [hereinafter BRD Protocols] (“A company does not emerge if the company contin-
ues to operate only for the purpose of liquidation.”).
17
Id. (“A company emerges even if it is acquired by another company at or before
confirmation, and even if the acquiror contributes capital or credit enhancements to the
company, provided that the acquiror operates the company as a separate business.”).
18
Id. (“But no company emerges if the assets are integrated into an existing business
of the acquiror or merger partner, during bankruptcy or pursuant to the plan, unless the
merger partner is small in relation to the company.”). Merger is not necessarily a bad
result. But the vast majority of companies that merge out of existence through bankruptcy
have in fact failed.
10. 10 BANKRUPTCY SURVIVAL
nature of their businesses. One or more businesses may survive after a
bankruptcy, but it may nevertheless be difficult to say whether that survivor
is the bankrupt company, a company that acquired the bankrupt company, or
a company that acquired elements of the bankrupt company. The BRD’s
solution to this problem is to regard the company as the relationships among
the company’s employees and the relationships of those employees with
outsiders and firm assets.19
Following the BRD protocols, if the structure of
those relationships survives and remains distinguishable from its owner, we
regard the company as surviving.20
Two examples may help to clarify. After filing its bankruptcy case,
General Motors Corporation sold and transferred the valuable portions of its
business, including its managers and employees, to a new corporation
formed to purchase them. The sale included the name “General Motors
Corporation.” The selling entity remained in bankruptcy, operated no busi-
ness, and changed its name to Motors Liquidation Company. Although
some might argue that the company that remained in bankruptcy was the
bankrupt company, the BRD classifies General Motors Corporation as
surviving bankruptcy. The company was sold when the web of relationships
constituting it was sold.
Chain-store retailers often sell stores during bankruptcy. The buyers
may continue to operate the stores in the same locations, with some or all of
the same employees, but as part of the buyers’ businesses and under the
buyers’ names. Although the within-store employment structure may con-
tinue to exist, the employment structure that made the retailer a large, public
company may not. If the chain-store retailer sells all of its stores and dis-
charges the employees who administered the stores as a chain, the BRD
classifies the business as not surviving, even if the buyer hires the within-
store employees. If the chain-store retailer retains and continues to operate
some stores, the BRD classifies the company as surviving, even though the
company’s business may be much smaller.
Although any set of rules for classifying companies as surviving or not
surviving bankruptcy would be debatable at the margins, classification
19
Lynn M. LoPucki, The Nature of the Bankrupt Firm: A Response to Baird and
Rasmussen’s The End of Bankruptcy, 56 STAN. L. REV. 645, 671 (2003) (“Baird and Ras-
mussen’s view of the bankrupt firm as merely an asset-owning entity misses the firm’s
essence. Coase’s view of the bankrupt firm as a relationship among people captures it.”).
20
BRD Protocols (unpublished manuscript) (on file with authors) (defining the “firm”
as “the web of employment relationships that made the debtor a firm”).
11. 2014 Forthcoming UCLA LAW REVIEW 11
presents no difficulty in the vast majority of the cases. We doubt that any
particular classification rule would affect a sufficient number of cases to
affect any of our findings.
C. The Bivariate Relationships
A relationship between the dependent variable and a single independent
variable, without controlling for other variables, is referred to as “bivariate.”
Bivariate relationships are important because they are directly observable
without the sometimes distorting lens of statistics. Multivariate analysis may
demonstrate that an apparent relationship between two variables does not
exist when controlling for a third variable. But by acknowledging the easily
observable bivariate relationships, bivariate analysis helps to link the results
from multivariate analysis to observable reality.
Throughout this paper, we report the levels of significance for various
statistical tests. These “p values” or “significance levels” indicate the prob-
ability that a relationship as strong as that reported would have arisen in the
data by chance. We refer to relationships with p values less than .05 (signif-
icance at the 5% level) as “statistically significant” and p values less that .10
(significance at the 10% level) as “marginally statistically significant.”
Table 2. BANKRUPTCYSURVIVAL rates for companies in the categories listed
Companies
Total
companies
Number
surviving
Number
failing
Survival
rate
All 634 444 190 70%
Intending to sell 135 56 79 41%
Creditors’ committee appointed 495 323 172 65%
DIP loan approved 461 336 125 73%
Positive EBIT before filing 319 243 76 76%
Manufacturers 242 187 55 77%
The correlations between the variables corresponding to each of these categories and
BANKRUPTCYSURVIVAL are statistically significant at p<.001, except DIPLOAN,
which is significant at p=.009, and MANUFACTURER at p=.002, and EBITPOSITIVE, at
at p=.001. Significance levels are calculated using Chi-squares.
Table 2 shows the direct relationships between BANKRUPTCYSURVIVAL
and the presence of the characteristics represented by the dichotomous
independent variables in our regression model. The 41% survival rate for
companies signaling their intention to sell and the 65% survival rate for
companies for whom the U.S. Trustee appointed creditors’ committees
12. 12 BANKRUPTCY SURVIVAL
were each significantly below the 70% survival rate for all companies. The
77% survival rate for manufacturers, the 76% survival rate for companies
with positive EBIT (operating income) before bankruptcy, and the 73%
survival rate for companies with DIP loans were each significantly above
the 70% survival rate for all companies.
Table 3 shows the mean values for the surviving companies in column
(2) and the mean values for the failing companies in column (3) for each of
the six continuous variables in our model. Column (4) expresses the magni-
tude of the difference between those means in concrete terms. Column (5)
provides the significance level of the direct correlation between the variable
and BANKRUPTCYSURVIVAL.
Table 3. Bivariate Relationships of Continuous Variables to BANKRUPTCYSURVIVAL
(1)
VARIABLE
(2)
Survivor
mean
(3)
Failure
mean
(4)
Magnitude of differ-
ence in means
Survivors:
(5)
Significance
level of cor-
relation with
BANKRUPTCY
-SURVIVAL
PRIMERATE 6.42% 7.26% paid .84% lower rate p < .001
PRENEGOTIATION 0.59 0.12
.47 more likely to be
prenegotiated
p <.001
EQUITYBEFORE
-14% of
assets
14% of
assets
had 28% less equity p <.001
MILESTOLOCALCOURT
4.4
miles
6.5
miles
were 32% closer to
the court
p =.005
JUDGEEXPERIENCE
6.6
cases
4.5
cases
had judges with 44%
more experience
p = .001
COMPANYSIZE
$1,059
million
$862
million
had 22% higher total
assets
p = .024
Definitions of the variables are contained in Table 1, supra.
Together, Tables 2 and 3 show that all of the eleven variables in our regres-
sion model are significantly correlated with BANKRUPTCYSURVIVAL when
not controlling for other variables. As we discuss below, each of the eleven
variables remains statistically significantly correlated with BANKRUPTCY-
SURVIVAL when controlling for the other ten variables.
D. Regression Methodology
Our dependent variable, BANKRUPTCYSURVIVAL, is binary. That is, the
company survives or it does not. Accordingly, we used logistic regression
to estimate our model of the correlates of BANKRUPTCYSURVIVAL.
13. 2014 Forthcoming UCLA LAW REVIEW 13
To take full advantage of the wealth of data contained in the BRD, we
employed what Leamer described as “the data dependent process of select-
ing a statistical model.”21
That is, we selected or constructed about seventy
variables that we thought could conceivably predict survival.22
We tested
them in hundreds of combinations to determine the combination that would
best predict BANKRUPTCYSURVIVAL.
The alternative to the “multiple testing” process we employed is for re-
searchers to hypothesize the set of variables they believe will best explain
bankruptcy survival, test only those variables, and report models containing
both the significant and the insignificant variables in those models (“single-
hypothesis testing”). All five prior studies of bankruptcy survival ostensibly
followed the single hypothesis testing approach.23
Multiple testing has several advantages over single-hypothesis testing.
First, multiple testing is a relatively objective process in which the data
largely determine the results. In single-hypothesis testing, the researchers’
prior beliefs determine what variables are included in the regression and so
may play a large role in determining the results. Second, by testing many
variables, multiple testing reduces the risk of omitting the most important
ones from the model. Single-hypothesis testing can often reach misleading
results by finding and reporting relationships that would not survive the
inclusion in the model of independent variables that more strongly predict
the dependent variable. Third, at least in the instant situation where the data
set is a universe, multiple testing advances knowledge more quickly. Over
time, a succession of single-hypothesis researchers can test any or all of the
relationships a multiple-testing researcher can. Ultimately, the aggregate of
researchers using either method will reach the same conclusions. But the
multiple-testing researcher reaches the conclusion more quickly by conduct-
ing all of the tests as part of a single study.
21
EDWARD LEAMER, AD HOC INFERENCE WITH NONEXPERIMENTAL DATA 1 (1978)
(“‘Data mining,’ ‘fishing,’ ‘grubbing,’ ‘number crunching.’ These are the value-laden
terms we use to disparage each other’s empirical work with the linear regression model. A
less provocative description would be ‘specification searching,’ and a catch-all definition is
‘the data dependent process of selecting a statistical model.’”).
22
Conscious of the multiple testing problems inherent in any specification search, we
used the procedure described by Schweder and Spjotvoll to evaluate the bivariate relations
of these variables with the dependent variable. T. Schweder & E. Spjotvoll, Plots of P-
values to evaluate many tests simultaneously, 69 BIOMETRIKA 493-502 (1982).
23
Bogan & Sandler, supra note 9; Carapeto, supra note 9; Dahiya et al., supra note 9;
Denis & Rodgers, supra note 9; Lemmon et al., supra note 9.
14. 14 BANKRUPTCY SURVIVAL
The treatment of industry variables in the bankruptcy survival literature
illustrates the advantages of multiple testing. Because retailers frequently
obtain DIP loans, in a study of DIP lending’s effect on survival, Dahiya and
his coauthors controlled for whether the company’s Standard Industrial
Classification (SIC) division was retail.24
Because electric, gas and sanitary
services companies constituted more than 5% of their sample, in another
study of bankruptcy survival, Bogan and Sandler controlled for whether the
company’s SIC division was electric, gas, and sanitary services.25
Neither
variable was statistically significant. By including those irrelevant variables
in their regressions, those researcher may have altered their principal find-
ings. In our study, we tested all of the SIC divisions, finding that only
manufacturing was significant. Accordingly, we included only manufactur-
ing in our best model.
An often-asserted disadvantage of multiple testing is that multiple test-
ers will discover and report relationships in the data that exist merely by
chance, leading to spurious conclusions (“false discovery”). For example, if
one runs 100 tests on random data, one would expect the results of one of
the tests to be significant at the 1% level.
The possibility of false discovery exists in the context of this study.26
But it is of less importance because this study is of the entire population of
large, public company bankruptcies. The spurious relationships that exist in
the entire population by chance can be discovered by hypothesis-testers and
multiple testers alike. Neither has the option of drawing another sample to
see if the putative relationship persists. In other words, when studying an
entire population, we run the risk of false discovery because there is no way
to avoid that risk.
We considered only models in which all of the variables were statisti-
cally significant at the .10 level or better. We considered a model to be
better if it contained more variables and generated a higher pseudo R-
squared. By fixing these rules in advance, we limited our ability to alter our
findings through our variable selection. Thus, we think our model is as
24
Dahiya et al., supra note 8, at 272.
25
Bogan & Sandler, supra note 9, at 612 n.8.
26
Using the procedure proposed by Schweder and Spjotvoll, supra note 22, we found
that the proportion of extreme p values in our finding were sharply higher than the propor-
tion expected from a random data set. We conclude that few of the extreme p values in our
findings resulted by chance.
15. 2014 Forthcoming UCLA LAW REVIEW 15
close to objective as one can get in the slippery world of multivariate statis-
tics.
E. Regression Results
We think that Model (1), (3), and (4) on Table 4 predict BANKRUPTCY-
SURVIVAL equally well. In all three models, all eleven independent varia-
bles are at least marginally statistically significant. With one immaterial
exception for model (3), no other variable would be at least marginally
significant and generate a higher pseudo R-squared after removing all other
variables that are not at least marginally significant.27
DENY is a variable indicating that the debtor filed in Delaware or the
Manhattan Division of the Southern District of New York. Those two
courts are the principal destinations for forum shopping by large, public
companies. DENY is significantly directly correlated with BANKRUPTCY-
SURVIVAL (p=.001). Companies that file in Delaware and New York are
significantly more likely to survive.
Model (2) shows the effect of adding DENY to Model (1). Neither
DENY nor JUDGEEXPERIENCE is statistically significant. The reason is that
the judges in Delaware and New York are highly experienced in large,
public company bankruptcy. As a result, JUDGEEXPERIENCE and DENY are
highly correlated (p<.001). DENY explains 36% of the case-to-case vari-
ance in JUDGEEXPERIENCE.28
Neither DENY nor JUDGEEXPERIENCE is
statistically significant in the model because, to a large degree, both explain
the same case-to-case variance.
27
To verify this conclusion, we created a Stata do file that runs each of the more than
70 variables we considered to be plausible predictors of BANKRUPTCYSURVIVAL both in
Models (1) and (3) of Table 4. The do file runs them as additional variables, substitutes for
similar variables, or both. With only one exception, our best models outperformed the
models thus created. The exception is that substitution of liabilities before bankruptcy for
assets before bankruptcy makes a very slight improvement in Model (3). We did not
substitute liabilities for assets because the gain was negligible and substitution would have
rendered our models less comparable to each other and to the literature. All prior research
used assets.
28
We ran an ordinary least squares regression with JUDGEEXPERIENCE as the depend-
ent variable and DENY as the sole independent variable.
17. 2014 Forthcoming UCLA LAW REVIEW 17
Model (3) shows the effect of substituting DENY for JUDICIAL-
EXPERIENCE in model (1). Model (3) performs very slightly better than
Model (1) in that the fit of the model to the data (the pseudo R-squared) is
very slightly better.
JUDGEEXPERIENCE6 is a dichotomous variable that indicates whether
the presiding judge on the case had presided over at least six prior cases.
Model (4) shows the effect of substituting this variable for DENY or
JUDGEEXPERIENCE. The model performs very slightly better than Models
(1) or (3).
The improvement from using DENY or JUDGEEXPERIENCE6 in the mod-
el instead of JUDGEEXPERIENCE is so slight that the models are, for all prac-
tical purposes, the same. Figure 2 explains the similarity by comparing the
distribution of Delaware and New York cases with the distribution of Other
Court cases across eight levels of judicial experience. The comparison
shows that high-experience judges preside over most Delaware and New
York cases, while low-experience judges preside over most Other Court
cases. The strong correlation between judicial experience and jurisdiction
makes it difficult to distinguish their effects on BANKRUPTCYSURVIVAL.
To make the distinction, we tested the correlation between JUDGE-
EXPERIENCE and BANKRUPTCYSURVIVAL in each set of jurisdictions sepa-
rately. We found that JUDGEEXPERIENCE was positively correlated with
success in both jurisdictional groups, but the correlation was not statistically
18. 18 BANKRUPTCY SURVIVAL
significant in either.29
We conclude that JUDGEEXPERIENCE explains
BANKRUPTCYSURVIVAL equally as well as DENY does. It follows that in-
creasing the level of judicial experience is a plausible means for increasing
success rates in large, public company bankruptcies.
F. Survival Prediction
As previously mentioned, we seek to predict survival because we be-
lieve that prediction will have positive effects on the bankruptcy process.
To assure that our model was genuinely predictive, we included in it only
variables whose values would be available at or about the commencement of
the case. Of the eleven variables in the model, the values of eight are fixed
and publicly available at the moment of the filing of the petition.
Three – SALEINTENDED, DIPLOAN and CREDITORSCOMMITTEE – be-
come publicly available shortly after filing. The press release that reveals
SALEINTENDED is usually filed on the petition date. An SEC rule requires
that it be filed within four days of that date.30
Debtors usually file applica-
tions for approval of their DIP loans on the first day of the case and the
median time to a final order is 31 days.31
More than 50% of creditors’
committee appointments occur during the second week of the case, and 93%
occur in the first 24 days of the case.
To make the model’s predictions easily and publicly available, we have
posted and intend to continually update a Bankruptcy Survival Calculator on
the BRD website.32
By entering the relevant data regarding a real or hypo-
thetical case, the user can generate the probability of the company’s surviv-
al. If the user does not know the values of all of the variables, the user can
enter the known values and receive the best prediction based on those values
and the most recent BRD data.
29
The significance levels are p=.343 in the Delaware and New York cases p=.111 in
the Other Court cases.
30
Additional Form 8-K Disclosure Requirements and Acceleration of Filing Date, 69
Fed. Reg. 15594, 15619 (Mar. 25, 2004) (four-business-day deadline); id. at 15620 (obliga-
tion to report bankruptcy).
31
Stata do file (on file with authors).
32
http://lopucki.law.ucla.edu/survivalcalculatorprediction.html (not yet functional).
19. 2014 Forthcoming UCLA LAW REVIEW 19
III. THE SURVIVAL PREDICTORS
This Part considers each of the eleven independent variables in our regres-
sion model. We provide the reasons for our belief that each is (or is not) a
cause of BANKRUPTCYSURVIVAL. For the ten we believe are causal, we describe
the mechanisms by which we believe they operate.
A. Intention to Sell the Business
SEC regulations require public companies filing bankruptcy to disclose
their filings on form 8-K. Even if the companies are no longer public at the
time they file, and so are not required to file the 8-K, the media will quickly
discover the bankruptcy. To control the resulting publicity, nearly all of the
companies in our study issued press releases shortly after filing. In those
releases, some sought to explain how they intended to address their situa-
tions.
SALEINTENDED is a dichotomous variable that records whether the
debtor indicated in its 8-K or press release that the debtor intended to sell its
business. If the debtor suggested the possibility of sale, we coded the case
as “yes.” Cases so coded included cases in which the debtor merely indicat-
ed an interest in selling or that it was searching for a “partner.” They also
included cases in which the debtor had found a buyer and even entered into
a contract to sell.
This study is the first to discover, or even theorize, the predictive power
of debtors’ stated intention to sell. SALEINTENDED is the strongest single
predictor of failure during bankruptcy. Only 56 of the 135 companies that
indicate an intention to sell (41%) survived. By contrast, 384 of the 494
companies that did not indicate an intention to sell (78%) survived.
Announcements of intention to sell are good predictors of actual sales.
Of the 134 companies that indicated an intention to sell, 111 (82%) actually
sold their businesses in section 363 sales33
or in sales at plan confirmation.
But failure to announce an intention to sell is not a good predictor of non-
sale. Of the 432 companies that did not state an intention to sell, 189 (44%)
actually sold their businesses in 363 sales or in sales at plan confirmation.
Thus, 191 of the 300 sales (64%) were by companies that had not stated an
intention to sell. We speculate that companies tend to avoid stating an
33
A section 363 sale is a sale of the debtor’s business during the bankruptcy case, but
not pursuant to a reorganization plan.
20. 20 BANKRUPTCY SURVIVAL
intention to sell because it signals weakness to the market. Weaker compa-
nies tend to state an intention to sell because they desperately need buyers.
Signaling weakness to the market also signals weakness to employees,
suppliers, and customers. Some may defect, making survival more difficult.
Nevertheless, we think the announcement of an intention to sell predicts
BANKRUPTCYSURVIVAL primarily because it discloses preexisting weakness
that had already reduced the company’s likelihood of survival. Our control
variables had not captured that weakness entirely, so it was reflected only in
the SALEINTENDED variable.
B. Judicial Experience
JUDGEEXPERIENCE is the number of BRD cases the judge in the instant
case presided over before presiding over the instant case. As defined here, a
judge “presides over” a case if the judge signs the order disposing of the
case. While theoretically a judge might sign the order confirming the plan or
dismissing or converting the case without doing much else in the case, in
practice that seldom occurs. In most cases, the same judge presides over a
case from start to finish.
Without controls, JUDGEEXPERIENCE is strongly correlated with
BANKRUPTCYSURVIVAL (p=.001). With controls, it remains significantly
correlated with BANKRUPTCYSURVIVAL in the best model (p=.050) and
significantly correlated in a wide variety of other models.
Judicial experience has long been widely recognized as having a posi-
tive effect on litigation,34
including bankruptcy litigation.35
Ours, however,
is the first study to present empirical evidence that judicial experience has a
systematic effect on business survival in bankruptcy.
We also compiled and tested a second measure of judicial experience,
JUDGEEXPERIENCETIME. That variable is the length of time that the judge in
the instant case served as a bankruptcy judge before deciding the case.
JUDGEEXPERIENCETIME was not significantly correlated with BANKRUPTCY-
34
E.g., Stephen J. Choi, Mitu Gulati & Eric Posner, How Well Do Measures of Judi-
cial Ability Predict Judicial Performance?: A Case Study Using Securities Class Actions,
33 INT’L REV. L. & ECON. 37 (2013) (comparing judicial experience to other criteria for
predicting judicial performance).
35
E.g., Lynn M. LoPucki & William C. Whitford, Venue Choice and Forum Shopping
in the Bankruptcy Reorganization of Large, Publicly Held Companies, 1991 WIS. L. REV.
11, 30 (“Another reason cited by interviewees for the continuing flow of bankruptcy cases
to New York is the New York courts’ considerable experience in handling the reorganiza-
tions of large, publicly held companies.”).
21. 2014 Forthcoming UCLA LAW REVIEW 21
SURVIVAL directly (p=.494), in the best model (p=.423), or in any other
model we tested. We found no evidence that duration of experience as a
bankruptcy judge has any effect on BANKRUPTCYSURVIVAL.
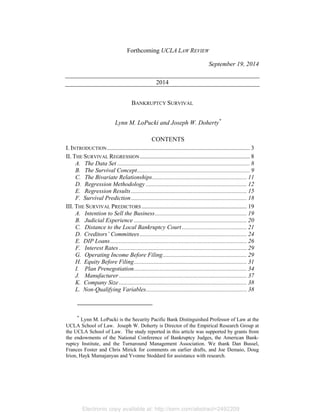
Figure 3 compares the bankruptcy survival rates for sale-intended cases
with sale-not-intended cases, for eight levels of judicial experience. As
previously discussed, the survival rates for the sale-not-intended cases are
generally much higher. Survival rates for both intention categories increase
with judicial experience. But the survival rates increase more dramatically
in the SALEINTENDED cases, where the risks of failure are greater.
We hypothesized that more experienced judges might increase the like-
lihood of survival by forcing CEOs out more or less frequently. But we
found no difference in judicial experience between the cases in which CEOs
in office at filing were replaced and those in which they were not. Further
research is needed to discover the mechanisms by which judicial experience
affects BANKRUPTCYSURVIVAL.
C. Distance to the Local Bankruptcy Court
MILESTOLOCALCOURT is the distance from the debtor’s headquarters to
the bankruptcy court that serves the area in which the headquarters are
located. MILESTOLOCALCOURT is strongly correlated with BANKRUPTCY-
SURVIVAL directly (p=.005), in the best model (p=.013), and in substantially
all of the many models we tested.
We are the first to discover this odd relationship. To appreciate its odd-
ity, realize that it is a measure of the distance to the local court, even though
22. 22 BANKRUPTCY SURVIVAL
453 of the 634 cases studied (71%) did not file in the local court. We tested
a variable, MILESTOFORUM, that was distance to the court in which the
debtor actually filed its case, and found no relationship between that varia-
ble and BANKRUTPCYSURVIVAL directly (p=.410) or in the best model
(p=.249). We can imagine no way in which the distance from a company’s
headquarters to a court the company does not use could cause the company
to succeed or fail.
Instead, we think that MILESTOLOCALCOURT and BANKRUPTCY-
SURVIVAL share a common cause: geographical isolation. Bankruptcy
courts meet at about 200 locations throughout the United States. These
locations are selected with at least two considerations in mind. The first is
to provide a court within a reasonable distance of any U.S. resident. The
second is to locate the court in a population center. A company whose
headquarters are not near any of the 200 court locations, is probably geo-
graphically isolated.
Armed with this hypothesis, we were able to find two studies linking
geographical isolation with company survival. Buehler, Kaiser, and Jaeger
found that “[business] bankruptcy rates tend to be lower in the central mu-
nicipalities” of Swiss cantons.36
In explaining their finding, they noted that
There is a broad consensus that, on average, firms and work-
ers in large and dense urban environments are more produc-
tive. The urban economics and geography literature discuss-
es three different types of externalities that may explain this
productivity difference. First, firms in agglomerations may
benefit from within-industry localization externalities arising
from labor market interactions, knowledge spillovers, and
specialized inputs. Second, agglomerations may generate
so-called Jacobs’ externalities relating to the benefits of hav-
ing a high level of industrial diversity in an agglomeration.
Third, firms may benefit from urbanization externalities
which capture the advantages of operating in a large city,
such as having access to large markets, modern infrastruc-
ture, and highly educated employees.37
Fotopoulos and Louri found that firms located in the greater Athens ar-
ea had an increased chance of survival compared to firms located in the rest
36
Stefan Buehler, Christian Kaiser & Franz Jaeger, The Geographic Determinants of
Bankruptcy: Evidence from Switzerland, 39 SMALL BUS. ECON. 231, 233 (2012).
37
Id. at 234-35.
23. 2014 Forthcoming UCLA LAW REVIEW 23
of Greece.38
But while Fotopoulos and Louri studied principally small firms
and refer to “the strong tendency of manufacturing firms to locate in urban
centers,” the manufacturing firms in our study were large and significantly
more like to locate away from the bankruptcy court cities.
HEADQUARTERSCITYSIZE is the log of the population of the debtor’s
headquarters city. HEADQUARTERSCITYSIZE is significantly correlated with
BANKRUPTCYSURVIVAL if this variable is expressed as a number (p=.022)
and marginally significantly correlated if this variable is expressed as the
headquarters city’s percentage of the U.S. population at the time of the case
(p= .054).39
The larger the city in which the debtor’s headquarters are locat-
ed, the greater the likelihood the debtor will survive bankruptcy. When
HEADQUARTERSCITYSIZE (expressed as a number) is substituted for MILES-
TOCOURT in our best model, HEADQUARTERSCITYSIZE is marginally statis-
tically significantly correlated with BANKRUPTCYSURVIVAL (p=.078) and all
of the other variables in the model remain at least marginally statistically
significant. The correlation between these two measures is .733. That both
are significantly correlated with BANKRUPTCYSURVIVAL gives us greater
confidence that the relationship between isolation and failure is not a false
discovery.
We conclude that problems resulting from geographical isolation prob-
ably contributed to failure among the companies we studied. Those prob-
lems might include difficulty in recruiting executives or employees or re-
duced access to information about industry trends resulting from reduced
contact with others working in the industry.
Companies large enough to be included in this study are seldom located
only in a single place. We estimate that about 93% of the companies in our
study owned property in more than one state.40
Most operated in several
states. We consider it more likely that factors associated with the rural
location of the companies’ headquarters – such as managerial recruitment –
rather than factors associated with the location of the companies’ operations,
are depressing the geographically isolated companies’ survival rates.
38
Georgios Fotopoulos & Helen Louri, Location and Survival of New Entry, 14
SMALL BUS. ECON. 311, 312 (2000) (“Firms located in greater Athens seem to face in-
creased chances for survival when compared with firms located in the rest of Greece.”).
39
The latter expression takes into account the fact that as the U.S. population grew
over the twenty years covered by this study, the populations of cities grew as well.
40
UCLA-LoPucki Bankruptcy Research Database (2006) (on file with authors)
(showing 23 of 322 debtors (7%) as having property in only one state).
24. 24 BANKRUPTCY SURVIVAL
D. Creditors’ Committees
CREDITORSCOMMITTEE is a dichotomous variable that is positive if the
U. S. Trustee appointed a creditors’ committee during the first 24 days of
the bankruptcy case. We chose 24 days because that limit was near the
beginning of the case yet included 92% of all creditors’ committee initial
appointments. CREDITORSCOMMITTEE was strongly and inversely correlated
with BANKRUPTCYSURVIVAL directly (p<.001) and in the best model (p=
005.). Companies are less likely to survive bankruptcy if creditors’ commit-
tees are appointed in their cases.
Our finding is similar to one by Harner and Marincic. In a study that
included both large and small companies, they found that companies were
more likely to confirm a liquidation plan41
and have plan objections from
third parties42
if a creditors’ committee is appointed.
The U.S. Trustee is less likely to appoint committees in some kinds of
cases that are destined for success. They include prepackaged and prenego-
tiated cases. That, however, that can explain only part of the correlation
between CREDITORSCOMMITTEE and BANKRUPTCYSURVIVAL.
Table 5 shows that the proportion of early appointments differs sharply
by the prenegotiation level of the case. Early appointments occur in 92% of
free fall43
cases, 73% of prenegotiated cases, and only 5% of prepackaged
cases. (Ultimately, committees will be appointed in 98% of free fall cases,
79% of prenegotiated cases, and 9% of prepackaged cases.)
41
Michelle M. Harner & Jamie Marincic, Committee Capture? An Empirical Analysis
of the Role of Creditors’ Committees in Business Reorganizations, 64 VAND. L. REV. 749,
794 (2011) (“[Unsecured creditors’ committee] cases are significantly more likely than
[noncommittee] cases to resolve through a liquidation, rather than reorganization, of the
debtor.”).
42
Id. at 782 (“[Unsecured creditors’ committee] cases are significantly more likely
than [noncommittee] cases (p=.008) to have noncommittee plan objections.”).
43
Cases are “free fall” when the plan is neither prepackaged, nor prenegotiated. The
language, frequently used by bankruptcy professionals, communicates an awareness of the
greater danger involved.
25. 2014 Forthcoming UCLA LAW REVIEW 25
Table 5. Early Creditors’ Committee Appointments by Prenego-
tiation Level
No early
appointment
Early
appointment
Total
Free fall 33
(8%)
383
(92%)
416
(100%)
Prenegotiated 41
(27%)
109
(73%)
150
(100%)
Prepackaged 63
(95%)
3
(5%)
70
(100%)
Total 137
(22%)
495
(78%)
632
(100%)
“Early appointment” is appointment of a creditors’ committee
within the first 24 days of the bankruptcy case.
Prepackaging and prenegotiation cannot, however, completely explain the
correlation between CREDITORSCOMMITTEE and BANKRUPTCYSURVIVAL,
because that correlation remains statistically significant after controlling for
PRENEGOTIATION in our best model.
U.S. Trustees may decline to appoint creditors’ committees in cases
with few unsecured creditors or cases where the estate lacks funds to enable
a committee to operate effectively.44
But we can think of no reason why
those classes of cases would be disproportionately successful. As a result,
we find the negative correlation between creditors’ committee appointment
and bankruptcy survival puzzling.
One lawyer suggested to us that creditors’ committee resistance to
debtors’ efforts to reorganize may in fact cause some companies to fail.
Some committees do seek to convert cases to chapter 7 while their debtors
continue to operate businesses.45
But on a search of 533 dockets of cases
within this study, we found only 16 (3%) contained motions by official
creditors’ committees to convert cases to chapter 7. Motions to convert are
only one of several forms that committee efforts to force liquidations might
take. But we still find it difficult to believe that creditors’ committee oppo-
44
E.g., Kenneth N. Klee & K. John Shaffer, Creditors’ Committees Under Chapter 11
of the Bankruptcy Code, 44 S.C. L. REV. 995, 1003 (1993) (providing these two examples).
45
E.g., Emergency Motion of the Official Committee of Unsecured Creditors for an
Order, Pursuant to 11 U.S.C. § 1104(a), Appointing a Chapter 11 trustee or, in the Alterna-
tive, an Order Converting this Chapter 11 Case to a Chapter 7 Liquidation Pursuant to 11
U.S.C. § 1112(B), Docket No. 1371, Feb. 10, 2013, ATP Oil & Gas Corporation, Case No.
12-36187, Southern District of Texas [hereinafter ATP Motion to Convert].
26. 26 BANKRUPTCY SURVIVAL
sition to reorganization is strong enough to cause the observed difference in
survival rates for companies with and without committees.46
Yet we have
no better explanation for the inverse correlation between CREDITORS-
COMMITTEE and BANKRUPTCYSURVIVAL.
E. DIP Loans
A DIP loan is a loan made to the debtor-in-possession during the bank-
ruptcy case. To qualify as a DIP loan under the BRD protocol the debtor
must receive new money and the advance must be outside the ordinary
course of business.
DIP loans are typically made by the current working capital lender or a
new working capital lender. Courts usually award the DIP loan priority over
prepetition secured lending. Debtors arrange DIP loans prior to filing and
then seek bankruptcy court approval immediately after filing.
Two earlier studies have shown that companies that obtain DIP loans
are more likely to survive than companies that do not.47
Our results are
consistent with their results.
Of 461 companies that received DIP loans, 336 (73%) survived. Of 169
companies that did not received DIP loans, 105 (62%) survived. The differ-
ence is statistically significant (p=.009). DIPLOAN is also significantly
correlated with BANKRUPTCYSURVIVAL in our best model (p=.034). DIP
loans probably enable companies to survive by providing cash to pay ex-
penses of continued operations.
Dahiya and his coauthors also found that cases with DIP loans were of
significantly shorter duration than cases without DIP loans. We found that
cases with DIP loans were significantly longer in duration than cases with-
out DIP loans (p=<001). Dahiya and his coauthors excluded prepackaged
cases,48
controlled for five statistically insignificant variables,49
limited
46
But see Michelle M. Harner & Jamie Marincic, Behind Closed Doors: The Influence
of Creditors in Business Reorganizations, 34 SEATTLE U. L. REV. 1155, 1170 (2011)
(reporting survey in which 62.3% of bankruptcy professionals and 35% of committee
members said creditors were exerting greater influence in chapter 11 cases than five years
prior to the survey).
47
Dahiya et al., supra note 9, at 259 (“DIP financed firms are more likely to emerge
from Chapter 11 than non-DIP financed firms.”); Carapeto, supra note 9, at 2 (“I find that
when firms did not obtain DIP financing they are more likely to be liquidated . . .”).
48
Dahiya et al., supra note 9, at 275 (“Prepackaged cases are excluded.”).
49
Id. (total assets before filing, leverage, retail, current assets to total assets ratio, and
a complex index labeled DIPLAMDA).
27. 2014 Forthcoming UCLA LAW REVIEW 27
consideration to the cases of surviving companies,50
and studied cases filed
in the period 1988-97.51
After excluding prepackaged cases, controlling for
three of the five variables,52
limiting consideration to the cases of surviving
companies, and limiting consideration to the cases filed in the period 1988-
97, we found that cases with DIP loans were shorter, but not significantly
so (p<.267). Because our sample was only 40 cases we consider our finding
to be a confirmation of Dahiya. Cases with DIP loans used to be shorter, but
recently they are longer.
Dahiya and his coauthors attributed their findings to the DIP lenders’
“screening role in which they are able to identify distressed firms that are
strong and likely to emerge quickly, as well as a monitoring role in which
the DIP lenders help firms to emerge quickly.”53
In their screening role, DIP
lenders “signal[] to other stakeholders and potential stakeholders the quality
of the borrower.”54
Our data provide only modest support for the claim that DIP lenders
perform this screening role. Debtors are more likely to receive DIP loans if
they have more employees (p<.001), are in retailing (p=.002) or manufactur-
ing (p<.001), or in longer cases (p=.010). Controlling for those four varia-
bles, companies with positive operating income measured by EBITDA were
marginally more likely to receive DIP loans (p=.081), but companies with
positive operating income measured by EBIT were not (p=.173). DIP lend-
ers were more likely to lend to economically stronger debtors, and thus
correctly signal strength, but the association is not a particularly strong one.
The proportion of debtors receiving DIP loans in Delaware and New
York was higher than the proportion receiving DIP loans in other courts.
Delaware and New York debtors received DIP loans in 302 of 401 cases
(75%). Other-court debtors received DIP loans in 159 of 229 cases (69%).
The difference was not statistically significant (p=.244).
The correlation between DIPLOAN and BANKRUPTCYSURVIVAL is weak
in Delaware and New York, but strong in other courts. In Delaware and
New York, 227 of 300 debtors with DIP loans (76%) survived as compared
50
Id. (“The sample does not include filings resulting in liquidation, substantial asset
sales, or conversion to Chapter 7.”).
51
Dahiya et al., supra note 9, at 266 (showing years).
52
We did not control for the current assets to total assets ratio or DIPLAMDA.
53
Dahiya et al., supra note 9, at 260.
54
George G. Triantis & Ronald J. Daniels, The Role of Debt in Interactive Corporate
Governance, 83 CAL. L. REV. 1073, 1078 (1995).
28. 28 BANKRUPTCY SURVIVAL
with 75 of 101 debtors without DIP loans (74%). The difference is not
statistically significant (p=.776). In the other courts, 109 of 141 debtors
with DIP loans (77%) survived as compared with 50 of 88 debtors without
DIP loans (57%). The difference is statistically significant (p=.001).
Three explanations for the difference in the effect of DIP loans on out-
comes between courts seem plausible. First, stronger debtors may be shop-
ping to Delaware and New York and receiving DIP loans because they are
stronger.55
Second, DIP loans may be more readily available in Delaware
and New York.56
Third, DIP lenders may be requiring some borrowers to
shop to Delaware or New York as a condition of the loan.57
Table 6. Bankruptcy Survival by the Presence of DIPLOAN and by Court
Delaware and New York Other Courts
Failure Survival Total Failure Survival Total
No DIP
Loan
26
(26%)
73
(24%)
99
(25%)
38
(43%)
32
(23%)
70
(31%)
DIP
Loan
75
(74%)
227
(76%)
302
(75%)
50
(57%)
109
(77%)
159
(69%)
Total 101
(100%)
300
(100%)
401
(100%)
88
(100%)
141
(100%)
229
(100%)
The difference in survival rates is significant in Other Courts (p=.001) but not in
Delaware and New York (p=.776).
Prepackaged cases are excluded from these figures.
While we agree with Dahiya and his coauthors that DIP lenders proba-
bly perform a helpful screening role, the direct effect of DIP lending on
BANKRUPTCYSURVIVAL may not be entirely benign. Because DIP lenders’
new advances typically have priority in the debtor’s assets over all prepeti-
tion claims, DIP lenders may bear no risk on their loans. In that circum-
stance, they have no reason to concern themselves with the debtor’s viability
and are not likely to provide useful signals.
55
Supra Part II.E.
56
See infra table 6.
57
Bobby Guy, Choosing a Venue in Chapter 11 Cases: A Practical View (Jan. 18,
2011), available at http://www.morrisanderson.com/company-news/entry/choosing-a-ven-
ue-in-chapter-11-cases-a-practical-view (“Because the DIP lender holds the cash, it general-
ly makes the rules about where to file the case. Many are the cases that were prepared for
one venue, only to be changed at the last minute to accommodate a newfound DIP lender’s
demands.”).
29. 2014 Forthcoming UCLA LAW REVIEW 29
F. Interest Rates
This study is the first to document the existence of a relationship be-
tween interest rates and bankruptcy survival. PRIMERATE is the prime rate
of interest one year prior to the bankrupt petition date. The prime rate of
interest is “the rate at which banks will lend money to their most-favored
customers.”58
The rates charged other borrowers are often set at prime plus
some risk differential. Thus, the prime rate is a measure of prevailing inter-
est rates in the U.S. economy.
We chose the interest rate one year prior to bankruptcy for inclusion in
our model because that was the prime rate most closely correlated with
BANKRUPTCYSURVIVAL (p <.001 in the best model). The prime rate two
years before filing was also closely correlated with BANKRUPTCYSURVIVAL
in the best model (p=.010), as was the prime rate at filing (p=.017). We
conclude that companies are more likely to survive bankruptcy during peri-
ods when interest rates are low.
The prevailing rates of interest may affect bankruptcy survival in at
least two ways. First, they may determine the interest rates debtors-in-
possession pay on DIP lending, exit financing, and over secured debt.59
Some debtors will fail because they cannot afford the higher rates. Second,
by raising the cost of cash, high interest rates may limit the cash available to
debtors in the pre-bankruptcy period. That shortage may do damage to the
debtor’s business that is no longer reversible at the time of bankruptcy.
G. Operating Income Before Filing
Operating income is the revenues of the business less expenses other
than interest and taxes (EBIT) or interest, taxes, depreciation and amortiza-
tion (EBITDA). Scholars generally regard operating income as the best
measure of “economic distress” and regard economic distress as the proper
criteria for determining which businesses should fail in bankruptcy.60
58
http://www.bankrate.com/rates/interest-rates/wall-street-prime-rate.aspx.
59
11 U.S.C. § 506(b) (providing for the allowance of interest on claims to the extent
that the value of collateral exceeds the amounts of the claims).
60
Kenneth Ayotte & David A. Skeel, Jr., An Efficiency-Based Explanation for Cur-
rent Corporate Reorganization Practice, 73 U. CHI. L. REV. 425, 468 (2006) (“A firm in
economic distress is not viable and should be shut down.”).
30. 30 BANKRUPTCY SURVIVAL
Lemmon, Ma, and Tashjian found a positive correlation between debt-
ors’ prepetition EBITDA-to-assets ratio61
(asset-normalized EBITDA) and
bankruptcy survival.62
Although we found a positive correlation between
debtors’ asset-normalized EBITDA and BANKRUPTCYSURVIVAL in bivariate
testing (p=.003), that variable was not statistically significant when we
added normalized EBITDA to our best model (p=.929) or substituted it for
EBITPOSITIVE in our model. (p=.818).
We include a different operating income variable in our model.
EBITPOSITIVE is a dummy variable that is positive when the debtors’ EBIT
is positive. EBITPOSITIVE is significantly correlated with BANKRUPTCY-
SURVIVAL directly (p=.001) and in our best model (p=.038).
We think two factors explain why EBITPOSITIVE is a stronger predictor
of BANKRUPTCYSURVIVAL than asset-normalized EBITDA. First, EBIT
includes depreciation and amortization, making it a more accurate measure
of the expenses that a debtor must cover to survive. Bankruptcy eliminates
debt and the accompanying interest, but it does nothing to eliminate depre-
ciation and the accompanying need for asset replacement. Second, what
matters most to survival is whether EBIT reaches the minimum level neces-
sary for the firm to survive. The amount by which EBIT exceeds or falls
short of that minimum is less important. Although EBITPOSITIVE is not a
perfect measure of that minimum, it is close enough to produce good results
in the model.
EBIT’s effect on bankruptcy survival is direct. Operating losses may be
cause for conversion to Chapter 7 liquidation. In addition the debtor must
have positive EBIT sufficient to cover its post-bankruptcy debt service in
order to achieve long-term viability. If the debtor’s plan is incapable of
achieving that level of EBIT, the plan is not feasible and the law requires
that the court refuse to confirm it.63
61
Lemmon et al., supra note 9 (defining bankruptcy survival in a manner indistin-
guishable from BANKRUPTCYSURVIVAL).
62
See also David D. Dawley, James J. Hoffman & Erich N. Brockman, Do Size and
Diversification Type Matter? An Examination of Post-Bankruptcy Outcomes, 15 J.
MANAGERIAL ISSUES 413 (2003) (using EBIT as an independent variable and return to
performance parity with the debtor’s industry as the dependent variable).
63
11 U.S.C. §1129(a)(11) (requiring, as a condition of confirmation, that “confirma-
tion of the plan is not likely to be followed by the liquidation, or the need for further finan-
cial reorganization of the debtor . . .”).
31. 2014 Forthcoming UCLA LAW REVIEW 31
H. Equity Before Filing
“Equity,” as used here, means the debtor’s total assets minus the debt-
or’s total liabilities, as shown on the debtor’s balance sheet. EQUITYBEFORE
is the ratio of the debtor’s equity before bankruptcy to the debtor’s assets
before bankruptcy.
Although 60% percent of the debtors in our study reported positive
EQUITYBEFORE, probably few actually had assets worth more than their
liabilities before bankruptcy. The total distributions to secured creditors,
unsecured creditors, and equity (the debtors’ actual total assets) exceeded
the claims of secured creditors and unsecured creditors (the debtors’ actual
total liabilities), in only 4 of the 81 study cases for which distribution data
are presently available (5%). At least three factors combine to cause this
large difference between reported and realized equities. The first is the use
of book values that have not been adjusted for the companies’ financial
difficulties. The second is puffing as the companies struggle to survive.
The third is reductions in values resulting from the companies’ financial
problems.
EQUITYBEFORE is negatively correlated with BANKRUPTCYSURVIVAL
both directly (p<.001) and in the best model (p=.001). The greater the
debtor’s EQUITYBEFORE, the less likely the debtor is to survive bankruptcy.
The finding is counterintuitive because equity is generally regarded as a
measure of financial health, not financial weakness.
This inverse relationship between pre-filing equity and company sur-
vival has been documented by other scholars.64
Because they conceptualize
the relationship as a positive correlation between “leverage” and survival,
most have not viewed it as paradoxical or sought to explain it.65
The lack of a significant correlation between high leverage and
BANKRUPTCYSURVIVAL, would have been easy to explain. The bankruptcy
discharge cuts both high and low debts to the same level, so the amount of
64
E.g., Dahiya et al., supra note 9, at 271 (“Leverage shows up as positive and mar-
ginally significant in our regression . . . .”); Denis & Rodgers, supra note 9, at 113
(“[F]irms that have greater liability ratios prior to filing Chapter 11 are more likely to be
reorganized than to liquidate or be acquired.”); Lemmon et al., supra note 9, at 43-44
(finding the relationship between leverage and survival statistically significant at the 1%
level).
65
E.g., Dahiya et al., supra note 9, at 271 (mentioning the relationship but not provid-
ing any explanation).
32. 32 BANKRUPTCY SURVIVAL
that debt should have no effect on survival. What is difficult to explain is
why debtors with high leverage are significantly more likely to survive.
A “financially distressed” debtor is one that owes excessive debt; an
“economically distressed” debtor is one whose operating expenses are too
high in relation to its operating income.66
Some argue that because bank-
ruptcy is triggered by aggregate distress, severely financially distressed
debtors will tend to file with modest economic distress while severely eco-
nomically distressed debtors will tend to file with modest financial dis-
tress.67
Because bankruptcy is effective against financial distress but not
against economic distress,68
the financially distressed group tends to survive
while the economically distressed group tends to fail.69
The survivors are
the group that entered bankruptcy with higher leverage, and thus lower
EQUITYBEFORE.70
The argument is at least facially coherent.
Our data confirm parts of it. EQUITYBEFORE is the most direct measure
of financial distress. By discharging debt, bankruptcy provides an effective
remedy against financial distress. As shown in Table 7, 104 of 209 debtors
for whom data are available before and after bankruptcy (50%) reported
negative EQUITYBEFORE (insolvency) on their last annual report before
bankruptcy. Only 21 of those 209 debtors (10%) still reported negative
66
Robert K. Rasmussen & Randall S. Thomas, Timing Matters: Promoting Forum
Shopping by Insolvent Corporations, 94 NW. U. L. REV. 1357, 1408 (2000) (referring to
“the now standard distinction between financial distress – inability to pay debts – and
economic distress – inability of revenues to cover costs”).
67
E.g., Denis & Rodgers, supra note 9, at 113 (“To the extent that higher leverage
leads firms to become bankrupt more quickly, firms with higher pre-bankruptcy leverage
may be less economically distressed and, therefore, more likely to be able to reorganize and
emerge than lower leverage firms.”).
68
Douglas G. Baird, Bankruptcy’s Uncontested Axioms, 108 YALE L.J. 573, 582
(1998) (“If a firm is in economic distress (but not financial distress), it does not belong in
bankruptcy. If a firm is in economic distress but is properly in bankruptcy because of
financial distress, there is still no justification to intervene for reasons unrelated to financial
distress.”).
69
Robert K. Rasmussen & Randall S. Thomas, Whither the Race? A Comment on the
Effects of the Delawarization of Corporate Reorganizations, 54 VAND. L. REV. 283, 306-07
(2001) (“[W]e would want to define a high risk bankruptcy using measures of economic
distress or financial distress, so that a higher risk company would be one that is deeper in
the hole and less likely to emerge than a lower risk company.”).
70
Lemmon at al., supra note 9, at 15 (“[W]e expect that firms entering Chapter 11
primarily because of financial distress will be more likely to reorganize and emerge, and
that firms entering Chapter 11 primarily due to economic distress will be more likely to
have their assets redeployed via liquidation or acquisition.”).
33. 2014 Forthcoming UCLA LAW REVIEW 33
EQUITYBEFORE on their first annual report after emergence. If financial
distress is defined as reporting insolvency, 83 of 209 surviving debtors
(40%) recovered from their financial distress during bankruptcy. Those 83
are 80% of the 104 debtors reporting pre-bankruptcy insolvency.
Table 7. Change from insolvency to solvency during
bankruptcy (from before filing to after emergence)
Before
filing
After
emergence
Net
difference
Insolvent 104
(50%)
21
(10%)
83
(40%)
Solvent 105
(50%)
188
(90%)
-83
(-40%)
Total
cases
209
(100%)
209
(100%)
0
(0%)
Figures include only surviving firms
Chi-square, p<.001
By contrast, bankruptcy provides only indirect and highly ineffective
remedies for economic distress. First, bankruptcy stays creditor collection
efforts during the pendency of the bankruptcy cases. That provides the
debtor with time to make changes in the business. Second, bankruptcy
enables debtors to borrow money during their cases by allowing debtors to
grant new lenders priority over prepetition creditors. Debtors can use the
new money to replenish the firm’s working capital and to finance changes in
the business. Third, the bankruptcy process tends to force changes in man-
agement,71
which may facilitate changes in company policies.
Our data confirm the ineffectiveness of bankruptcy in dealing with eco-
nomic distress. Operating income (EBIT) is the most direct measure of
economic distress. As shown in Table 8, 84 of 182 debtors for whom data
are available (46%) reported negative EBIT on their last annual report be-
fore bankruptcy. Seventy-six of those debtors (42%) still reported negative
EBIT on their first annual report after emergence. If economic distress is
defined as having negative EBIT, only 8 of 84 surviving debtors (10%)
recovered from their economic distress during bankruptcy.
71
Lynn M. LoPucki & William C. Whitford, Corporate Governance in the Bankrupt-
cy Reorganization of large, Publicly Held Companies, 141 U. PA. L. REV. 669, 723-37
(reporting high levels of CEO turnover).
34. 34 BANKRUPTCY SURVIVAL
Table 8. Change from negative to positive EBIT
during bankruptcy (from before filing to after
emergence)
Before
filing
After
emergence
Net
difference
Negative
EBIT
84
(46%)
76
(42%)
8
(4%)
Positive
EBIT
98
(54%
106
(58%)
-8
(-4%)
Total
cases
182
100%
182
(100%)
0
(0%)
Figures include only surviving firms
Chi-square, p=.398
For financial distress to explain the inverse relationship between
EQUITYBEFORE and BANKRUPTCYSURVIVAL, debtors with more financial
distress must have less economic distress. If so, one would expect to find an
inverse relationship between EQUITYBEFORE and EBITPOSITIVE.72
To the contrary, we found that EQUITYBEFORE was not significantly
correlated with our measure of economic distress, EBITPOSITIVE (p=.931), or
with either of two other measures of economic distress.73
Bankruptcy’s
greater effectiveness against financial distress cannot alone explain the
inverse relationship between EQUITYBEFORE and BANKRUPTCYSURVIVAL.
Professor Michael Jensen has offered an alternative explanation. Jensen
theorizes that highly leveraged firms are less likely to liquidate in bankrupt-
cy because the high leverage triggers their bankruptcies while their going
concern values are still much higher than their liquidation values.74
Further
research is needed to verify or disprove Jensen’s explanation.
I. Plan Prenegotiation
Some debtors negotiate their reorganization plans with creditors prior to
filing bankruptcy. Although definitions vary, three levels of “prenegotia-
tion” are commonly recognized. Under the BRD protocols, a case is “pre-
72
See Denis & Rodgers, supra note 9.
73
The other measures are EBIT before bankruptcy (p=.321) and EBIT before bank-
ruptcy as a percentage of assets before bankruptcy (p=.895).
74
E.g., Michael C. Jensen, Eclipse of the Public Corporation, HARV. BUS. REV.
(Sept.-Oct. 1989) (revised 1997), at 24-26 (providing an example in which the bankruptcy
of a high leverage firm is triggered before firm value falls below liquidation value, but the
bankruptcy of a low leverage firm is not).
35. 2014 Forthcoming UCLA LAW REVIEW 35
packaged” if, prior to bankruptcy, the debtor drafted a plan, circulated it to
creditors, and obtained sufficient acceptances to entitle the debtor to plan
confirmation.75
A case is “prenegotiated” if, prior to bankruptcy, the debtor
drafted at least a term sheet for a plan and obtained the consent of at least
one major creditor constituency to those terms. A case is “free fall” if the
case is neither prepackaged nor prenegotiated. The resulting variable is
continuous with a value of 2 for a prepackaged case, 1 for a prenegotiated
case, and 0 for a free fall case.
Columns (1) through (4) of Table 9 show the relationship between
PRENEGOTIATION and BANKRUPTCYSURVIVAL. None of the debtors filing
prepackaged cases failed during those cases. Fifteen percent of the debtors
filing prenegotiated cases failed, and 40% of the debtors filing free fall cases
failed. The BANKRUPTCYSURVIVAL rate varies sharply by PRENEGOTIATION
level. Other researchers have also found measures of prenegotiation to be
positively correlated with measures of bankruptcy survival.76
Table 9. Prenegotiation by Bankruptcy Survival and Case Duration
(1)
Type
(2)
Failed
(3)
Survived
(4)
Total
(5)
Mean days
in
bankruptcy
(6)
Total days
in
bankruptcy
(7)
Failures per
10,000
days
Free fall
167
(40%)
250
(60%)
417
(100%)
640 266,880 6.3
Prenegotiated
23
(15%)
128
(85%)
151
(100%)
240 36,240 6.4
Prepackaged
0
(0%)
66
(100%)
66
(100%)
68 4,488 0
Total
190
(30%)
444
(70%)
634
(100%)
307,608 6.2
p <.001, Chi-square
Comparison of the success rates for the three kinds of cases with the du-
ration of the three kinds of cases (columns (3) and (5) of Table 9) reveals a
strongly negative correlation. Success rates are lowest in the longest kinds
of cases. That raises the possibility that mere passage of time rather prene-
75
Cases are not prepackaged merely because the debtor has agreed, prior to bankrupt-
cy, to sell its business to a third party.
76
Carapeto, supra note 8, at 50 (prepackaged variable included in regression with no
report of statistical significance); Dahiya et al., supra note 9, at 613 (prenegotiation variable
statistically significant).
36. 36 BANKRUPTCY SURVIVAL
gotiation accounts for the differences in failure rates. To investigate, we
calculated the failures rates per 10,000 days in bankruptcy for each kind of
case. Those rates appear in Column (7) of Table 9.
The failure rate for prepackaged cases – zero in 4,488 days of exposure
to bankruptcy – is marginally statistically significantly smaller (p=.093)
than the failure rates for prenegotiated and free fall cases. We think the
absence of failure in the prepackaged cases results from a selection effect.
Companies know that failure is imminent for some period of time before
failure occurs. If failure is imminent, the companies do not file their pre-
packaged plans. As a result, companies that are planning prepackaged cases
may fail, but they do not fail during their bankruptcy cases.
The difference in free fall and prenegotiated survival rates is almost
perfectly offset by the difference in free fall and prenegotiated case dura-
tions. The result is survival rates per 10,000 days in bankruptcy that are
nearly identical for the two kinds of cases. Alone, that result suggests that
the differences in case durations explain the differences in BANKRUPTCY-
SURVIVAL. In fact they do not.
CASEDURATION is a variable that measures the length of a bankruptcy
case in days, from filing to plan confirmation, conversion to chapter 7, or
dismissal. We excluded CASEDURATION from our regression model because
it cannot be observed until the end of the case. But if CASEDURATION is
added to our model, it is inversely correlated with BANKRUPTCYSURVIVAL
and not quite marginally significant (p=.104). PRENEGOTIATION remains
positively correlated with BANKRUPTCYSURVIVAL and statistically signifi-
cant (p=.013). Thus PRENEGOTIATION has a statistically significant effect
on BANKRUPTCYSURVIVAL even when controlling for the length of the
bankruptcy case. We conclude that PRENEGOTIATION and CASE-DURATION
are not mere substitutes for one another. Instead, they affect
BANKRUPTCYSURVIVAL in different ways.
We think PRENEGOTIATION affects BANKRUPTCYSURVIVAL through
two mechanisms. First, if a company has a high probability of survival, the
interests of the creditors and the company (the managers) are more likely to
be aligned. Both will tend to prefer that the company continue in business.
But if a company has a low probability of survival, the interests of the credi-
tors and the company are probably in conflict. Creditors may prefer a quick
failure, before unprofitable operations consume the remaining assets.77
77
E.g., ATP Motion to Convert, supra note 45.
37. 2014 Forthcoming UCLA LAW REVIEW 37
Debtors have nothing to gain from a quick failure, and so may want to
continue the business in the hope of an improbable turnaround. Because
debtor and creditor interests are aligned in high-probability-of-survival
cases, debtors and creditors are likely to reach agreement. Because debtor
and creditor interests are in conflict in low-probability-of-survival cases,
debtors and creditors are not likely to reach agreement. Thus, the inherent
strength of the business causes both PRENEGOTIATION and BANKRUPTCY-
SURVIVAL.
Second, successful prenegotiation with one major constituency prior to
filing signals to others constituencies – including the debtor’s employees,
suppliers, and customers – that the debtor’s business is likely to survive.
Those constituencies become more willing to continue dealing with the
debtor during bankruptcy, increasing the likelihood that the debtor will
survive. Through this mechanism, PRENEGOTIATION may in part cause
BANKRUPTCYSURVIVAL.
J. Manufacturer
“Manufacturer” is a dichotomous variable that indicates whether the
debtor’s principal SIC division immediately prior to bankruptcy was “manu-
facturing.” Of the 674 debtors studied, 253 (38%) were manufacturers.
Manufacturers file bankruptcy at a higher rate than do other kinds of
businesses.78
When they do file bankruptcy, they are more likely to survive.
The survival rate for manufacturers was 77% (187 of 242), as compared
with 66% (257 of 392) for debtors in other classifications. The difference is
statistically significant (p=.002).
The disproportionate ability of manufacturing firms to survive bank-
ruptcy has previously been reported.79
Manufacturing firms tended to be larger than other firms, and
their size may have contributed to their ability to survive. One
78
The proportion of manufacturing companies among the companies included in the
Compustat database with assets in excess of $282 million for the years 2004-13 is 28%
(10,385 of 37,371 annual reports). The proportion of manufacturing companies among the
companies included in the BRD for the same period is 36% (113 of 318 companies). The
difference is statistically significant (p<.001).
79
Lynn M. LoPucki, The Debtor in Full Control – Systems Failure Under Chapter 11
of the Bankruptcy Code?, 57 AM. BANKR. L.J. 99, 108 (1983) (“Manufacturers were suc-
cessful in eight of fourteen resolved cases (57%); all other types of businesses were suc-
cessful in only three of twenty six cases (12%), making the success rate for manufacturers
almost five times the success rate for other businesses.”).
38. 38 BANKRUPTCY SURVIVAL
of the bankruptcy judges commented that manufacturing firms
are often engaged in diverse projects and can sever the least
profitable in financial crisis. One of the attorneys interviewed
suggested that manufacturing firms are dependent on fewer out-
siders as suppliers of materials or credit, or as purchasers of its
products.80
K. Company Size
COMPANYSIZE is the log of the total assets of the company, stated in
millions of current dollars. We chose assets over two other measures of size
because assets slightly outperformed them in our best model.81
A third
measure of size, liabilities, perfected equally as well as assets. We chose
assets over liabilities because prior bankruptcy survival research used and
reported on assets. That research found positive and significant correlations
between bankruptcy survival and company size, measured by assets.82
COMPANYSIZE is directly correlated with BANKRUPTCYSURVIVAL
(p=.024) and in our best model (p=.048). Others have previously found
stronger correlations between assets and survival. But they did so in models
that included fewer variables.83
We think the mechanism by which this variable affects survival is that
large companies are typically engaged in multiple lines of business. They
can shed unprofitable lines while continuing in profitable lines.
L. Non-Qualifying Variables
We tested numerous variables that did not qualify for inclusion in the
model. A few are worthy of mention.
We tested whether the debtor-in-possession’s lead law firm’s experi-
ence in BRD cases (DIPATTORNEYEXPERIENCE) was correlated with
BANKRUPTCYSURVIVAL. We found that it was significantly directly corre-
lated (p<.001). Companies with experienced lead law firms are more likely
80
Id.
81
Those measures were (1) the number of persons the debtor employed before bank-
ruptcy and (2) a variable that took several measures of size into account.
82
Denis & Rodgers, supra note 9, at 112 (“The coefficient on firm size is positive and
significant at the 10% level when reorganization is compared to . . . acquisition and liquida-
tion combined.”); Dahiya et al., supra note 9, at 272 (assets significant at the 1% level);
Lemmon et al., supra note 9, at 43-44 (assets significant at the 1% level).
83
Dahiya et al., supra note 9, at 269 (significant at the 1% level).
39. 2014 Forthcoming UCLA LAW REVIEW 39
to survive. But DIPATTORNEYEXPERIENCE was not significantly correlated
with BANKRUPTCYSURVIVAL when controlling for the eleven variables in
our best model (p=.594). We conclude that the experience of the debtor-in-
possession’s lead law firm is a predictor of bankruptcy survival, but not as
strong a predictor as the other variables in our best model. In bivariate
testing, we found a marginally significant, positive correlation between
BANKRUPTCYSURVIVAL and the length of time the CEO who served on the
date of filing had been in that position (CEOEXPERIENCE) (p=.075). Compa-
nies with longer-serving CEOs were more likely to survive.
We also tested the relationship between changes in gross domestic
product (GDP) before and during bankruptcy and BANKRUPTCYSURVIVAL.
Two measures were significant in bivariate testing. First, companies that
filed during a recession year were significantly more likely to survive
(p=.023). Second, companies were less likely to survive to the extent that
GDP increased in the second year before their filing (p=.002). We think
both these effects have a single explanation. Companies that file while the
economy is good are weaker than those that file while the economy is bad.
Neither of these GDP variables was significant when added to our best
model.
Scholars assume that secured creditors favor liquidation.84
If so, one
might expect that secured debt would be correlated with firm failure.85
Contrary to that expectation, Jenkins and Smith report a positive correlation
between bankruptcy survival and the secured debt coverage ratio (defined as
the ratio of secured claims to total distribution to creditors and equity).86
84
E.g., Kenneth M. Ayotte & Edward R. Morrison, Creditor Control and Conflict in
Chapter 11, 1 J. LEGAL ANALYSIS 511 (2009) (“Oversecured creditors will prefer an
immediate resolution.”); Ran Barniv, Anurag Agarwal & Robert Leach, Predicting Bank-
ruptcy Resolution, 29 J. BUS. FIN. & ACCT. 497, 508 (2002) (“[A] secured-debt claimant
would tend to promote liquidation.”).
85
Lack of an accurate measure of secured debt has hampered research. For example,
Compustat provides a secured debt variable, but that variable often drops precipitously right
before bankruptcy. It does so because Compustat moves secured debt into current liabilities
upon default. See, e.g., Dahiya et al., supra note 9; Lemmon et al., supra note 9, at 7
(referring to “data errors that can arise from reclassifications of longer-term debt in the 10K
filings and in Compustat”).
86
Mark Jenkins & David C. Smith, Creditor Conflict and the Efficiency of Corporate
Reorganization at 18 (unpublished manuscript), available at http://papers.ssrn.com/sol3/pap
ers.cfm?abstract_id=2444700 (“[T]he probability of reorganization appears to be positively
related to secured debt asset coverage over the range of ln(Ui
*
/S) in our sample.”).
40. 40 BANKRUPTCY SURVIVAL
The higher a company’s secured debt coverage, the more likely the compa-
ny will survive.
From BRD data, we were able to calculate the secured debt coverage
ratio for 81 of the cases in our study. That ratio was inversely correlated
with BANKRUPTCYSURVIVAL and not statistically significant (p=.496). Our
finding is inconsistent with Jenkins and Smith’s.
Jenkins and Smith also report “a statistically significant increase in liq-
uidation frequencies when [the secured debt coverage ratio] is close to
one.”87
The gist of their explanation for the latter is that when the amount of
the secured debt clearly exceeds the value of the business, the secured credi-
tor is in control and has the incentive to make the right continuation deci-
sion. When the amount of the secured debt is clearly less than the value of
the business, the junior creditors are in control and have the incentive to
make the right continuation decision. But when the amount of the secured
debt is approximately equal to the value of the business, the secured creditor
bears the risks of continued operation while the junior creditors claim the
benefits. In this situation, secured creditors force inefficient liquidations.88
As shown in Figure 4, our data are consistent with Jenkins and Smith’s
finding. The dip in survival rate that appears in their data when the coverage
87
Id. at 18.
88
Id. at 3.
41. 2014 Forthcoming UCLA LAW REVIEW 41
ratio is approximately equity to 100% also appears in our data. If Jenkins
and Smith are correct, these dips represents additional business failures
caused by secured debt and excessive legal deference to secured creditors’
interests.
IV. A FIVE-DECISION MODEL OF BANKRUPTCY SURVIVAL
Figure 5 is a path model of bankruptcy survival. The paths are the ar-
rows. They represent hypothesized causal effects of variables on other
variables. Our statistical analyses indicate that all of the arrows in this
diagram (except that from Random draw to JUDGEEXPERIENCE) represent
significant or marginally significant correlations.89
We hypothesize that
causation runs in the directions of the arrows, except that the relationship of
EQUITYBEFORE to BANKRUPTCYSURVIVAL is not causal at all.
The shaded variables identify the model’s five decisions. Each decision
is made shortly before, or early in, the bankruptcy process. Several actors
89
The regressions are specified in the Stata do file (on file with authors).
42. 42 BANKRUPTCY SURVIVAL
participate. CREDITORSCOMMITTEE is the U.S. Trustee’s decision to appoint
a creditor’s committee. SALEINTENDED is a decision by the company to
issue a press release indicating an intention to sell the company. DIPLOAN is
the confluence of a decision by the debtor to seek a DIP loan, a decision by
a creditor to provide the DIP loan, and a decision by the court to approve the
DIP loan. PRENEGOTIATION is a decision by the debtor to negotiate with
creditors prior to filing the case, and a decision by some creditors to reach
agreement with the debtor. SHOP is a decision formally made by the debtor
to file the case in a particular court. Attorneys, DIP lenders, and courts
acting in earlier cases may influence that decision.90
The arrows show that the effect of any single variable on BANKRUPTCY-
SURVIVAL can be direct, indirect, or both. For example, EBITPOSITIVE has a
direct effect on BANKRUPTCYSURVIVAL. In addition, it has indirect effects
on BANKRUPTCYSURVIVAL through its direct effects on SALEINTENDED and
PRENEGOTIATION. The total effect of EBITPOSITIVE on BANKRUPTCY-
SURVIVAL is the sum of its direct and indirect effects.
DIPATTORNEYEXPERIENCE has no direct effect on BANKRUPTCY-
SURVIVAL.91
But DIPATTORNEYEXPERIENCE affects JUDGEEXPERIENCE
both directly and indirectly through its effect on SHOP. Experienced attor-
neys are more likely to forum shop and so to bring their cases before more
experienced judges. The tradition of randomly assigning cases within a
panel of judges acts as a limit on the attorneys’ efforts.
Each of the five decisions is in part merely a response to upstream con-
ditions. But in each there may be opportunities to innovate in ways that will
alter the effects of the upstream variables on BANKRUPTCYSURVIVAL. Thus,
the model demonstrates that BANKRUPTCYSURVIVAL is not merely a func-
tion of the strength of the debtor’s business. Prepetition and immediately
postpetition decisions in part determine whether debtors will survive.
V. CONCLUSION
This Article is the culmination of a long and extensive data collection
project designed to discover the determinants of success in the bankruptcy
reorganization of large, public companies. It presents the first comprehen-
sive model for predicting which businesses will survive bankruptcy. The
90
LYNN M. LOPUCKI, COURTING FAILURE 138-39 (2005) (describing the involvement
of these three groups in forum shopping).
91
See supra Part III.L.
43. 2014 Forthcoming UCLA LAW REVIEW 43
variables that directly predict success are lack of an announcement by the
debtor of an intention to sell the business, the judge’s level of experience in
big bankruptcy cases, the level of prenegotiation of the debtor’s plan, the
existence of positive EBIT prior to filing, the proximity of the debtor’s
headquarters to the local bankruptcy court, the size of the debtor-company,
the size of the debtor’s negative equity, a low prime rate of interest during
the approach to bankruptcy, the fact the debtor is a manufacturer, the exist-
ence of a DIP loan, and the lack of a creditors’ committee.
The relationship between JUDGEEXPERIENCE and BANKRUPTCY-
SURVIVAL is probably the most important discovery to result from this
study. Our finding suggests that bankruptcy system participants can in-
crease the survival level, simply by shifting cases to more experienced
judges.
Our findings also suggest that greater attention by system participants to
five decisions may have the potential to increase the survival rate. The first
is the choice of a bankruptcy court, because that choice can increase the
likelihood of having an experienced judge, which in turn may increase the
survival rate. The second and third are the decisions of debtors and credi-
tors to prepackage or prenegotiate plans and obtain DIP loan approval.
Prenegotiations and DIP loans increase the survival rate. The fourth is the
debtor’s decision to announce an intention to sell the business. Such an
announcement may be necessary, but it may also increase an already high
risk of failure. The last is the U.S. Trustee’s decision to appoint a creditors’
committee. Appointment of a committee increases the risk of failure.
Through greater attention to these decisions, system participants may be
able to increase the bankruptcy survival rate.
Efforts to improve the bankruptcy survival rate must take into account
that mere survival is not success. Debtors may survive bankruptcy only to
fail in its wake. But bankruptcy survival may have value even in that worst-
case scenario. It enables the business to continue for some period of time.
During that period, employees have work, the company’s suppliers have a
customer, and the company’s customers are able to receive its products and
services. Everyone has time to adjust to the changing situation.