A Review on Integrated River Basin Management and Development Master Plan of ...
Using Landsat 7 Data to Understand Changes in Cropping Patterns over the Middle Rio Grande Basin
1. Using Landsat 7 Data to Understand Changes in
Cropping Patterns over the Middle Rio Grande Basin
Thomas Poulose, Saurav Kumar, Yohtaro Kobayashi, Karla Madriles Ortiz, Wissam Atwah, Habibur Howlider, Girisha Ganjegunte
University of Texas at El Paso and Texas AgriLife
Introduction
Middle Rio Grande basin covers the watershed of the Rio Grande from
downstream of Elephant Butte (EB) reservoir to the entrance of the Rio
Conchos from Mexico. The watershed is over 14,000 sq miles and
covers parts of Chihuahua, New Mexico, and Texas. Agriculture is on
the major economic activities in the watershed. Cotton, pecan, onion,
pepper and alfalfa are the major crops grown in this watershed.
Objective
1. To understand changing crop type in the cultivated area of the
middle Rio Grande region by classifying area under cotton, pecan,
onion, pepper and alfalfa crops.
2. To model changes in soil salinity for each crop type over last two
decades using spectral indices.
Methodology
1. Classification
Features (134 Bands):
§ Landsat bands monthly cloud free median (7 x 12 = 84) 30m
§ Monthly NDVI (12) 30m
§ Monthly CRSI (12) 30m
§ Global elevation (1) 90m
§ Global slope (1) 90m
§ Global monthly ET (12) 1000m
§ Elephant Bute monthly flows (12)
Targets:
Cultivated / Uncultivated 2017
Crop Type 2017
2. Soil Salinity
§ Model is developed using the linear relationship between CSRI
and crop type to map soil salinity in the region.
§ Linear relationship of CRSI with soil salinity can be used to
develop the EC value using the method developed by Scudiero
et. al (2015) for San Joaquin Valley.
Where, a, b, c & d are variables and ej is the random error
component at each locations.
CRSI =
!"# $ #%& '()*%%+ $ ,-.%)
!"# $ #%& 0()*%%+ $ ,-.%)
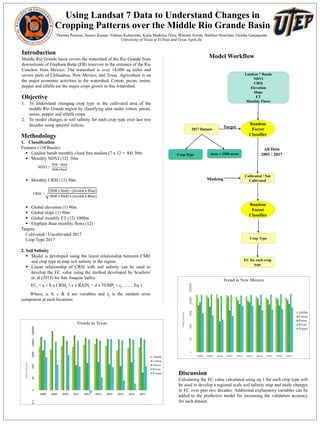
Model Workflow
Discussion
Calculating the EC value calculated using eq 1 for each crop type will
be used to develop a regional scale soil salinity map and study changes
in EC over past two decades. Additional explanatory variables can be
added to the predictive model for increasing the validation accuracy
for each dataset.
NDVI =
!"# '#%&
!"#0#%&
ECj = a + b x CRSIj + c x RAINj + d x TEMPj + ej ……. Eq 1
Landsat 7 Bands
NDVI
CRSI
Elevation
Slope
ET
Monthly Flows
Random
Forest
Classifier
2017 Dataset
All Data
2001 - 2017Crop Type Area > 2500 acres
Crop Type
Cultivated / Not
Cultivated
Target
Masking
Random
Forest
Classifier
EC for each crop
type
0.1110100100010000100000
2008 2009 2010 2011 2012 2013 2014 2015 2016 2017
Area(Acres)
Trends in Texas
Alfalfa
Cotton
Onion
Pecan
Pepper
110100100010000100000
2008 2009 2010 2011 2012 2013 2014 2015 2016 2017
Area(Acres)
Trend is New Mexico
Alfalfa
Cotton
Onion
Pecan
Pepper