SlideShare a Scribd company logo
1 of 175
Download to read offline
Abt Associates
In collaboration with:
Avenir Health | Broad Branch Associates | Development Alternatives Inc. (DAI) | Johns Hopkins Bloomberg School of Public Health (JHSPH) |
Results for Development Institute (R4D) | RTI International | Training Resources Group, Inc. (TRG)
Hospital Costing Training:
Facilitator manual presentation
Prepared by: Sophie Faye,
Yann Derriennic, Romana
Haider, Christopher Cintron,
and Margaret Morehouse
Abt Associates
In collaboration with:
Avenir Health | Broad Branch Associates | Development Alternatives Inc. (DAI) | Johns Hopkins Bloomberg School of Public Health (JHSPH) |
Results for Development Institute (R4D) | RTI International | Training Resources Group, Inc. (TRG)
Session 1: Getting Started
Session Objectives:
At the end of the session, the participants will:
 Know and understand the workshop objectives
 Know and agree to workshop rules
 Get to know each other better
Getting Acquainted
In a moment, a question will appear on the screen.
When it appears, please find another person in the room
and share your response to the question on the slide with
each other.
This will happen three times. Each time you see a new
question, find a new person and share your responses.
4
What is one word your friends and colleagues
would use to describe you?
5
If you could have dinner with anyone in the
world, who would it be?
6
What is your favorite book and why?
7
Introductions
Please stand and tell us:
 Your name
 Your position and organization
 One specific thing you would like to learn about during this
workshop
8
Workshop Objectives
By the conclusion of this workshop, participants will:
 Understand the fundamental concepts involved with costing
 Understand the MASH costing tool and be able to apply it for
costing hospitals
 Understand the use of costing results for effective hospital
management
9
Agenda
Day 1 Day 2 Day 3
Morning  Welcome
 Hospital Costing 101
 Recap of Day 1
 Costs per:
► Department
► Outpatient visit
► Inpatient day
 Recap of Day 2
 Costs per specific
disease
Lunch
Afternoon
 Overview of the
MASH tool
 Costs per
► Department
► Outpatient visit
► Inpatient day
 Costs per specific
disease
10
Agreements
Start and end on time
Digital devices switched to vibrate
Please leave the room if you have to answer a call
Be curious; ask each other to expand contributions, and
ask if you don’t understand
Be a contributor; participate in large and small group
discussions
Avoid side conversations
11
Housekeeping
Participant manual
Restrooms
Breaks and meals
Fill the course registration sheet
Sign the course attendance sheet – every day
12
13
Abt Associates
In collaboration with:
Avenir Health | Broad Branch Associates | Development Alternatives Inc. (DAI) | Johns Hopkins Bloomberg School of Public Health (JHSPH) |
Results for Development Institute (R4D) | RTI International | Training Resources Group, Inc. (TRG)
Session 2: Introduction to Costing
Session Objectives
By the end of this session, participants will:
 Understand what costing is
 Know the purpose of costing
 Be able to name the types of costs and main costing
approaches
 Understand costing in a hospital context and know the steps of
such costing exercises
 Be introduced to the use of costing in the development of a
business plan
What is Costing?
Costing is the process of identifying the
costs of providing a defined unit of service
or product.
16
Important Concepts
Cost: a measure of the resources that are used up in the
production of a service or a product. Services or products
are therefore the outcome of the investment in resources
(the cost)
Value: how much buyers think the service is worth—how
much better off they think they are when they receive the
service
Price: what individuals are charged when they buy the
service
17
Purposes of Costing
Determine the price charged for a service or product
Conduct internal and external reporting and planning
Track expenditures against planned spending
Analyze types of costs that go into production
Plan for efficiency gains and increased revenue
Make key decisions to lower costs but maintain quality
18
Costs come in many forms
19
Cost Centers
Cost Centers are the smallest units producing
a service or a product and to which resources
(costs) can be allocated. For example, the
radiology department in a hospital.
20
Fixed and Variable Costs
Fixed costs: costs that regardless of the volume of
hospital services, remain constant at least in the short and
medium term
Variable costs: costs that vary depending on the volume
of production; they rise as production increases and fall as
production decreases
21
Direct and Indirect Costs
Direct Costs: costs that can be easily traced to a specific
cost object (service, product) or cost center
Indirect Costs: costs that are shared across different cost
centers, services, or products and which need to be
allocated, as they can’t be directly traced
22
Financial and Economic Costs
Financial costs: actual costs in terms of the measure of
resources used for the production of a service or product
Economic costs: differ from financial costs because they
account for items that enter the production process but
may not have a price
23
Recurrent and Capital Costs
Recurrent costs: costs that are consumed during the
course of a year, which might be needed every year.
Capital costs: costs of resources that are longer lived
(capital goods or fixed assets); these costs don’t need to
be incurred every year.
24
Depreciation
Depreciation: estimates how much of an asset is used up
each year
If the organization annually sets aside the sum calculated through
depreciation, by the end of the asset’s useful life, there should be
enough funds to replace the worn-out asset.
25
Total Costs
Total Costs are the sum of the monetary values of all
resources used in the production process of a given
service or product (fixed and variable, recurrent or capital,
financial or economic).
26
Unit Costs
Unit costs are costs per unit of service or product.
Two measures are used for unit costs:
 Average cost
 Marginal cost
27
Average and Marginal Costs
Average cost: total cost of production divided by the
number of units produced (both measured over a specified
accounting period)
Average costs tend to decrease as the amount of activity or
output increases and the fixed costs are shared out among more
and more units.
Marginal cost: cost of producing one extra unit of service
28
PRIMARY APPROACHES TO COSTING
29
Top-down Method
Identifies every major shared cost of the production
process (overhead costs like utilities, rent, maintenance,
etc.)
Also, takes into consideration departments that support
activities in logistical departments
Requires history and knowledge of production processes
to accurately define costs and the criteria for allocation of
each type of cost
30
Bottom-up Method
Costs are tallied upward, starting at the bottom or unit
level and accounting for each expected cost
Total costs should equal the finished project cost
 Pro: more accurate means of estimating total cost
 Con: time-consuming, need more detailed data, and more
expensive to realize
31
Hospital Costing
Provides the basic information needed by managers and
policy makers to:
 make decisions to improve performance
 compare performance of different hospitals to one another
Assigns monetary values to resources involved in hospital
operations
32
Importance of Hospital Costing
Allows policy makers and hospital managers to:
 Use scarce financial resources efficiently
Especially at public hospitals with limited external funds
 Reduce dependence on donor/government resources
 Have a means for routine management control
 Provide information to manage change
 Examine costs in connection with productive efficiency
 Plan for decreased wastage and increased revenue
 Draw conclusions on quality
 Implement a sustainable approach to providing care
33
EXERCISE 1: CLASSIFYING COSTS
34
Exercise 1
On page ___ in your participant manual, you will find
 A list of costs, extracted from a hospital annual financial report
(all costs are for 1 year)
 A matrix for classifying costs by type
 Financial information on the total cost of the outpatient general
department
Classify the costs by placing each cost in the appropriate
cell
Please work in pairs. You have 20 minutes.
35
Tea Break
36
PROCESS OF CONDUCTING A
HOSPITAL COSTING EXERCISE
37
Introduction
Costing studies can be performed across different settings
 hospitals or primary care centers
 at different levels, from a whole hospital to a hospital unit
Key steps that must take place pre-, during, and post-
costing exercise
38
Overview
Pre-Costing Steps
Costing Steps
 Post-Costing Steps
39
Pre-Costing Steps
Pre-Costing
 Step 1: Identify the hospital
 Step 2: Discuss with stakeholders
 Step 3: Identify costing method and data sources
 Step 4: Generate a protocol, timeline, and checklists
 Step 5: Prepare the costing tools and templates
 Step 6: Obtain ethical review board approval
 Step 7: Identify and train data collectors
 Step 8: Sensitize hospital staff
40
Costing Steps
Costing
 Step 9: Collect and validate data
 Step 10: Use the MASH tool for cost calculation
 Step 11: Validate preliminary results with hospital management
and providers
 Step 12: Collect additional data and perform additional analysis
if needed
41
Post-Costing Steps
Post-Costing
 Step 13: Finalize the costing results, if additional data collection
or analysis has been performed
 Step 14: Draft the costing report
 Step 15: Present the costing results
42
Illustration of Hospital Costing:
Saint Polycarp Hospital, Haiti
Background
 Faith-based facility
 Mission to provide high-level pediatric services to poor or
disadvantaged populations
 Situated near Port au Prince
 Mostly financed by international donors and user fees provide
<7% of resources
 Requires alternative revenue generation strategies because of
reduction in donor funds
43
Illustration of Hospital Costing:
Saint Polycarp Hospital, Haiti
Problem statement
 Hospital is considering providing some services at full cost, with
markup, to clients who can afford them
 Location enables capture of middle-class patients
 Cannot price these services without full costs
 Reasons for costing study:
1) Set prices for services
2) Provide information to donors on what their support
“buys”
3) Know cost of providing primary care (to consider if more
cost efficient to externalize primary care to sister hospital)
44
Illustration of Hospital Costing:
Saint Polycarp Hospital, Haiti
Unit of analysis
 Cost per type of service/disease
 SPH defined the services/diseases considered
45
Illustration of Hospital Costing:
Saint Polycarp Hospital, Haiti
Method of costing/Cost calculations
 Mixed approach method
Top-down approach for overhead costs in producing of
services
Bottom-up approach for resources used in producing
services
Final cost per service/disease:
 Follows principle of full absorption
 Accounts for all direct and indirect costs of production
46
Abt Associates
In collaboration with:
Avenir Health | Broad Branch Associates | Development Alternatives Inc. (DAI) | Johns Hopkins Bloomberg School of Public Health (JHSPH) |
Results for Development Institute (R4D) | RTI International | Training Resources Group, Inc. (TRG)
Thank you
Photo Credit: Colby Gottert/Digital Development Communications
Lunch
48
Abt Associates
In collaboration with:
Avenir Health | Broad Branch Associates | Development Alternatives Inc. (DAI) | Johns Hopkins Bloomberg School of Public Health (JHSPH) |
Results for Development Institute (R4D) | RTI International | Training Resources Group, Inc. (TRG)
Session 3
Overview of the MASH Tool
Session Objectives
By the end of this session, participants will:
 Be introduced to the MASH tool
 Know various audiences/users of the MASH tool
 Deepen their understanding of different types of costs
 Be introduced to hospital services and outputs and how to
measure them (indicators)
 Be introduced to the concept of cost centers
 Know some of the use of costing results
THE MASH TOOL
51
What is MASH?
MASH – Management Accounting System for Hospitals
 Developed from hospital costing studies in several countries
Excel-based framework of several interrelated
spreadsheets
 Tracking and analyzing services, resources, costs
 Useful for routine management or initiating changes
 Makes resource and service management easy to understand
52
MASH Audiences & Uses
Hospital managers – setting prices, negotiating
contracts, managing capacity, modeling changes
Hospital department heads – monitoring budgets,
comparing care and management strategies
Care purchasers – comparing hospitals to make funding
and contract decisions
53
MASH Audiences & Uses, continued
Regulators and Auditors – evaluating hospital
performance, making internal (between departments) and
external (between hospitals) comparisons
Health Financing and Operations Analysts –
recommending policies on resource allocation and care
purchasing
54
Visualization of MASH Inputs and Outputs
55
Note: For the purpose of this training, we are only interested in the first output
of MASH: “Unit Costs.” We won’t be exploring the process of getting the
other two outputs.
Preparing to Use MASH
Identify and collect data in the form of:
 Costs
 Services
 Outputs
 Cost Centers
56
Data Collection for MASH
Two main methods for collecting qualitative and quantitative
information:
document review
 the process of extracting relevant information from available
documents into spreadsheets
field data collection
 observations of the day-to-day functioning of the hospital
 guided visits conducted in selected departments to understand
their structure and health services production process.
57
Document Review: Relevant Information
 Organization of health care provision in the country and in the
hospital
 Health financing arrangements
 Studies of health care cost already done for the hospital
 History of the hospital
 Legal status of the hospital
 Demand for care from the population
 Hospital activity and financial documents and reports
 Inventory of medical and non-medical equipment
 List of the main services provided by the hospital
58
Preparing for Field Survey
Working sessions should be held with different hospital
staff, before the active field survey phase. These
individuals include:
 Hospital executives
 Resource persons on the management committee of the
hospital
 The heads of teams or medical and non-medical departments of
the hospital
 Health workers directly involved in the treatment of pathologies
that were identified for the costing
59
Field Data Collection
Should begin as soon as the document review is
completed or very advanced.
Information will be collected using standardized forms to
capture inputs in the chain of health care production
60
Field Data Collection
Health information from monthly reports
If reports are not available, they must be reconstructed in
collaboration with hospital staff
Information on the quantity of drugs consumed, collected
from the procurement office, the central pharmacy, or from
department records
Here, too, if the data are not immediately available, they
will have to be reconstituted manually.
61
Field Data Collection
If the data need to be reconstructed, an observation
period may be needed to estimate the exact level of
resources that go into producing these services.
Observation period is selected based on the intensity of
services provided during each period of the year
The field data collection takes place over a period of 4
weeks (or more or less)
62
COSTS
63
Costs
Start by identifying and quantifying hospital resources:
 Labor
 Supplies
 Equipment
 Buildings
 Land
Assign monetary values to those resources so they can be
compared, analyzed in a common unit, money
64
Costs, continued: types of costs
Same types of costs covered in Session 2: Costing 101
 Fixed and Variable
 Direct and Indirect
 Financial and Economic
 Recurrent and Capital
Important to distinguish, as hospital costing usually covers one-year
period
Depreciation cost is what will be accounted for in capital costs
 Unit Costs – mainly average cost
 Total and Full costs
65
HOSPITAL SERVICES AND OUTPUTS
66
Hospital Services
MASH aims to cost the services offered by a hospital in
relation to the output of those services
 e.g., cost of all newborn deliveries divided by number of
deliveries
Three main hospital functions
 Patient Care
 Teaching
 Research
MASH focuses on patient care, the main goal of hospitals
67
Hospital Services, continued:
Classification of Hospital Services
68
Hospital Services, continued: Patient Care
All activities involving provision of care to patients, at the
hospital or in the community by hospital staff
Outpatient care – treatment without hospitalization
Day patient care – requiring a hospital bed for recovery
or invasive treatment, but for less than a day
Inpatient care – spending more than one day in hospital
69
Hospital Services, continued:
Support Services
Patient care is supported by intermediate medical and
non-medical services, such as:
 Pharmacy
 Diagnostics
 Laundry
 Kitchen
 Administration
 Transport
70
Service Output Measures
Service outputs must be quantified for use
MASH is most concerned with final patient care measures
 3 inpatient measures
 3 outpatient measures
71
Service Output Measures: Inpatient Services
Number of inpatients – admitted for at least one night
and counted during daily census
Number of patient days – completed days spent in
hospital, also called length of stay
Number of episodes of patient care – a period of
treatment corresponding with clinical intentions and
treatment goals
 e.g., inpatient case changes from acute to non-acute = 2
episodes
72
Service Output Measures: Outpatient Services
Number of outpatient visits – contact between patients
and staff either in office or outreach setting
Finished episodes of outpatient care – completion of
clinical goals or guidelines for care
 e.g., patient recovery, counsel given, appropriate test performed
Number of procedures – indicator of a specific activity
 e.g., specific lab tests, surgeries, treatments
73
COST CENTERS
74
Cost Centers
MASH is structured around cost centers, also called
departments
Cost Centers are the smallest hospital units that create a
product or range of services to which hospitals allocate
cost
Defining cost centers should be a collaborative process
between the costing experts, hospital staff, and
administrators
75
Cost Center Guidelines
Cost centers should:
 Group activities together that have common management,
inputs, space, and staff
 Be associated with a single product or service, e.g., surgery,
outpatient visit, lab test
Where more detail is needed, cost centers can be more specific, e.g.,
types of surgery, lab test, disease-specific visits
 Reflect the way information is already managed/collected, and
follow national guidelines so comparisons can be made
76
Cost Centers, continued: Types of Cost
Centers
There are 3 main types of cost centers:
 Final cost centers
 Intermediate medical cost centers
 Intermediate non-medical cost centers
77
Final Cost Centers
Final Cost Centers, (revenue earning cost centers), are:
 Directly involved in the production of billable hospital services
 Medical in nature
Outpatient and inpatient clinics are examples of final
medical cost centers
 General or specific surgeries
 General or specific medicine
 Maternity, neonatal care, pediatrics
78
Intermediate Medical Cost Centers
Intermediate medical cost centers: provide medical
support services
 Example: diagnostic services
May directly serve patients (radiology)
May indirectly serve patients (blood bank)
79
Intermediate Non-Medical Cost Centers
Intermediate non-medical cost centers (administrative
or logistical cost centers): provide overhead services to
the entire hospital or large areas of a hospital
Examples include: general administration, housekeeping,
and maintenance services
80
Examples of MASH Cost Centers
81
Intermediate non-
medical
Intermediate medical Final medical
General administration Pharmacy Outpatient clinic*
Kitchen Laboratory Emergency*
Maintenance Anesthesia Dental clinic*
Cleaning Radiology Maternity†
Security Operating room Surgery†
Statistics/Records Physical Therapy Pediatrics†
* denotes outpatient services
† denotes inpatient services
SOURCES OF DATA FOR MASH
82
Data for the calculation of hospital costs
Information on the various departments or services of the
hospital, whether administrative, logistic, or medical
Inventory of the main medical and non-medical
equipment used in the hospital by department
Space occupied by the various services/departments of
the hospital
Number of employees per position or function for each
service/department
83
Data for the calculation of hospital costs
Monthly payroll data
Detailed monthly financial reports for the study period
The quantities and prices of medicines and medical
consumables used
The activity data of the hospital's medical departments
Activity data of non-medical departments
Information about the energy system
84
Data for calculation of cost of identified
pathologies
The duration of hospitalization (if applicable)
The total contact time of the medical staff involved in
treatment of the patient (for each category)
Drugs and medical consumables used during treatment
Drugs and medical supplies prescribed/given at discharge
Laboratory tests, X-ray exams, and medical procedures
performed as part of the treatment
Surgical interventions performed as part of the treatment.
Equipment and materials used during treatment
85
TOTAL COSTS AND FULL COSTS
86
Total Costs
Total costs = total direct costs + total indirect costs
From another angle:
 total costs = total capital costs + total recurrent costs
 total costs = total fixed costs + total variable costs
Total costs reflect the entire cost of keeping a cost center
in operation
87
Full Costs
Full costs = total cost of revenue-earning cost center
+
allocated share of costs from associated intermediate
cost centers
Only relevant to revenue-earning (final medical) cost
centers
Step-down allocation process used to obtain full costs of
final cost centers
88
THE MASH FRAMEWORK
89
MASH Framework
90
Cost Components
Resources that are similar in nature are grouped together
and called cost components or cost categories
Some activities (like training) are identified as cost
components because there is no need to disaggregate
Classification should be comprehensive and non-
overlapping
91
Common Cost Components
Labor: cost of all staff employed in the hospital (clinical
and non-clinical staff)
Drugs and Medical Supplies: medical consumables
used in providing care to patients
Equipment and Infrastructure: cost of any medical
equipment, furniture, vehicles, building construction, or
administration-related equipment
92
Allocating and Calculating Costs
Costs are a function of the number of resources and their
unit value
Costs can be calculated in a number of ways:
 Accessing expenditure records with exact costs
or
 Combining data on quantities and their respective prices
or
 Using one average cost to estimate costs of other units
Calculations depend on data available and capacity to
collect additional data, if necessary
93
GENERAL PRINCIPLES OF COST
ALLOCATION AND CALCULATION
94
1: Costing should be comprehensive
 MASH uses accrual accounting, not cash accounting
 All costs must be accurately accounted
 Cost measured is the value of resources used in production of service (not
the cash paid)
 More reliable management and planning tool for:
 Ministry of Health and hospital managers
 Underfinanced health care systems and poor business environments
 Advantages:
 Directly reflects activity levels that generate output
 Includes value of donations where cost may have no associated cash
payment (voluntary contributions of time and services and equipment)
95
2: Costs should be attributed, as precisely as possible,
to specific cost centers
 Higher proportion of costs allocated to specific cost centers leads to
more accurate costing
 How you measure a resource influences whether it is considered
direct
 The proportion of direct costs can be increased by:
 Disaggregating data with amalgamated costs from different cost centers
 Improved cost reporting
 Improved tracking techniques
96
3: Allocation of indirect costs should reflect the true
incidence of those costs, as closely as possible
 May be impractical to measure amount of resources used in a cost
center
 Use indirect approach to distribute costs among cost centers
 Cost driver (allocation statistic/criterion): easily measured
variable that can approximate the level of activity taking place in
a specific cost center
 Example: Using percentage of floor space occupied by outpatient
clinic to calculate cost of cleaning agents allocated to outpatient
clinic
97
4: Costs incurred by one service should never be
attributed to another service
Hospitals may charge more for one service than its cost to
subsidize another service
Inexpensive, non-vital procedures are often “over-priced”
so that expensive, lifesaving ones are more accessible
Cross-subsidization must not be confused with assessing
costs
 Need to know the actual cost of each service
98
USES OF HOSPITAL COSTING
99
100
National level
Hospital Costing Estimates
(total costs, costs of main intermediate cost centers,
cost structure of final medical services, unit costs of
final medical services and targeted pathologies)
Hospital level
Budgeting
Planning
Management
Budgeting Uses
Enables preparation of informed budgets
 Hospitals can:
 Quantify donated resources to capture precise needs for future
 Understand how much the hospital’s current cost structure is
fully accounted for in budgeting process
 Governments can:
 Allocate resources appropriately
101
Planning Uses
Provides data for sound planning
 Hospitals can:
Develop revenue-generating opportunities
Identify key departments/services with unit cost structures
that allow subsidization of other services, for more
sustainable financing
 Governments can:
Plan premium contributions for national health insurance
schemes
102
Management Uses
Strengthens management systems
 Hospitals can:
Analyze the use of resources over time
Compare costs to those of other similar hospitals
Use other hospitals’ costs as benchmarks to assess
performance and to improve efficiency
 Government policy makers and planners can also:
Draw comparisons of costs between and among hospitals
103
EXERCISE: THE MASH TOOL
104
Task for Trios
Using the explanations of cost centers just discussed and
the information in the manual as a reference:
1) Classify the following cost centers in terms of their nature
2) Indicate whether each of the final cost centers provides
outpatient or inpatient care
3) Propose potential indicators for measuring the output of 5 cost
centers of your choice.
You will have 20 minutes
105
Task 2
On page 35 of your participant manual is a sample list of
costs extracted from a hospital annual financial report in
2016.
The list provides you with several pieces of information:
 the cost name
 its value
 some explanation of what the money was used for
106
Working in Pairs
Working in pairs,
 Classify as many costs as you can from the list below by nature
(i.e., into direct and indirect costs)
Please take 15 minutes and be prepared to discuss
107
Abt Associates
In collaboration with:
Avenir Health | Broad Branch Associates | Development Alternatives Inc. (DAI) | Johns Hopkins Bloomberg School of Public Health (JHSPH) |
Results for Development Institute (R4D) | RTI International | Training Resources Group, Inc. (TRG)
Hospital Costing
Day 2
Welcome back!
RECAP OF DAY 1
109
110
Agenda for the day
Costs
per department
per outpatient visit
per inpatient day
111
Abt Associates
In collaboration with:
Avenir Health | Broad Branch Associates | Development Alternatives Inc. (DAI) | Johns Hopkins Bloomberg School of Public Health (JHSPH) |
Results for Development Institute (R4D) | RTI International | Training Resources Group, Inc. (TRG)
Session 4
Costs per: department, outpatient visit
& inpatient day
Session Objectives
By the end of this session, participants will:
 Be proficient with the MASH tool
 Be able to calculate costs per cost center
 Be able to calculate the costs per department
 Understand the step-down method
 Be able to allocate indirect shared costs
Measuring Direct Cost Components for
each Cost Center
Consult expenditure records
 May be insufficiently disaggregated or may not be equivalent to
annual costs
Collect information on the quantity and cost per unit of
resources
 Quantities of resources are important because they can function
as cost drivers
 Cost per unit can be:
 Relatively straightforward to measure (pharmaceuticals)
Complex set of different elements (in the case of labor)
114
Part 1: Summarizing the resource data
Consider the green tabs in the Excel MASH template:
“Services” and “Resources”
For each tab (services and resources), fill in the
summarized data. The cells where data should be inputted
are highlighted in grey
115
Calculating Cost Components
Labor
Equipment and buildings
Pharmaceuticals (drug and medical supplies)
Other indirect costs: utilities and contracted services
116
Calculating Costs for Labor
1. Identify all staff employed in hospital -- clinical and non-
clinical staff
2. Classify hospital staff by qualifications or other
categories
3. Identify all elements that contribute to each staff’s
category cost
4. Identify number of staff (by category) for each cost center
and compute labor cost by multiplying
Price X Quantity
117
Allocating Shared Costs for Labor
Staff may work exclusively in activities associated with
one cost center or may divide their time among multiple
cost centers
For staff working across different cost centers, allocate
costs
 using the proportion of time staff spend in different cost centers’
activities according to the percentage of tasks performed at
each cost center
118
Allocating Shared Costs for Labor
(continued)
Accurate allocation of labor costs is key to costing
process, since labor represents largest single cost item in
budget
The allocation process uses:
 staffing schedules
 salaries by staff category
 personalized accounting of discretionary compensations
 numbers of staff
119
Calculating Costs for Equipment and
Buildings
Equipment and all buildings are treated as fixed assets or
capital costs when:
useful life is >1 year
purchase value is not trivial
Expenditures on these resources occur irregularly and
must be spread out over their lifetime to generate an
annual cost
120
Calculating Costs for Equipment and
Buildings (continued)
Consult stock inventory of equipment being used
Identify the buildings that comprise the hospital and the
occupied space
Determine replacement cost of each piece of equipment
or building
Determine the useful life of each piece of equipment or
building
Calculate annualized cost
 Straight-line method of depreciation:
(current value of a fixed asset) / (number of years of asset’s useful life)
121
Allocating Shared Costs of Buildings and
Equipment
Various measures can be used to allocate total costs
among various cost centers:
 How frequently, or for how long, different centers utilized the
machine
 Numbers of procedures performed (for diagnostic equipment)
 Number of trips or distance traveled (for shared vehicles)
 Floor space in square meters (for allocating building costs
among centers)
122
Pharmaceuticals (Drugs and medical
supplies)
Allocation to cost centers should be done as precisely as
possible
To allocate accurately:
 A drug inventory supported by a database recording:
Drug name and classification code
Presentation
Acquisition price per pack
Date it was dispensed
Number of dispensed packs
Cost center ordering it
Total cost per record
123
Pharmaceuticals (continued)
 Basic system:
 record unit price on each shelved box
 record stock info by specific cost center in ledger weekly
 More sophisticated system:
 computerized databases
 scannable orders from the cost centers
 bar-coded boxes
 Regardless of the system selected, use quantity and unit price to
value consumption of pharmaceuticals per cost center
 Costing should include only cost of those consumed in the costing
period (for example a year), and not what was procured
124
Part 2: Classifying Direct Costs and
Allocating Indirect Costs
Open the red tab labelled “Direct & Indirect”
Refer to the table in Task 2 of the Exercise in Session 3
Using the provided list of potential allocation, allocate any
costs that you had determined to be indirect costs to the
appropriate cost centers in your list
125
Allocating the Indirect Cost Components
of each Cost Center
 Indirect costs can include heat, electricity, water,
telecommunications services, building maintenance, and
miscellaneous contracted services
 For each identified indirect cost, a logical cost driver should be
identified
 Examples of cost drivers for shared costs
 space in square meters occupied by cost center
 number of faucets for cost of water use
 For “Other costs,” where it is difficult to define a precise cost driver,
level of direct costs can be used as a cost driver.
126
Table 1. Sample List of Costs and Allocation
Criteria
Costs Allocation Criteria (Cost Drivers)
Buildings Space in square meters
Equipment Procedures performed
Labor Staff number
Heat Space, cubic meters
Electricity Space, cubic meters
Water Direct costs
Building maintenance Space, cubic meters
Office supplies Direct costs
Telephone communications Number of phone sets
Miscellaneous contracted services Direct costs
Cleaning Space, square meters
Security Depreciation of fixed assets
Television Number of TV sets or patient days
Workplace security Direct costs
127
Calculating Total Cost of each Cost Center
Total costs are needed for step-down allocation process
Total cost = all direct costs + all indirect costs
Calculate the total cost for all cost centers
 Intermediate non-medical
 Intermediate medical
 Final medical
128
Part 3: Step-down Allocation
Open the red tab labelled “Step down.”
On page 57 of your participant manual is a table listing the
Administrative Services and Logistics and the
Intermediate Medical services cost centers.
Use the allocation base/criteria for each cost center to
allocate the total costs from that cost center across all the
cost centers at lower levels using the considered service.
129
Step-down Cost Allocation Process
Step-down cost allocation process: calculates final
costs for revenue earning cost centers
Maps costs of intermediate cost centers to those of final
cost centers, so it is clear what must be recovered from
final cost centers to cover expenses of entire hospital
130
Step-down Cost Allocation Process (1)
Assign cost centers to “levels”
131
Uppermost level of cost center (logistics and administrative)
allocates its costs to all other cost centers
Intermediate level of cost centers provides specialized
services directly to one or more final cost centers
Bottom level of cost centers are revenue- earning final cost
centers
Step-down Cost Allocation Process (2)
 Allocation of costs from one cost center to others is done using
allocation statistics/criteria (cost drivers)
 The chosen allocation statistic should reflect, approximately, the
extent to which the centers below them use the intermediate cost
center’s services.
 When multiple allocation statistics could be used, choose the one
that best meets the following criteria:
Accurately describes demand for the resource for
which it is acting as proxy
Readily available and accurately measurable
132
Table 2. Intermediate Cost Centers and
Allocation Criteria
Intermediate Cost Centers Allocation Criteria
Administrative and logistical services
Cleaning services Floor Space, weighted by frequency of cleaning;
unweighted floor space; general ledger
Food services (patients) Meals dispensed; patient days; inpatient discharges
Hospital administration Staff – headcount; Staff-FTE
Human resource management Staff – headcount; staff – FTE; wages and salaries
Intermediate medical services
Occupational therapy Number of sessions, weighted or not
Operating theater Time in use; number of surgeries, weighted or not
Pharmacy Value of dispensed drugs; volume of prescriptions
Radiology Number of exams, weighted or not
Laboratory Number of tests/requests, weighted or not
133
Table 3. Illustration of Step-down Cost
Allocation
CC1
Cost Centers (CCs)
Direct
Costs
Indirect
Costs
Total Costs
By direct cost CC2
1. Hospital
administration
500 300 800 800 By sq. meters CC3
2. Building
maintenance
300 200 500 50 550 By # of exams CC4
3. Radiology 600 300 900 100 50 1050 By # of
surgeries
4. Operating room 900 400 1300 150 100 0 1550 Final Costs
5. Outpatient internal
medicine
600 200 800 100 20 150 0 1070
6. Outpatient
pediatrics
600 300 900 100 30 100 0 1130
7. Inpatient medicine 1200 500 1700 200 150 300 0 2350
8. Inpatient surgery 600 200 800 100 200 500 1550 3150
Total 5300 2400 7700 7700
134
Allocation statistics
Abt Associates
In collaboration with:
Avenir Health | Broad Branch Associates | Development Alternatives Inc. (DAI) | Johns Hopkins Bloomberg School of Public Health (JHSPH) |
Results for Development Institute (R4D) | RTI International | Training Resources Group, Inc. (TRG)
Welcome back!
Hospital Costing
Day 3
135
Agenda for the day
Recap of day 2
Cost per specific disease
Workshop evaluation
136
Abt Associates
In collaboration with:
Avenir Health | Broad Branch Associates | Development Alternatives Inc. (DAI) | Johns Hopkins Bloomberg School of Public Health (JHSPH) |
Results for Development Institute (R4D) | RTI International | Training Resources Group, Inc. (TRG)
Session 5
Cost per Specific Disease
Session Objectives
By the end of this session, participants will:
Become familiar with the service costing tool (data
collection and analysis)
Be able to calculate cost of a specific disease
Understand the links between some results of the MASH
and the service costing exercise
138
Establishing Purpose
Key Questions:
 What are the reasons for undertaking this costing exercise?
 Which treatment processes need to be costed?
 Are there specific treatments that the hospital is providing mainly
through the use of donor funds and, thus, needs to track
spending more closely?
Answers to these questions are important for:
 Cross-subsidization
 Reimbursement from private sector
139
The Ingredient Approach
Ingredient approach method:
1) Detailed description of the disease treatment process, in
particular resource usage
2) Quantification of the resources to treat each disease
3) Valuation of those resources
4) Adding the value of the various resources to calculate the unit
cost of treatment of the disease
140
Summary of Data Required
Outpatient treatment or hospitalization
Average
 number of days of hospitalization (if applicable)
 contact time with medical staff by type
 volume of medical supplies used by type
 volume of drugs used and prescribed by type
Laboratory tests, medical imaging exams, surgical
interventions, and other procedures needed by type
Level of resources for each of those tests, exams,
interventions, and procedures (staff, supplies, drugs,
equipment depreciation, etc.) 141
Summary of Calculation Steps
Multiply volumes defined by the corresponding unit prices
to obtain the treatment cost
Result is:
 average cost per patient for treatment of a specific
pathology
142
DETAILED DESCRIPTION OF THE DISEASE
TREATMENT PROCESS
143
The Service Costing Tool
 Excel-based Service Costing tool
 Organized by cost component
 Purpose: to capture all costs for all steps of a treatment process for
one patient, from admission through discharge
 One Excel sheets for each step of the treatment process
 Example: For a given disease treatment if patient sees his/her doctor at an
outpatient clinic and is then referred to radiology, for a chest X-ray there will
be 2 different entry sheets in the workbook file
 Every “service” (or disease or pathology) treatment entails different
steps required to treat a patient
 Steps may include diagnostics
144
Service Costing Tool General Data
Tool requires
 Service Name (the pathology being costed)
 Service Sub-name (the specific classification of that service per
level of severity)
 Service Sub-name per Age (the classification by age for that
service)
Example:
 Service Name: Pneumonia
 Service Subname: Complicated Pneumonia
 Service Subname per Age: Complicated Pneumonia for under 5
145
Service Costing Tool General Data
The tool also requires:
 Department of the facility where this service is offered
 Number of services (number of visits) provided in a given year
 Whether this service requires follow-up visits and how many
Only concerned with the cost per patient to treat a
specific disease
146
QUANTIFICATION AND VALUATION OF THE SPECIFIC
RESOURCES REQUIRED PER DISEASE
147
Labor
Data collected from tool:
 Average contact time in minutes for each category of staff
involved in the treatment or the service
per first visit (first visit and follow up visit)
per day of admission (if applicable)
Challenges:
 Providers may overestimate or underestimate amount of time
 Need to insist on average time spent on a typical patient
Sources of Information for Labor Valuation:
 Human Resources Department of the hospital
 Central national-level Ministry of Health Directorate of Finance
148
Labor Valuation
Cost of Labor
=
(salary per minute) X (number of minutes spent with the patient)
Salary per Minute
=
(annual salary) / (number of minutes worked/paid in a year)
Number of Minutes Worked/Paid in a Year
=
60 minutes X 40 hours X 52 weeks = 124,800 minutes per year
149
Labor Example
Estimate the total labor costs associated with treating disease A.
 For treatment of disease A, there is one initial visit and no follow
ups.
 For that initial visit, the patient needs to spend 10 minutes with
two medical doctors, 8 minutes with a nurse and 15 minutes with
a midwife.
 The average salary per year for each of these categories of staff
is respectively $100,000, $60,000 and $65,000 for medical
doctors, nurses, and midwives.
150
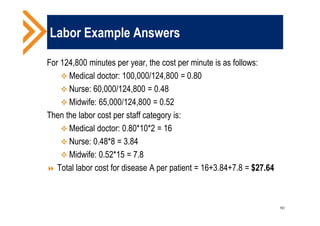
Labor Example Answers
For 124,800 minutes per year, the cost per minute is as follows:
 Medical doctor: 100,000/124,800 = 0.80
 Nurse: 60,000/124,800 = 0.48
 Midwife: 65,000/124,800 = 0.52
Then the labor cost per staff category is:
 Medical doctor: 0.80*10*2 = 16
 Nurse: 0.48*8 = 3.84
 Midwife: 0.52*15 = 7.8
 Total labor cost for disease A per patient = 16+3.84+7.8 = $27.64
151
Medical Supplies
 Data collected from tool:
 Use of medical supplies while providing service (outpatient
visits or inpatient days)
 Quantity and unit cost of medical supplies used while providing
service
 Sources of Information:
 Procurement/pharmacy records/central medical store
 Medical supplies analysis of the MASH
 Medical supplies must be:
 Disposable
 Used while providing given service during a visit
 Example: disposable syringe
152
Medical Supplies
Calculations:
 Cost per medical supply type = (medical supply quantity) X
(medical supply price)
 Calculate total medical supplies costs for one patient
treated for a given disease by summing costs of each medical
supply type involved
153
Medical Supplies Example
Estimate the total medical supplies costs associated
with treating disease A.
For treatment of disease A, for the initial visit (recall there
is no follow up visits for this disease) the following medical
supplies are used
 2 Syringes 5ml with needle (priced at $0.2 each)
 1 test kit (priced at $5 each)
 4 pairs of sterile gloves (priced at $0.1 per pair)
 2 pairs of non-sterile gloves (priced at $0.05 per pair)
154
Medical Supplies Example Answers
The cost of medical supplies is as follows:
 Syringes: 0.2*5 = 1
 Test kit: 1*5 = 5
 Sterile gloves: 4*0.1 = 0.4
 Non-sterile gloves: 2*0.05 = 0.1
Total medical supplies cost for disease A per patient =
1+5+0.4+0.1 = $6.5
155
Drugs
 Data collected from tool:
 Use of drugs/medications while providing service
 Dose/quantity/formulation
 Unit cost
 Drugs must be used in providing service during a visit
 Example: antibiotic dose given during a visit
 Sources of information are similar to those for medical supplies
156
Drugs
Calculations: Example for pills
Price per pill = (price of container) / (number of pills per
container)
Drugs cost = (price per pill) X (quantity of pills per dose)
Calculate total drug costs for one patient treated for
that disease by summing costs for each drug type
157
Drugs Example
Estimate the total drugs costs associated with treating
disease A.
For treatment of disease A, during the initial visit (recall there
are no follow up visits for this disease) the following drugs
are used for an adult average patient:
 Drug 1 is given through injection: the patient gets 1 dose of 1ml
 Drug 2 is a pill and the patient gets 500mg
 Price info: Drug1 comes in pack of 10 doses (1ml each) for $18
and Drug 2 comes in bottles of 1,000 pills (250 mg each), the
bottle cost $5.
158
Drugs Example Answer
The cost for drugs is as follows:
 Drug 1: $18/10 = $1.8
 Drug 2: if the patient needs 500mg, then he has to take 2 pills of
250 mg at a cost of ($5/1000)*2 = $0.01
Total cost for disease A per patient = $1.8+ $0.01= $1.81
159
Medical Equipment/Materials
 Data collected from tool:
 Use of medical equipment/materials while providing service
 Quantity (if multiple) of each type of equipment/material
 Unit cost of each type of equipment/material
 Equipment must:
 Be used while providing the service
 Specifically be for that type of service
 Not be disposable
160
Medical Equipment/Materials
Generally, only consider specialized equipment that is
costly and needs to be depreciated
 Example: oxygen machine as part of the treatment on serious
admitted patients
Determine if the equipment was purchased, leased, or
donated
 Account for depreciation
Source for information:
 Purchasing procurement records
 Supplier brochures/internet search
161
Medical Equipment/Materials
 Depending on nature of equipment, medical equipment cost is
calculated by:
 Dividing cost of equipment by total number of procedures the
equipment can be used for during its useful life
or
 Dividing annual depreciated value of the equipment with the
number of times the equipment were used during the year
 Hospitals in low resource settings:
 Cost of equipment is accounted for in the “structural cost” (or
“hotel cost”) of a day of hospitalization or of an outpatient visit
(discussed later)
 Structural cost found from the MASH
162
Other Supplies
Data collected from tool:
 Use of other supplies while providing service
 Quantity of each type of supply
 Unit cost of each type of supply
Only other supplies not listed in medical supplies category
should be listed
Calculate costs of other supplies using same method as
for medical supplies
163
Labs/Tests/Radiology Exams/Other
Procedures
 Data collected from tool:
 Use of test and exams for the service provided
 Quantity of each type of test or exam
 Tests/exams must be routinely performed when providing service
 Example: electrolytes test for severe gastroenteritis
 Tests/exams are typically intermediate steps but require resources:
 Example: blood test requires staff time (a lab technician),
medical supplies (vials, for example), reagents, equipment
(needed for testing), etc.
164
Labs/Tests/Radiology Exams/Other
Procedures
 Cost of one test/exam is made up of multiple cost components
(labor, drugs, equipment, etc.)
 These should be collected and entered in a separate entry sheet
 Calculations:
 Each cost component must be costed similarly to what is
described above
 Note: for equipment cost, the same approach of computing the
“hotel cost”
Cost components are then aggregated to find unit cost of one
test
165
Drugs and Medical Supplies Prescribed or
Distributed
Data collected from tool:
 Drugs or medical supplies prescribed or distributed to the patient
at the end of the visit/hospital stay as part of the given service
 Quantity/Dose per day
 Number of days on treatment
 Unit cost
Only those dispensed or prescribed (and subsidized) to
patient as part of the treatment
Calculating costs:
 Use same steps outlined for Drugs and Medical Supplies
166
“Hotel” costs or structural cost
“Hotel cost” is cost of infrastructure, infrastructure
maintenance, and management in each service provided
 Equipment cost usually included
 Obtained from MASH for each intermediate and final cost center
Example: patient is typically admitted in a room that needs
cleaning, patient will be served meals and have his/her
sheets washed, building maintenance is also necessary,
etc.
167
“Hotel” costs or structural cost
After step-down allocation of administrative and logistical
cost centers
 new cost for the intermediate and final cost centers
Total labor, drugs, and medical supplies costs for each
cost center should be taken out from the new allocated
costs
 Resulting value divided by:
number of visits (for outpatient departments)
number of days of admission (for inpatient care)
number of procedures (for intermediate cost centers)
168
CALCULATING THE UNIT COST OF TREATMENT OF
THE DISEASE
169
Total Cost per Patient per Service
Total cost per patient per service =
 Total labor cost +
 Total medical supplies cost +
 Total drug cost +
 Total lab tests cost +
 Total radiology exams cost +
 Total medical equipment/material cost +
 Total other supplies cost +
 Total drugs and medical supplies prescribed or distributed cost
170
Example
171
Pathology
Cost of
medical
staff (US$)
Cost of
supplies
and drugs
(US$)
Cost of
tests and
Exams
(US$)
Cost of surgical
procedures and
other procedures
(US$)
Hotel cost
(US$)
Total
treatment
cost (US$)
Severe pre-eclampsia 47.87 77.50 65.19 339.49 202.81 732.86
Cephalo-pelvic
disproportion
18.58 44.81 28.76 339.49 121.69 553.34
Materno-fetal infection 31.44 45.12 131.78 NA 237.92 446.26
Severe prematurity 117.95 162.06 106.32 NA 713.75 1,100.08
Cerebrovascular
accident (CVA)
55.11 191.55 99.56 NA 282.90 629.11
Cardiac
decompensation
56.01 39.04 126.54 NA 323.31 544.90
Femur fracture 42.19 204.60 113.75 430.45 1,193.07 1,984.06
Closed leg fracture 28.13 144.17 96.98 430.45 795.38 1,495.10
Open leg fracture 60.04 234.80 96.98 430.45 1,590.76 2,413.03
Intestinal occlusion 46.71 115.60 117.02 407.99 917.80 1,605.12
Generalized peritonitis 69.57 200.99 133.52 426.56 1,101.35 1,931.99
EXERCISE: COST PER DISEASE ESTIMATION
172
Exercise on Cost per Disease Estimation
Use the service costing analysis template to estimate cost
per input category and obtain a cost per disease
treatment.
You will have 45 minutes to complete the intestinal
occlusion cost
173
Abt Associates
In collaboration with:
Avenir Health | Broad Branch Associates | Development Alternatives Inc. (DAI) | Johns Hopkins Bloomberg School of Public Health (JHSPH) |
Results for Development Institute (R4D) | RTI International | Training Resources Group, Inc. (TRG)
Thank you
Photo Credit: Colby Gottert/Digital Development Communications
WORKSHOP EVALUATION
175

More Related Content

What's hot

Quality control of healthcare
Quality control of healthcareQuality control of healthcare
Quality control of healthcare
Ajay Agade
 
Utilization Management
Utilization ManagementUtilization Management
Utilization Management
Slehri
 
Hospital administration & Hospital Administrator
Hospital administration & Hospital AdministratorHospital administration & Hospital Administrator
Hospital administration & Hospital Administrator
Nc Das
 

What's hot (20)

Quality Management of Hospital Services
Quality Management of Hospital ServicesQuality Management of Hospital Services
Quality Management of Hospital Services
 
Healthcare operations management
Healthcare operations managementHealthcare operations management
Healthcare operations management
 
Financial management for hospital executives2
Financial management for hospital executives2Financial management for hospital executives2
Financial management for hospital executives2
 
Nabh 5th edition introduction by Iyanar. S
Nabh  5th edition introduction by Iyanar. SNabh  5th edition introduction by Iyanar. S
Nabh 5th edition introduction by Iyanar. S
 
Joint Commission International (JCI)
Joint Commission International (JCI)Joint Commission International (JCI)
Joint Commission International (JCI)
 
Healthcare Operation Management
Healthcare Operation ManagementHealthcare Operation Management
Healthcare Operation Management
 
Hospital accreditation
Hospital accreditationHospital accreditation
Hospital accreditation
 
Financial Management In Healthcare PowerPoint Presentation Slides
Financial Management In Healthcare PowerPoint Presentation SlidesFinancial Management In Healthcare PowerPoint Presentation Slides
Financial Management In Healthcare PowerPoint Presentation Slides
 
Quality Assurance in Hospitals
Quality Assurance in HospitalsQuality Assurance in Hospitals
Quality Assurance in Hospitals
 
5s-CQI-TQM For Hospital Quality Improvement
5s-CQI-TQM For Hospital Quality Improvement5s-CQI-TQM For Hospital Quality Improvement
5s-CQI-TQM For Hospital Quality Improvement
 
Hospital marketing
Hospital marketingHospital marketing
Hospital marketing
 
Quality control of healthcare
Quality control of healthcareQuality control of healthcare
Quality control of healthcare
 
Quality Management in Healthcare Services
Quality Management in Healthcare Services Quality Management in Healthcare Services
Quality Management in Healthcare Services
 
Clinical supportive service department
Clinical supportive service departmentClinical supportive service department
Clinical supportive service department
 
Utilization Management
Utilization ManagementUtilization Management
Utilization Management
 
Joint commission international (jci)
Joint commission international (jci)Joint commission international (jci)
Joint commission international (jci)
 
NABH Extended
NABH Extended NABH Extended
NABH Extended
 
Lean Implementation in Healthcare Organizations - The 5Ss Tool
Lean Implementation in Healthcare Organizations - The 5Ss ToolLean Implementation in Healthcare Organizations - The 5Ss Tool
Lean Implementation in Healthcare Organizations - The 5Ss Tool
 
Accreditation as a Strategy / Tool for Hospital Quality Service Improvement
Accreditation as a Strategy / Tool for Hospital Quality Service ImprovementAccreditation as a Strategy / Tool for Hospital Quality Service Improvement
Accreditation as a Strategy / Tool for Hospital Quality Service Improvement
 
Hospital administration & Hospital Administrator
Hospital administration & Hospital AdministratorHospital administration & Hospital Administrator
Hospital administration & Hospital Administrator
 

Similar to Hospital Costing Training Presentation

Resource Management
Resource ManagementResource Management
Resource Management
bodo-con
 

Similar to Hospital Costing Training Presentation (20)

Cost effectiveness and cost efficiency
Cost effectiveness and cost efficiencyCost effectiveness and cost efficiency
Cost effectiveness and cost efficiency
 
Cost analysis of Project
Cost analysis of ProjectCost analysis of Project
Cost analysis of Project
 
Cost effectiveness and cost containment
Cost effectiveness and cost containmentCost effectiveness and cost containment
Cost effectiveness and cost containment
 
Cost effectiveness and cost efficiency
Cost effectiveness and cost efficiencyCost effectiveness and cost efficiency
Cost effectiveness and cost efficiency
 
Operational Dashboards: Planning, Creating, Using for Transformation
Operational Dashboards:  Planning, Creating, Using for TransformationOperational Dashboards:  Planning, Creating, Using for Transformation
Operational Dashboards: Planning, Creating, Using for Transformation
 
Introduction to consumer behaviour
Introduction to consumer behaviourIntroduction to consumer behaviour
Introduction to consumer behaviour
 
Practical Guide to Benefits Driven Change
Practical Guide to Benefits Driven ChangePractical Guide to Benefits Driven Change
Practical Guide to Benefits Driven Change
 
Value based commissioning flow chartv2
Value based commissioning flow chartv2Value based commissioning flow chartv2
Value based commissioning flow chartv2
 
Triple Aim Design Thinking - Stanford MedX 2014
Triple Aim Design Thinking - Stanford MedX 2014Triple Aim Design Thinking - Stanford MedX 2014
Triple Aim Design Thinking - Stanford MedX 2014
 
Facilitating scaling: Initial ideas for Livestock CRP Integrated Core Project
Facilitating scaling: Initial ideas for Livestock CRP Integrated Core ProjectFacilitating scaling: Initial ideas for Livestock CRP Integrated Core Project
Facilitating scaling: Initial ideas for Livestock CRP Integrated Core Project
 
Cost concept and economic evaluation
Cost concept and economic evaluationCost concept and economic evaluation
Cost concept and economic evaluation
 
The Role of Economic Evaluation and Cost-Effectiveness in Program Science
The Role of Economic Evaluation and Cost-Effectiveness in Program ScienceThe Role of Economic Evaluation and Cost-Effectiveness in Program Science
The Role of Economic Evaluation and Cost-Effectiveness in Program Science
 
Edifecs CJR: don't fumble with your bundle ss
Edifecs CJR: don't fumble with your bundle ssEdifecs CJR: don't fumble with your bundle ss
Edifecs CJR: don't fumble with your bundle ss
 
Swati cost analysis rm
Swati cost analysis rmSwati cost analysis rm
Swati cost analysis rm
 
Cost Benefit analysis.pptx
Cost Benefit analysis.pptxCost Benefit analysis.pptx
Cost Benefit analysis.pptx
 
Week 1.pdf
Week 1.pdfWeek 1.pdf
Week 1.pdf
 
Leed Presentation
Leed PresentationLeed Presentation
Leed Presentation
 
Efficiency-short.pptx
Efficiency-short.pptxEfficiency-short.pptx
Efficiency-short.pptx
 
Resource Management
Resource ManagementResource Management
Resource Management
 
Healthcare transition in GCC: Current Painful Realities & Proposed Strategic ...
Healthcare transition in GCC: Current Painful Realities & Proposed Strategic ...Healthcare transition in GCC: Current Painful Realities & Proposed Strategic ...
Healthcare transition in GCC: Current Painful Realities & Proposed Strategic ...
 

More from HFG Project

More from HFG Project (20)

Analyse de la situation du financement de la santé en Haïti Version 4
Analyse de la situation du financement de la santé en Haïti Version 4Analyse de la situation du financement de la santé en Haïti Version 4
Analyse de la situation du financement de la santé en Haïti Version 4
 
Haïti Plan Stratégique de Développement des Ressources Humaines pour la Santé...
Haïti Plan Stratégique de Développement des Ressources Humaines pour la Santé...Haïti Plan Stratégique de Développement des Ressources Humaines pour la Santé...
Haïti Plan Stratégique de Développement des Ressources Humaines pour la Santé...
 
Toward Country-owned HIV Responses: What Strategies are Countries Implementin...
Toward Country-owned HIV Responses: What Strategies are Countries Implementin...Toward Country-owned HIV Responses: What Strategies are Countries Implementin...
Toward Country-owned HIV Responses: What Strategies are Countries Implementin...
 
Trinidad and Tobago 2015 Health Accounts - Main Report
Trinidad and Tobago 2015 Health Accounts - Main ReportTrinidad and Tobago 2015 Health Accounts - Main Report
Trinidad and Tobago 2015 Health Accounts - Main Report
 
Guyana 2016 Health Accounts - Dissemination Brief
Guyana 2016 Health Accounts - Dissemination BriefGuyana 2016 Health Accounts - Dissemination Brief
Guyana 2016 Health Accounts - Dissemination Brief
 
Guyana 2016 Health Accounts - Statistical Report
Guyana 2016 Health Accounts - Statistical ReportGuyana 2016 Health Accounts - Statistical Report
Guyana 2016 Health Accounts - Statistical Report
 
Guyana 2016 Health Accounts - Main Report
Guyana 2016 Health Accounts - Main ReportGuyana 2016 Health Accounts - Main Report
Guyana 2016 Health Accounts - Main Report
 
The Next Frontier to Support Health Resource Tracking
The Next Frontier to Support Health Resource TrackingThe Next Frontier to Support Health Resource Tracking
The Next Frontier to Support Health Resource Tracking
 
Technical Report: Hospital Drug Expenditures - Estimating Budget Needs at the...
Technical Report: Hospital Drug Expenditures - Estimating Budget Needs at the...Technical Report: Hospital Drug Expenditures - Estimating Budget Needs at the...
Technical Report: Hospital Drug Expenditures - Estimating Budget Needs at the...
 
Targeting the Poor for Universal Health Coverage Program Inclusion: Exploring...
Targeting the Poor for Universal Health Coverage Program Inclusion: Exploring...Targeting the Poor for Universal Health Coverage Program Inclusion: Exploring...
Targeting the Poor for Universal Health Coverage Program Inclusion: Exploring...
 
Exploring the Institutional Arrangements for Linking Health Financing to th...
  Exploring the Institutional Arrangements for Linking Health Financing to th...  Exploring the Institutional Arrangements for Linking Health Financing to th...
Exploring the Institutional Arrangements for Linking Health Financing to th...
 
River State Health Profile - Nigeria
River State Health Profile - NigeriaRiver State Health Profile - Nigeria
River State Health Profile - Nigeria
 
The health and economic benefits of investing in HIV prevention: a review of ...
The health and economic benefits of investing in HIV prevention: a review of ...The health and economic benefits of investing in HIV prevention: a review of ...
The health and economic benefits of investing in HIV prevention: a review of ...
 
ASSESSMENT OF RMNCH FUNCTIONALITY IN HEALTH FACILITIES IN BAUCHI STATE, NIGERIA
ASSESSMENT OF RMNCH FUNCTIONALITY IN HEALTH FACILITIES IN BAUCHI STATE, NIGERIAASSESSMENT OF RMNCH FUNCTIONALITY IN HEALTH FACILITIES IN BAUCHI STATE, NIGERIA
ASSESSMENT OF RMNCH FUNCTIONALITY IN HEALTH FACILITIES IN BAUCHI STATE, NIGERIA
 
BAUCHI STATE, NIGERIA PUBLIC EXPENDITURE REVIEW 2012-2016
BAUCHI STATE, NIGERIA PUBLIC EXPENDITURE REVIEW 2012-2016 BAUCHI STATE, NIGERIA PUBLIC EXPENDITURE REVIEW 2012-2016
BAUCHI STATE, NIGERIA PUBLIC EXPENDITURE REVIEW 2012-2016
 
HEALTH INSURANCE: PRICING REPORT FOR MINIMUM HEALTH BENEFITS PACKAGE, RIVERS ...
HEALTH INSURANCE: PRICING REPORT FOR MINIMUM HEALTH BENEFITS PACKAGE, RIVERS ...HEALTH INSURANCE: PRICING REPORT FOR MINIMUM HEALTH BENEFITS PACKAGE, RIVERS ...
HEALTH INSURANCE: PRICING REPORT FOR MINIMUM HEALTH BENEFITS PACKAGE, RIVERS ...
 
Actuarial Report for Healthcare Contributory Benefit Package, Kano State, Nig...
Actuarial Report for Healthcare Contributory Benefit Package, Kano State, Nig...Actuarial Report for Healthcare Contributory Benefit Package, Kano State, Nig...
Actuarial Report for Healthcare Contributory Benefit Package, Kano State, Nig...
 
Supplementary Actuarial Analysis of Tuberculosis, LAGOS STATE, NIGERIA HEALTH...
Supplementary Actuarial Analysis of Tuberculosis, LAGOS STATE, NIGERIA HEALTH...Supplementary Actuarial Analysis of Tuberculosis, LAGOS STATE, NIGERIA HEALTH...
Supplementary Actuarial Analysis of Tuberculosis, LAGOS STATE, NIGERIA HEALTH...
 
Supplementary Actuarial Analysis of HIV/AIDS in Lagos State, Nigeria
Supplementary Actuarial Analysis of HIV/AIDS in Lagos State, NigeriaSupplementary Actuarial Analysis of HIV/AIDS in Lagos State, Nigeria
Supplementary Actuarial Analysis of HIV/AIDS in Lagos State, Nigeria
 
Assessment Of RMNCH Functionality In Health Facilities in Osun State, Nigeria
Assessment Of RMNCH Functionality In Health Facilities in Osun State, NigeriaAssessment Of RMNCH Functionality In Health Facilities in Osun State, Nigeria
Assessment Of RMNCH Functionality In Health Facilities in Osun State, Nigeria
 

Recently uploaded

2024 asthma jkdjkfjsdklfjsdlkfjskldfgdsgerg
2024 asthma jkdjkfjsdklfjsdlkfjskldfgdsgerg2024 asthma jkdjkfjsdklfjsdlkfjskldfgdsgerg
2024 asthma jkdjkfjsdklfjsdlkfjskldfgdsgerg
MadhuKothuru
 
Russian Escorts in Abu Dhabi 0508644382 Abu Dhabi Escorts
Russian Escorts in Abu Dhabi 0508644382 Abu Dhabi EscortsRussian Escorts in Abu Dhabi 0508644382 Abu Dhabi Escorts
Russian Escorts in Abu Dhabi 0508644382 Abu Dhabi Escorts
Monica Sydney
 
Top profile Call Girls In Haldia [ 7014168258 ] Call Me For Genuine Models We...
Top profile Call Girls In Haldia [ 7014168258 ] Call Me For Genuine Models We...Top profile Call Girls In Haldia [ 7014168258 ] Call Me For Genuine Models We...
Top profile Call Girls In Haldia [ 7014168258 ] Call Me For Genuine Models We...
gajnagarg
 

Recently uploaded (20)

An Atoll Futures Research Institute? Presentation for CANCC
An Atoll Futures Research Institute? Presentation for CANCCAn Atoll Futures Research Institute? Presentation for CANCC
An Atoll Futures Research Institute? Presentation for CANCC
 
Lorain Road Business District Revitalization Plan Final Presentation
Lorain Road Business District Revitalization Plan Final PresentationLorain Road Business District Revitalization Plan Final Presentation
Lorain Road Business District Revitalization Plan Final Presentation
 
Financing strategies for adaptation. Presentation for CANCC
Financing strategies for adaptation. Presentation for CANCCFinancing strategies for adaptation. Presentation for CANCC
Financing strategies for adaptation. Presentation for CANCC
 
Election 2024 Presiding Duty Keypoints_01.pdf
Election 2024 Presiding Duty Keypoints_01.pdfElection 2024 Presiding Duty Keypoints_01.pdf
Election 2024 Presiding Duty Keypoints_01.pdf
 
Honasa Consumer Limited Impact Report 2024.pdf
Honasa Consumer Limited Impact Report 2024.pdfHonasa Consumer Limited Impact Report 2024.pdf
Honasa Consumer Limited Impact Report 2024.pdf
 
Kolkata Call Girls Halisahar 💯Call Us 🔝 8005736733 🔝 💃 Top Class Call Girl ...
Kolkata Call Girls Halisahar  💯Call Us 🔝 8005736733 🔝 💃  Top Class Call Girl ...Kolkata Call Girls Halisahar  💯Call Us 🔝 8005736733 🔝 💃  Top Class Call Girl ...
Kolkata Call Girls Halisahar 💯Call Us 🔝 8005736733 🔝 💃 Top Class Call Girl ...
 
Pakistani Call girls in Sharjah 0505086370 Sharjah Call girls
Pakistani Call girls in Sharjah 0505086370 Sharjah Call girlsPakistani Call girls in Sharjah 0505086370 Sharjah Call girls
Pakistani Call girls in Sharjah 0505086370 Sharjah Call girls
 
Vivek @ Cheap Call Girls In Kamla Nagar | Book 8448380779 Extreme Call Girls ...
Vivek @ Cheap Call Girls In Kamla Nagar | Book 8448380779 Extreme Call Girls ...Vivek @ Cheap Call Girls In Kamla Nagar | Book 8448380779 Extreme Call Girls ...
Vivek @ Cheap Call Girls In Kamla Nagar | Book 8448380779 Extreme Call Girls ...
 
2024 asthma jkdjkfjsdklfjsdlkfjskldfgdsgerg
2024 asthma jkdjkfjsdklfjsdlkfjskldfgdsgerg2024 asthma jkdjkfjsdklfjsdlkfjskldfgdsgerg
2024 asthma jkdjkfjsdklfjsdlkfjskldfgdsgerg
 
2024: The FAR, Federal Acquisition Regulations, Part 31
2024: The FAR, Federal Acquisition Regulations, Part 312024: The FAR, Federal Acquisition Regulations, Part 31
2024: The FAR, Federal Acquisition Regulations, Part 31
 
Vasai Call Girls In 07506202331, Nalasopara Call Girls In Mumbai
Vasai Call Girls In 07506202331, Nalasopara Call Girls In MumbaiVasai Call Girls In 07506202331, Nalasopara Call Girls In Mumbai
Vasai Call Girls In 07506202331, Nalasopara Call Girls In Mumbai
 
Call Girls AS Rao Nagar - 8250092165 Our call girls are sure to provide you w...
Call Girls AS Rao Nagar - 8250092165 Our call girls are sure to provide you w...Call Girls AS Rao Nagar - 8250092165 Our call girls are sure to provide you w...
Call Girls AS Rao Nagar - 8250092165 Our call girls are sure to provide you w...
 
NAP Expo - Delivering effective and adequate adaptation.pptx
NAP Expo - Delivering effective and adequate adaptation.pptxNAP Expo - Delivering effective and adequate adaptation.pptx
NAP Expo - Delivering effective and adequate adaptation.pptx
 
Russian Escorts in Abu Dhabi 0508644382 Abu Dhabi Escorts
Russian Escorts in Abu Dhabi 0508644382 Abu Dhabi EscortsRussian Escorts in Abu Dhabi 0508644382 Abu Dhabi Escorts
Russian Escorts in Abu Dhabi 0508644382 Abu Dhabi Escorts
 
Top profile Call Girls In Haldia [ 7014168258 ] Call Me For Genuine Models We...
Top profile Call Girls In Haldia [ 7014168258 ] Call Me For Genuine Models We...Top profile Call Girls In Haldia [ 7014168258 ] Call Me For Genuine Models We...
Top profile Call Girls In Haldia [ 7014168258 ] Call Me For Genuine Models We...
 
2024 UN Civil Society Conference in Support of the Summit of the Future.
2024 UN Civil Society Conference in Support of the Summit of the Future.2024 UN Civil Society Conference in Support of the Summit of the Future.
2024 UN Civil Society Conference in Support of the Summit of the Future.
 
Coastal Protection Measures in Hulhumale'
Coastal Protection Measures in Hulhumale'Coastal Protection Measures in Hulhumale'
Coastal Protection Measures in Hulhumale'
 
Finance strategies for adaptation. Presentation for CANCC
Finance strategies for adaptation. Presentation for CANCCFinance strategies for adaptation. Presentation for CANCC
Finance strategies for adaptation. Presentation for CANCC
 
Call Girls Mehsana / 8250092165 Genuine Call girls with real Photos and Number
Call Girls Mehsana / 8250092165 Genuine Call girls with real Photos and NumberCall Girls Mehsana / 8250092165 Genuine Call girls with real Photos and Number
Call Girls Mehsana / 8250092165 Genuine Call girls with real Photos and Number
 
9867746289 Independent Call Girls in Mumbai Airport 24/7 - Mumbai Escorts
9867746289 Independent Call Girls in Mumbai Airport 24/7 - Mumbai Escorts9867746289 Independent Call Girls in Mumbai Airport 24/7 - Mumbai Escorts
9867746289 Independent Call Girls in Mumbai Airport 24/7 - Mumbai Escorts
 

Hospital Costing Training Presentation

  • 1. Abt Associates In collaboration with: Avenir Health | Broad Branch Associates | Development Alternatives Inc. (DAI) | Johns Hopkins Bloomberg School of Public Health (JHSPH) | Results for Development Institute (R4D) | RTI International | Training Resources Group, Inc. (TRG) Hospital Costing Training: Facilitator manual presentation Prepared by: Sophie Faye, Yann Derriennic, Romana Haider, Christopher Cintron, and Margaret Morehouse
  • 2. Abt Associates In collaboration with: Avenir Health | Broad Branch Associates | Development Alternatives Inc. (DAI) | Johns Hopkins Bloomberg School of Public Health (JHSPH) | Results for Development Institute (R4D) | RTI International | Training Resources Group, Inc. (TRG) Session 1: Getting Started
  • 3. Session Objectives: At the end of the session, the participants will:  Know and understand the workshop objectives  Know and agree to workshop rules  Get to know each other better
  • 4. Getting Acquainted In a moment, a question will appear on the screen. When it appears, please find another person in the room and share your response to the question on the slide with each other. This will happen three times. Each time you see a new question, find a new person and share your responses. 4
  • 5. What is one word your friends and colleagues would use to describe you? 5
  • 6. If you could have dinner with anyone in the world, who would it be? 6
  • 7. What is your favorite book and why? 7
  • 8. Introductions Please stand and tell us:  Your name  Your position and organization  One specific thing you would like to learn about during this workshop 8
  • 9. Workshop Objectives By the conclusion of this workshop, participants will:  Understand the fundamental concepts involved with costing  Understand the MASH costing tool and be able to apply it for costing hospitals  Understand the use of costing results for effective hospital management 9
  • 10. Agenda Day 1 Day 2 Day 3 Morning  Welcome  Hospital Costing 101  Recap of Day 1  Costs per: ► Department ► Outpatient visit ► Inpatient day  Recap of Day 2  Costs per specific disease Lunch Afternoon  Overview of the MASH tool  Costs per ► Department ► Outpatient visit ► Inpatient day  Costs per specific disease 10
  • 11. Agreements Start and end on time Digital devices switched to vibrate Please leave the room if you have to answer a call Be curious; ask each other to expand contributions, and ask if you don’t understand Be a contributor; participate in large and small group discussions Avoid side conversations 11
  • 12. Housekeeping Participant manual Restrooms Breaks and meals Fill the course registration sheet Sign the course attendance sheet – every day 12
  • 13. 13
  • 14. Abt Associates In collaboration with: Avenir Health | Broad Branch Associates | Development Alternatives Inc. (DAI) | Johns Hopkins Bloomberg School of Public Health (JHSPH) | Results for Development Institute (R4D) | RTI International | Training Resources Group, Inc. (TRG) Session 2: Introduction to Costing
  • 15. Session Objectives By the end of this session, participants will:  Understand what costing is  Know the purpose of costing  Be able to name the types of costs and main costing approaches  Understand costing in a hospital context and know the steps of such costing exercises  Be introduced to the use of costing in the development of a business plan
  • 16. What is Costing? Costing is the process of identifying the costs of providing a defined unit of service or product. 16
  • 17. Important Concepts Cost: a measure of the resources that are used up in the production of a service or a product. Services or products are therefore the outcome of the investment in resources (the cost) Value: how much buyers think the service is worth—how much better off they think they are when they receive the service Price: what individuals are charged when they buy the service 17
  • 18. Purposes of Costing Determine the price charged for a service or product Conduct internal and external reporting and planning Track expenditures against planned spending Analyze types of costs that go into production Plan for efficiency gains and increased revenue Make key decisions to lower costs but maintain quality 18
  • 19. Costs come in many forms 19
  • 20. Cost Centers Cost Centers are the smallest units producing a service or a product and to which resources (costs) can be allocated. For example, the radiology department in a hospital. 20
  • 21. Fixed and Variable Costs Fixed costs: costs that regardless of the volume of hospital services, remain constant at least in the short and medium term Variable costs: costs that vary depending on the volume of production; they rise as production increases and fall as production decreases 21
  • 22. Direct and Indirect Costs Direct Costs: costs that can be easily traced to a specific cost object (service, product) or cost center Indirect Costs: costs that are shared across different cost centers, services, or products and which need to be allocated, as they can’t be directly traced 22
  • 23. Financial and Economic Costs Financial costs: actual costs in terms of the measure of resources used for the production of a service or product Economic costs: differ from financial costs because they account for items that enter the production process but may not have a price 23
  • 24. Recurrent and Capital Costs Recurrent costs: costs that are consumed during the course of a year, which might be needed every year. Capital costs: costs of resources that are longer lived (capital goods or fixed assets); these costs don’t need to be incurred every year. 24
  • 25. Depreciation Depreciation: estimates how much of an asset is used up each year If the organization annually sets aside the sum calculated through depreciation, by the end of the asset’s useful life, there should be enough funds to replace the worn-out asset. 25
  • 26. Total Costs Total Costs are the sum of the monetary values of all resources used in the production process of a given service or product (fixed and variable, recurrent or capital, financial or economic). 26
  • 27. Unit Costs Unit costs are costs per unit of service or product. Two measures are used for unit costs:  Average cost  Marginal cost 27
  • 28. Average and Marginal Costs Average cost: total cost of production divided by the number of units produced (both measured over a specified accounting period) Average costs tend to decrease as the amount of activity or output increases and the fixed costs are shared out among more and more units. Marginal cost: cost of producing one extra unit of service 28
  • 29. PRIMARY APPROACHES TO COSTING 29
  • 30. Top-down Method Identifies every major shared cost of the production process (overhead costs like utilities, rent, maintenance, etc.) Also, takes into consideration departments that support activities in logistical departments Requires history and knowledge of production processes to accurately define costs and the criteria for allocation of each type of cost 30
  • 31. Bottom-up Method Costs are tallied upward, starting at the bottom or unit level and accounting for each expected cost Total costs should equal the finished project cost  Pro: more accurate means of estimating total cost  Con: time-consuming, need more detailed data, and more expensive to realize 31
  • 32. Hospital Costing Provides the basic information needed by managers and policy makers to:  make decisions to improve performance  compare performance of different hospitals to one another Assigns monetary values to resources involved in hospital operations 32
  • 33. Importance of Hospital Costing Allows policy makers and hospital managers to:  Use scarce financial resources efficiently Especially at public hospitals with limited external funds  Reduce dependence on donor/government resources  Have a means for routine management control  Provide information to manage change  Examine costs in connection with productive efficiency  Plan for decreased wastage and increased revenue  Draw conclusions on quality  Implement a sustainable approach to providing care 33
  • 35. Exercise 1 On page ___ in your participant manual, you will find  A list of costs, extracted from a hospital annual financial report (all costs are for 1 year)  A matrix for classifying costs by type  Financial information on the total cost of the outpatient general department Classify the costs by placing each cost in the appropriate cell Please work in pairs. You have 20 minutes. 35
  • 37. PROCESS OF CONDUCTING A HOSPITAL COSTING EXERCISE 37
  • 38. Introduction Costing studies can be performed across different settings  hospitals or primary care centers  at different levels, from a whole hospital to a hospital unit Key steps that must take place pre-, during, and post- costing exercise 38
  • 40. Pre-Costing Steps Pre-Costing  Step 1: Identify the hospital  Step 2: Discuss with stakeholders  Step 3: Identify costing method and data sources  Step 4: Generate a protocol, timeline, and checklists  Step 5: Prepare the costing tools and templates  Step 6: Obtain ethical review board approval  Step 7: Identify and train data collectors  Step 8: Sensitize hospital staff 40
  • 41. Costing Steps Costing  Step 9: Collect and validate data  Step 10: Use the MASH tool for cost calculation  Step 11: Validate preliminary results with hospital management and providers  Step 12: Collect additional data and perform additional analysis if needed 41
  • 42. Post-Costing Steps Post-Costing  Step 13: Finalize the costing results, if additional data collection or analysis has been performed  Step 14: Draft the costing report  Step 15: Present the costing results 42
  • 43. Illustration of Hospital Costing: Saint Polycarp Hospital, Haiti Background  Faith-based facility  Mission to provide high-level pediatric services to poor or disadvantaged populations  Situated near Port au Prince  Mostly financed by international donors and user fees provide <7% of resources  Requires alternative revenue generation strategies because of reduction in donor funds 43
  • 44. Illustration of Hospital Costing: Saint Polycarp Hospital, Haiti Problem statement  Hospital is considering providing some services at full cost, with markup, to clients who can afford them  Location enables capture of middle-class patients  Cannot price these services without full costs  Reasons for costing study: 1) Set prices for services 2) Provide information to donors on what their support “buys” 3) Know cost of providing primary care (to consider if more cost efficient to externalize primary care to sister hospital) 44
  • 45. Illustration of Hospital Costing: Saint Polycarp Hospital, Haiti Unit of analysis  Cost per type of service/disease  SPH defined the services/diseases considered 45
  • 46. Illustration of Hospital Costing: Saint Polycarp Hospital, Haiti Method of costing/Cost calculations  Mixed approach method Top-down approach for overhead costs in producing of services Bottom-up approach for resources used in producing services Final cost per service/disease:  Follows principle of full absorption  Accounts for all direct and indirect costs of production 46
  • 47. Abt Associates In collaboration with: Avenir Health | Broad Branch Associates | Development Alternatives Inc. (DAI) | Johns Hopkins Bloomberg School of Public Health (JHSPH) | Results for Development Institute (R4D) | RTI International | Training Resources Group, Inc. (TRG) Thank you Photo Credit: Colby Gottert/Digital Development Communications
  • 49. Abt Associates In collaboration with: Avenir Health | Broad Branch Associates | Development Alternatives Inc. (DAI) | Johns Hopkins Bloomberg School of Public Health (JHSPH) | Results for Development Institute (R4D) | RTI International | Training Resources Group, Inc. (TRG) Session 3 Overview of the MASH Tool
  • 50. Session Objectives By the end of this session, participants will:  Be introduced to the MASH tool  Know various audiences/users of the MASH tool  Deepen their understanding of different types of costs  Be introduced to hospital services and outputs and how to measure them (indicators)  Be introduced to the concept of cost centers  Know some of the use of costing results
  • 52. What is MASH? MASH – Management Accounting System for Hospitals  Developed from hospital costing studies in several countries Excel-based framework of several interrelated spreadsheets  Tracking and analyzing services, resources, costs  Useful for routine management or initiating changes  Makes resource and service management easy to understand 52
  • 53. MASH Audiences & Uses Hospital managers – setting prices, negotiating contracts, managing capacity, modeling changes Hospital department heads – monitoring budgets, comparing care and management strategies Care purchasers – comparing hospitals to make funding and contract decisions 53
  • 54. MASH Audiences & Uses, continued Regulators and Auditors – evaluating hospital performance, making internal (between departments) and external (between hospitals) comparisons Health Financing and Operations Analysts – recommending policies on resource allocation and care purchasing 54
  • 55. Visualization of MASH Inputs and Outputs 55 Note: For the purpose of this training, we are only interested in the first output of MASH: “Unit Costs.” We won’t be exploring the process of getting the other two outputs.
  • 56. Preparing to Use MASH Identify and collect data in the form of:  Costs  Services  Outputs  Cost Centers 56
  • 57. Data Collection for MASH Two main methods for collecting qualitative and quantitative information: document review  the process of extracting relevant information from available documents into spreadsheets field data collection  observations of the day-to-day functioning of the hospital  guided visits conducted in selected departments to understand their structure and health services production process. 57
  • 58. Document Review: Relevant Information  Organization of health care provision in the country and in the hospital  Health financing arrangements  Studies of health care cost already done for the hospital  History of the hospital  Legal status of the hospital  Demand for care from the population  Hospital activity and financial documents and reports  Inventory of medical and non-medical equipment  List of the main services provided by the hospital 58
  • 59. Preparing for Field Survey Working sessions should be held with different hospital staff, before the active field survey phase. These individuals include:  Hospital executives  Resource persons on the management committee of the hospital  The heads of teams or medical and non-medical departments of the hospital  Health workers directly involved in the treatment of pathologies that were identified for the costing 59
  • 60. Field Data Collection Should begin as soon as the document review is completed or very advanced. Information will be collected using standardized forms to capture inputs in the chain of health care production 60
  • 61. Field Data Collection Health information from monthly reports If reports are not available, they must be reconstructed in collaboration with hospital staff Information on the quantity of drugs consumed, collected from the procurement office, the central pharmacy, or from department records Here, too, if the data are not immediately available, they will have to be reconstituted manually. 61
  • 62. Field Data Collection If the data need to be reconstructed, an observation period may be needed to estimate the exact level of resources that go into producing these services. Observation period is selected based on the intensity of services provided during each period of the year The field data collection takes place over a period of 4 weeks (or more or less) 62
  • 64. Costs Start by identifying and quantifying hospital resources:  Labor  Supplies  Equipment  Buildings  Land Assign monetary values to those resources so they can be compared, analyzed in a common unit, money 64
  • 65. Costs, continued: types of costs Same types of costs covered in Session 2: Costing 101  Fixed and Variable  Direct and Indirect  Financial and Economic  Recurrent and Capital Important to distinguish, as hospital costing usually covers one-year period Depreciation cost is what will be accounted for in capital costs  Unit Costs – mainly average cost  Total and Full costs 65
  • 66. HOSPITAL SERVICES AND OUTPUTS 66
  • 67. Hospital Services MASH aims to cost the services offered by a hospital in relation to the output of those services  e.g., cost of all newborn deliveries divided by number of deliveries Three main hospital functions  Patient Care  Teaching  Research MASH focuses on patient care, the main goal of hospitals 67
  • 69. Hospital Services, continued: Patient Care All activities involving provision of care to patients, at the hospital or in the community by hospital staff Outpatient care – treatment without hospitalization Day patient care – requiring a hospital bed for recovery or invasive treatment, but for less than a day Inpatient care – spending more than one day in hospital 69
  • 70. Hospital Services, continued: Support Services Patient care is supported by intermediate medical and non-medical services, such as:  Pharmacy  Diagnostics  Laundry  Kitchen  Administration  Transport 70
  • 71. Service Output Measures Service outputs must be quantified for use MASH is most concerned with final patient care measures  3 inpatient measures  3 outpatient measures 71
  • 72. Service Output Measures: Inpatient Services Number of inpatients – admitted for at least one night and counted during daily census Number of patient days – completed days spent in hospital, also called length of stay Number of episodes of patient care – a period of treatment corresponding with clinical intentions and treatment goals  e.g., inpatient case changes from acute to non-acute = 2 episodes 72
  • 73. Service Output Measures: Outpatient Services Number of outpatient visits – contact between patients and staff either in office or outreach setting Finished episodes of outpatient care – completion of clinical goals or guidelines for care  e.g., patient recovery, counsel given, appropriate test performed Number of procedures – indicator of a specific activity  e.g., specific lab tests, surgeries, treatments 73
  • 75. Cost Centers MASH is structured around cost centers, also called departments Cost Centers are the smallest hospital units that create a product or range of services to which hospitals allocate cost Defining cost centers should be a collaborative process between the costing experts, hospital staff, and administrators 75
  • 76. Cost Center Guidelines Cost centers should:  Group activities together that have common management, inputs, space, and staff  Be associated with a single product or service, e.g., surgery, outpatient visit, lab test Where more detail is needed, cost centers can be more specific, e.g., types of surgery, lab test, disease-specific visits  Reflect the way information is already managed/collected, and follow national guidelines so comparisons can be made 76
  • 77. Cost Centers, continued: Types of Cost Centers There are 3 main types of cost centers:  Final cost centers  Intermediate medical cost centers  Intermediate non-medical cost centers 77
  • 78. Final Cost Centers Final Cost Centers, (revenue earning cost centers), are:  Directly involved in the production of billable hospital services  Medical in nature Outpatient and inpatient clinics are examples of final medical cost centers  General or specific surgeries  General or specific medicine  Maternity, neonatal care, pediatrics 78
  • 79. Intermediate Medical Cost Centers Intermediate medical cost centers: provide medical support services  Example: diagnostic services May directly serve patients (radiology) May indirectly serve patients (blood bank) 79
  • 80. Intermediate Non-Medical Cost Centers Intermediate non-medical cost centers (administrative or logistical cost centers): provide overhead services to the entire hospital or large areas of a hospital Examples include: general administration, housekeeping, and maintenance services 80
  • 81. Examples of MASH Cost Centers 81 Intermediate non- medical Intermediate medical Final medical General administration Pharmacy Outpatient clinic* Kitchen Laboratory Emergency* Maintenance Anesthesia Dental clinic* Cleaning Radiology Maternity† Security Operating room Surgery† Statistics/Records Physical Therapy Pediatrics† * denotes outpatient services † denotes inpatient services
  • 82. SOURCES OF DATA FOR MASH 82
  • 83. Data for the calculation of hospital costs Information on the various departments or services of the hospital, whether administrative, logistic, or medical Inventory of the main medical and non-medical equipment used in the hospital by department Space occupied by the various services/departments of the hospital Number of employees per position or function for each service/department 83
  • 84. Data for the calculation of hospital costs Monthly payroll data Detailed monthly financial reports for the study period The quantities and prices of medicines and medical consumables used The activity data of the hospital's medical departments Activity data of non-medical departments Information about the energy system 84
  • 85. Data for calculation of cost of identified pathologies The duration of hospitalization (if applicable) The total contact time of the medical staff involved in treatment of the patient (for each category) Drugs and medical consumables used during treatment Drugs and medical supplies prescribed/given at discharge Laboratory tests, X-ray exams, and medical procedures performed as part of the treatment Surgical interventions performed as part of the treatment. Equipment and materials used during treatment 85
  • 86. TOTAL COSTS AND FULL COSTS 86
  • 87. Total Costs Total costs = total direct costs + total indirect costs From another angle:  total costs = total capital costs + total recurrent costs  total costs = total fixed costs + total variable costs Total costs reflect the entire cost of keeping a cost center in operation 87
  • 88. Full Costs Full costs = total cost of revenue-earning cost center + allocated share of costs from associated intermediate cost centers Only relevant to revenue-earning (final medical) cost centers Step-down allocation process used to obtain full costs of final cost centers 88
  • 91. Cost Components Resources that are similar in nature are grouped together and called cost components or cost categories Some activities (like training) are identified as cost components because there is no need to disaggregate Classification should be comprehensive and non- overlapping 91
  • 92. Common Cost Components Labor: cost of all staff employed in the hospital (clinical and non-clinical staff) Drugs and Medical Supplies: medical consumables used in providing care to patients Equipment and Infrastructure: cost of any medical equipment, furniture, vehicles, building construction, or administration-related equipment 92
  • 93. Allocating and Calculating Costs Costs are a function of the number of resources and their unit value Costs can be calculated in a number of ways:  Accessing expenditure records with exact costs or  Combining data on quantities and their respective prices or  Using one average cost to estimate costs of other units Calculations depend on data available and capacity to collect additional data, if necessary 93
  • 94. GENERAL PRINCIPLES OF COST ALLOCATION AND CALCULATION 94
  • 95. 1: Costing should be comprehensive  MASH uses accrual accounting, not cash accounting  All costs must be accurately accounted  Cost measured is the value of resources used in production of service (not the cash paid)  More reliable management and planning tool for:  Ministry of Health and hospital managers  Underfinanced health care systems and poor business environments  Advantages:  Directly reflects activity levels that generate output  Includes value of donations where cost may have no associated cash payment (voluntary contributions of time and services and equipment) 95
  • 96. 2: Costs should be attributed, as precisely as possible, to specific cost centers  Higher proportion of costs allocated to specific cost centers leads to more accurate costing  How you measure a resource influences whether it is considered direct  The proportion of direct costs can be increased by:  Disaggregating data with amalgamated costs from different cost centers  Improved cost reporting  Improved tracking techniques 96
  • 97. 3: Allocation of indirect costs should reflect the true incidence of those costs, as closely as possible  May be impractical to measure amount of resources used in a cost center  Use indirect approach to distribute costs among cost centers  Cost driver (allocation statistic/criterion): easily measured variable that can approximate the level of activity taking place in a specific cost center  Example: Using percentage of floor space occupied by outpatient clinic to calculate cost of cleaning agents allocated to outpatient clinic 97
  • 98. 4: Costs incurred by one service should never be attributed to another service Hospitals may charge more for one service than its cost to subsidize another service Inexpensive, non-vital procedures are often “over-priced” so that expensive, lifesaving ones are more accessible Cross-subsidization must not be confused with assessing costs  Need to know the actual cost of each service 98
  • 99. USES OF HOSPITAL COSTING 99
  • 100. 100 National level Hospital Costing Estimates (total costs, costs of main intermediate cost centers, cost structure of final medical services, unit costs of final medical services and targeted pathologies) Hospital level Budgeting Planning Management
  • 101. Budgeting Uses Enables preparation of informed budgets  Hospitals can:  Quantify donated resources to capture precise needs for future  Understand how much the hospital’s current cost structure is fully accounted for in budgeting process  Governments can:  Allocate resources appropriately 101
  • 102. Planning Uses Provides data for sound planning  Hospitals can: Develop revenue-generating opportunities Identify key departments/services with unit cost structures that allow subsidization of other services, for more sustainable financing  Governments can: Plan premium contributions for national health insurance schemes 102
  • 103. Management Uses Strengthens management systems  Hospitals can: Analyze the use of resources over time Compare costs to those of other similar hospitals Use other hospitals’ costs as benchmarks to assess performance and to improve efficiency  Government policy makers and planners can also: Draw comparisons of costs between and among hospitals 103
  • 104. EXERCISE: THE MASH TOOL 104
  • 105. Task for Trios Using the explanations of cost centers just discussed and the information in the manual as a reference: 1) Classify the following cost centers in terms of their nature 2) Indicate whether each of the final cost centers provides outpatient or inpatient care 3) Propose potential indicators for measuring the output of 5 cost centers of your choice. You will have 20 minutes 105
  • 106. Task 2 On page 35 of your participant manual is a sample list of costs extracted from a hospital annual financial report in 2016. The list provides you with several pieces of information:  the cost name  its value  some explanation of what the money was used for 106
  • 107. Working in Pairs Working in pairs,  Classify as many costs as you can from the list below by nature (i.e., into direct and indirect costs) Please take 15 minutes and be prepared to discuss 107
  • 108. Abt Associates In collaboration with: Avenir Health | Broad Branch Associates | Development Alternatives Inc. (DAI) | Johns Hopkins Bloomberg School of Public Health (JHSPH) | Results for Development Institute (R4D) | RTI International | Training Resources Group, Inc. (TRG) Hospital Costing Day 2 Welcome back!
  • 109. RECAP OF DAY 1 109
  • 110. 110
  • 111. Agenda for the day Costs per department per outpatient visit per inpatient day 111
  • 112. Abt Associates In collaboration with: Avenir Health | Broad Branch Associates | Development Alternatives Inc. (DAI) | Johns Hopkins Bloomberg School of Public Health (JHSPH) | Results for Development Institute (R4D) | RTI International | Training Resources Group, Inc. (TRG) Session 4 Costs per: department, outpatient visit & inpatient day
  • 113. Session Objectives By the end of this session, participants will:  Be proficient with the MASH tool  Be able to calculate costs per cost center  Be able to calculate the costs per department  Understand the step-down method  Be able to allocate indirect shared costs
  • 114. Measuring Direct Cost Components for each Cost Center Consult expenditure records  May be insufficiently disaggregated or may not be equivalent to annual costs Collect information on the quantity and cost per unit of resources  Quantities of resources are important because they can function as cost drivers  Cost per unit can be:  Relatively straightforward to measure (pharmaceuticals) Complex set of different elements (in the case of labor) 114
  • 115. Part 1: Summarizing the resource data Consider the green tabs in the Excel MASH template: “Services” and “Resources” For each tab (services and resources), fill in the summarized data. The cells where data should be inputted are highlighted in grey 115
  • 116. Calculating Cost Components Labor Equipment and buildings Pharmaceuticals (drug and medical supplies) Other indirect costs: utilities and contracted services 116
  • 117. Calculating Costs for Labor 1. Identify all staff employed in hospital -- clinical and non- clinical staff 2. Classify hospital staff by qualifications or other categories 3. Identify all elements that contribute to each staff’s category cost 4. Identify number of staff (by category) for each cost center and compute labor cost by multiplying Price X Quantity 117
  • 118. Allocating Shared Costs for Labor Staff may work exclusively in activities associated with one cost center or may divide their time among multiple cost centers For staff working across different cost centers, allocate costs  using the proportion of time staff spend in different cost centers’ activities according to the percentage of tasks performed at each cost center 118
  • 119. Allocating Shared Costs for Labor (continued) Accurate allocation of labor costs is key to costing process, since labor represents largest single cost item in budget The allocation process uses:  staffing schedules  salaries by staff category  personalized accounting of discretionary compensations  numbers of staff 119
  • 120. Calculating Costs for Equipment and Buildings Equipment and all buildings are treated as fixed assets or capital costs when: useful life is >1 year purchase value is not trivial Expenditures on these resources occur irregularly and must be spread out over their lifetime to generate an annual cost 120
  • 121. Calculating Costs for Equipment and Buildings (continued) Consult stock inventory of equipment being used Identify the buildings that comprise the hospital and the occupied space Determine replacement cost of each piece of equipment or building Determine the useful life of each piece of equipment or building Calculate annualized cost  Straight-line method of depreciation: (current value of a fixed asset) / (number of years of asset’s useful life) 121
  • 122. Allocating Shared Costs of Buildings and Equipment Various measures can be used to allocate total costs among various cost centers:  How frequently, or for how long, different centers utilized the machine  Numbers of procedures performed (for diagnostic equipment)  Number of trips or distance traveled (for shared vehicles)  Floor space in square meters (for allocating building costs among centers) 122
  • 123. Pharmaceuticals (Drugs and medical supplies) Allocation to cost centers should be done as precisely as possible To allocate accurately:  A drug inventory supported by a database recording: Drug name and classification code Presentation Acquisition price per pack Date it was dispensed Number of dispensed packs Cost center ordering it Total cost per record 123
  • 124. Pharmaceuticals (continued)  Basic system:  record unit price on each shelved box  record stock info by specific cost center in ledger weekly  More sophisticated system:  computerized databases  scannable orders from the cost centers  bar-coded boxes  Regardless of the system selected, use quantity and unit price to value consumption of pharmaceuticals per cost center  Costing should include only cost of those consumed in the costing period (for example a year), and not what was procured 124
  • 125. Part 2: Classifying Direct Costs and Allocating Indirect Costs Open the red tab labelled “Direct & Indirect” Refer to the table in Task 2 of the Exercise in Session 3 Using the provided list of potential allocation, allocate any costs that you had determined to be indirect costs to the appropriate cost centers in your list 125
  • 126. Allocating the Indirect Cost Components of each Cost Center  Indirect costs can include heat, electricity, water, telecommunications services, building maintenance, and miscellaneous contracted services  For each identified indirect cost, a logical cost driver should be identified  Examples of cost drivers for shared costs  space in square meters occupied by cost center  number of faucets for cost of water use  For “Other costs,” where it is difficult to define a precise cost driver, level of direct costs can be used as a cost driver. 126
  • 127. Table 1. Sample List of Costs and Allocation Criteria Costs Allocation Criteria (Cost Drivers) Buildings Space in square meters Equipment Procedures performed Labor Staff number Heat Space, cubic meters Electricity Space, cubic meters Water Direct costs Building maintenance Space, cubic meters Office supplies Direct costs Telephone communications Number of phone sets Miscellaneous contracted services Direct costs Cleaning Space, square meters Security Depreciation of fixed assets Television Number of TV sets or patient days Workplace security Direct costs 127
  • 128. Calculating Total Cost of each Cost Center Total costs are needed for step-down allocation process Total cost = all direct costs + all indirect costs Calculate the total cost for all cost centers  Intermediate non-medical  Intermediate medical  Final medical 128
  • 129. Part 3: Step-down Allocation Open the red tab labelled “Step down.” On page 57 of your participant manual is a table listing the Administrative Services and Logistics and the Intermediate Medical services cost centers. Use the allocation base/criteria for each cost center to allocate the total costs from that cost center across all the cost centers at lower levels using the considered service. 129
  • 130. Step-down Cost Allocation Process Step-down cost allocation process: calculates final costs for revenue earning cost centers Maps costs of intermediate cost centers to those of final cost centers, so it is clear what must be recovered from final cost centers to cover expenses of entire hospital 130
  • 131. Step-down Cost Allocation Process (1) Assign cost centers to “levels” 131 Uppermost level of cost center (logistics and administrative) allocates its costs to all other cost centers Intermediate level of cost centers provides specialized services directly to one or more final cost centers Bottom level of cost centers are revenue- earning final cost centers
  • 132. Step-down Cost Allocation Process (2)  Allocation of costs from one cost center to others is done using allocation statistics/criteria (cost drivers)  The chosen allocation statistic should reflect, approximately, the extent to which the centers below them use the intermediate cost center’s services.  When multiple allocation statistics could be used, choose the one that best meets the following criteria: Accurately describes demand for the resource for which it is acting as proxy Readily available and accurately measurable 132
  • 133. Table 2. Intermediate Cost Centers and Allocation Criteria Intermediate Cost Centers Allocation Criteria Administrative and logistical services Cleaning services Floor Space, weighted by frequency of cleaning; unweighted floor space; general ledger Food services (patients) Meals dispensed; patient days; inpatient discharges Hospital administration Staff – headcount; Staff-FTE Human resource management Staff – headcount; staff – FTE; wages and salaries Intermediate medical services Occupational therapy Number of sessions, weighted or not Operating theater Time in use; number of surgeries, weighted or not Pharmacy Value of dispensed drugs; volume of prescriptions Radiology Number of exams, weighted or not Laboratory Number of tests/requests, weighted or not 133
  • 134. Table 3. Illustration of Step-down Cost Allocation CC1 Cost Centers (CCs) Direct Costs Indirect Costs Total Costs By direct cost CC2 1. Hospital administration 500 300 800 800 By sq. meters CC3 2. Building maintenance 300 200 500 50 550 By # of exams CC4 3. Radiology 600 300 900 100 50 1050 By # of surgeries 4. Operating room 900 400 1300 150 100 0 1550 Final Costs 5. Outpatient internal medicine 600 200 800 100 20 150 0 1070 6. Outpatient pediatrics 600 300 900 100 30 100 0 1130 7. Inpatient medicine 1200 500 1700 200 150 300 0 2350 8. Inpatient surgery 600 200 800 100 200 500 1550 3150 Total 5300 2400 7700 7700 134 Allocation statistics
  • 135. Abt Associates In collaboration with: Avenir Health | Broad Branch Associates | Development Alternatives Inc. (DAI) | Johns Hopkins Bloomberg School of Public Health (JHSPH) | Results for Development Institute (R4D) | RTI International | Training Resources Group, Inc. (TRG) Welcome back! Hospital Costing Day 3 135
  • 136. Agenda for the day Recap of day 2 Cost per specific disease Workshop evaluation 136
  • 137. Abt Associates In collaboration with: Avenir Health | Broad Branch Associates | Development Alternatives Inc. (DAI) | Johns Hopkins Bloomberg School of Public Health (JHSPH) | Results for Development Institute (R4D) | RTI International | Training Resources Group, Inc. (TRG) Session 5 Cost per Specific Disease
  • 138. Session Objectives By the end of this session, participants will: Become familiar with the service costing tool (data collection and analysis) Be able to calculate cost of a specific disease Understand the links between some results of the MASH and the service costing exercise 138
  • 139. Establishing Purpose Key Questions:  What are the reasons for undertaking this costing exercise?  Which treatment processes need to be costed?  Are there specific treatments that the hospital is providing mainly through the use of donor funds and, thus, needs to track spending more closely? Answers to these questions are important for:  Cross-subsidization  Reimbursement from private sector 139
  • 140. The Ingredient Approach Ingredient approach method: 1) Detailed description of the disease treatment process, in particular resource usage 2) Quantification of the resources to treat each disease 3) Valuation of those resources 4) Adding the value of the various resources to calculate the unit cost of treatment of the disease 140
  • 141. Summary of Data Required Outpatient treatment or hospitalization Average  number of days of hospitalization (if applicable)  contact time with medical staff by type  volume of medical supplies used by type  volume of drugs used and prescribed by type Laboratory tests, medical imaging exams, surgical interventions, and other procedures needed by type Level of resources for each of those tests, exams, interventions, and procedures (staff, supplies, drugs, equipment depreciation, etc.) 141
  • 142. Summary of Calculation Steps Multiply volumes defined by the corresponding unit prices to obtain the treatment cost Result is:  average cost per patient for treatment of a specific pathology 142
  • 143. DETAILED DESCRIPTION OF THE DISEASE TREATMENT PROCESS 143
  • 144. The Service Costing Tool  Excel-based Service Costing tool  Organized by cost component  Purpose: to capture all costs for all steps of a treatment process for one patient, from admission through discharge  One Excel sheets for each step of the treatment process  Example: For a given disease treatment if patient sees his/her doctor at an outpatient clinic and is then referred to radiology, for a chest X-ray there will be 2 different entry sheets in the workbook file  Every “service” (or disease or pathology) treatment entails different steps required to treat a patient  Steps may include diagnostics 144
  • 145. Service Costing Tool General Data Tool requires  Service Name (the pathology being costed)  Service Sub-name (the specific classification of that service per level of severity)  Service Sub-name per Age (the classification by age for that service) Example:  Service Name: Pneumonia  Service Subname: Complicated Pneumonia  Service Subname per Age: Complicated Pneumonia for under 5 145
  • 146. Service Costing Tool General Data The tool also requires:  Department of the facility where this service is offered  Number of services (number of visits) provided in a given year  Whether this service requires follow-up visits and how many Only concerned with the cost per patient to treat a specific disease 146
  • 147. QUANTIFICATION AND VALUATION OF THE SPECIFIC RESOURCES REQUIRED PER DISEASE 147
  • 148. Labor Data collected from tool:  Average contact time in minutes for each category of staff involved in the treatment or the service per first visit (first visit and follow up visit) per day of admission (if applicable) Challenges:  Providers may overestimate or underestimate amount of time  Need to insist on average time spent on a typical patient Sources of Information for Labor Valuation:  Human Resources Department of the hospital  Central national-level Ministry of Health Directorate of Finance 148
  • 149. Labor Valuation Cost of Labor = (salary per minute) X (number of minutes spent with the patient) Salary per Minute = (annual salary) / (number of minutes worked/paid in a year) Number of Minutes Worked/Paid in a Year = 60 minutes X 40 hours X 52 weeks = 124,800 minutes per year 149
  • 150. Labor Example Estimate the total labor costs associated with treating disease A.  For treatment of disease A, there is one initial visit and no follow ups.  For that initial visit, the patient needs to spend 10 minutes with two medical doctors, 8 minutes with a nurse and 15 minutes with a midwife.  The average salary per year for each of these categories of staff is respectively $100,000, $60,000 and $65,000 for medical doctors, nurses, and midwives. 150
  • 151. Labor Example Answers For 124,800 minutes per year, the cost per minute is as follows:  Medical doctor: 100,000/124,800 = 0.80  Nurse: 60,000/124,800 = 0.48  Midwife: 65,000/124,800 = 0.52 Then the labor cost per staff category is:  Medical doctor: 0.80*10*2 = 16  Nurse: 0.48*8 = 3.84  Midwife: 0.52*15 = 7.8  Total labor cost for disease A per patient = 16+3.84+7.8 = $27.64 151
  • 152. Medical Supplies  Data collected from tool:  Use of medical supplies while providing service (outpatient visits or inpatient days)  Quantity and unit cost of medical supplies used while providing service  Sources of Information:  Procurement/pharmacy records/central medical store  Medical supplies analysis of the MASH  Medical supplies must be:  Disposable  Used while providing given service during a visit  Example: disposable syringe 152
  • 153. Medical Supplies Calculations:  Cost per medical supply type = (medical supply quantity) X (medical supply price)  Calculate total medical supplies costs for one patient treated for a given disease by summing costs of each medical supply type involved 153
  • 154. Medical Supplies Example Estimate the total medical supplies costs associated with treating disease A. For treatment of disease A, for the initial visit (recall there is no follow up visits for this disease) the following medical supplies are used  2 Syringes 5ml with needle (priced at $0.2 each)  1 test kit (priced at $5 each)  4 pairs of sterile gloves (priced at $0.1 per pair)  2 pairs of non-sterile gloves (priced at $0.05 per pair) 154
  • 155. Medical Supplies Example Answers The cost of medical supplies is as follows:  Syringes: 0.2*5 = 1  Test kit: 1*5 = 5  Sterile gloves: 4*0.1 = 0.4  Non-sterile gloves: 2*0.05 = 0.1 Total medical supplies cost for disease A per patient = 1+5+0.4+0.1 = $6.5 155
  • 156. Drugs  Data collected from tool:  Use of drugs/medications while providing service  Dose/quantity/formulation  Unit cost  Drugs must be used in providing service during a visit  Example: antibiotic dose given during a visit  Sources of information are similar to those for medical supplies 156
  • 157. Drugs Calculations: Example for pills Price per pill = (price of container) / (number of pills per container) Drugs cost = (price per pill) X (quantity of pills per dose) Calculate total drug costs for one patient treated for that disease by summing costs for each drug type 157
  • 158. Drugs Example Estimate the total drugs costs associated with treating disease A. For treatment of disease A, during the initial visit (recall there are no follow up visits for this disease) the following drugs are used for an adult average patient:  Drug 1 is given through injection: the patient gets 1 dose of 1ml  Drug 2 is a pill and the patient gets 500mg  Price info: Drug1 comes in pack of 10 doses (1ml each) for $18 and Drug 2 comes in bottles of 1,000 pills (250 mg each), the bottle cost $5. 158
  • 159. Drugs Example Answer The cost for drugs is as follows:  Drug 1: $18/10 = $1.8  Drug 2: if the patient needs 500mg, then he has to take 2 pills of 250 mg at a cost of ($5/1000)*2 = $0.01 Total cost for disease A per patient = $1.8+ $0.01= $1.81 159
  • 160. Medical Equipment/Materials  Data collected from tool:  Use of medical equipment/materials while providing service  Quantity (if multiple) of each type of equipment/material  Unit cost of each type of equipment/material  Equipment must:  Be used while providing the service  Specifically be for that type of service  Not be disposable 160
  • 161. Medical Equipment/Materials Generally, only consider specialized equipment that is costly and needs to be depreciated  Example: oxygen machine as part of the treatment on serious admitted patients Determine if the equipment was purchased, leased, or donated  Account for depreciation Source for information:  Purchasing procurement records  Supplier brochures/internet search 161
  • 162. Medical Equipment/Materials  Depending on nature of equipment, medical equipment cost is calculated by:  Dividing cost of equipment by total number of procedures the equipment can be used for during its useful life or  Dividing annual depreciated value of the equipment with the number of times the equipment were used during the year  Hospitals in low resource settings:  Cost of equipment is accounted for in the “structural cost” (or “hotel cost”) of a day of hospitalization or of an outpatient visit (discussed later)  Structural cost found from the MASH 162
  • 163. Other Supplies Data collected from tool:  Use of other supplies while providing service  Quantity of each type of supply  Unit cost of each type of supply Only other supplies not listed in medical supplies category should be listed Calculate costs of other supplies using same method as for medical supplies 163
  • 164. Labs/Tests/Radiology Exams/Other Procedures  Data collected from tool:  Use of test and exams for the service provided  Quantity of each type of test or exam  Tests/exams must be routinely performed when providing service  Example: electrolytes test for severe gastroenteritis  Tests/exams are typically intermediate steps but require resources:  Example: blood test requires staff time (a lab technician), medical supplies (vials, for example), reagents, equipment (needed for testing), etc. 164
  • 165. Labs/Tests/Radiology Exams/Other Procedures  Cost of one test/exam is made up of multiple cost components (labor, drugs, equipment, etc.)  These should be collected and entered in a separate entry sheet  Calculations:  Each cost component must be costed similarly to what is described above  Note: for equipment cost, the same approach of computing the “hotel cost” Cost components are then aggregated to find unit cost of one test 165
  • 166. Drugs and Medical Supplies Prescribed or Distributed Data collected from tool:  Drugs or medical supplies prescribed or distributed to the patient at the end of the visit/hospital stay as part of the given service  Quantity/Dose per day  Number of days on treatment  Unit cost Only those dispensed or prescribed (and subsidized) to patient as part of the treatment Calculating costs:  Use same steps outlined for Drugs and Medical Supplies 166
  • 167. “Hotel” costs or structural cost “Hotel cost” is cost of infrastructure, infrastructure maintenance, and management in each service provided  Equipment cost usually included  Obtained from MASH for each intermediate and final cost center Example: patient is typically admitted in a room that needs cleaning, patient will be served meals and have his/her sheets washed, building maintenance is also necessary, etc. 167
  • 168. “Hotel” costs or structural cost After step-down allocation of administrative and logistical cost centers  new cost for the intermediate and final cost centers Total labor, drugs, and medical supplies costs for each cost center should be taken out from the new allocated costs  Resulting value divided by: number of visits (for outpatient departments) number of days of admission (for inpatient care) number of procedures (for intermediate cost centers) 168
  • 169. CALCULATING THE UNIT COST OF TREATMENT OF THE DISEASE 169
  • 170. Total Cost per Patient per Service Total cost per patient per service =  Total labor cost +  Total medical supplies cost +  Total drug cost +  Total lab tests cost +  Total radiology exams cost +  Total medical equipment/material cost +  Total other supplies cost +  Total drugs and medical supplies prescribed or distributed cost 170
  • 171. Example 171 Pathology Cost of medical staff (US$) Cost of supplies and drugs (US$) Cost of tests and Exams (US$) Cost of surgical procedures and other procedures (US$) Hotel cost (US$) Total treatment cost (US$) Severe pre-eclampsia 47.87 77.50 65.19 339.49 202.81 732.86 Cephalo-pelvic disproportion 18.58 44.81 28.76 339.49 121.69 553.34 Materno-fetal infection 31.44 45.12 131.78 NA 237.92 446.26 Severe prematurity 117.95 162.06 106.32 NA 713.75 1,100.08 Cerebrovascular accident (CVA) 55.11 191.55 99.56 NA 282.90 629.11 Cardiac decompensation 56.01 39.04 126.54 NA 323.31 544.90 Femur fracture 42.19 204.60 113.75 430.45 1,193.07 1,984.06 Closed leg fracture 28.13 144.17 96.98 430.45 795.38 1,495.10 Open leg fracture 60.04 234.80 96.98 430.45 1,590.76 2,413.03 Intestinal occlusion 46.71 115.60 117.02 407.99 917.80 1,605.12 Generalized peritonitis 69.57 200.99 133.52 426.56 1,101.35 1,931.99
  • 172. EXERCISE: COST PER DISEASE ESTIMATION 172
  • 173. Exercise on Cost per Disease Estimation Use the service costing analysis template to estimate cost per input category and obtain a cost per disease treatment. You will have 45 minutes to complete the intestinal occlusion cost 173
  • 174. Abt Associates In collaboration with: Avenir Health | Broad Branch Associates | Development Alternatives Inc. (DAI) | Johns Hopkins Bloomberg School of Public Health (JHSPH) | Results for Development Institute (R4D) | RTI International | Training Resources Group, Inc. (TRG) Thank you Photo Credit: Colby Gottert/Digital Development Communications