SlideShare a Scribd company logo
1 of 6
Download to read offline
Sydney sub-regions
Clearance
rate
Total
auctions
CoreLogic
auction
results
Central Coast 88.0% 51 25
Baulkham Hills and Hawkesbury n.a. 16 7
Blacktown 80.0% 13 10
City and Inner South 88.1% 74 42
Eastern Suburbs 96.2% 36 26
Inner South West 85.7% 59 42
Inner West 90.5% 64 42
North Sydney and Hornsby 94.8% 85 58
Northern Beaches 93.0% 72 43
Outer South West n.a. 8 7
Outer West and Blue Mountains n.a. 7 7
Parramatta 63.2% 30 19
Ryde 81.3% 38 16
South West 61.9% 38 21
Sutherland 77.8% 39 27
Melbourne sub-regions
Inner 72.6% 94 51
Inner East 82.1% 39 28
Inner South 61.9% 77 42
North East 89.2% 44 37
North West 77.4% 49 31
Outer East 74.4% 49 39
South East 79.0% 58 38
West 69.8% 91 53
Mornington Peninsula 80.0% 39 25
Regional auction results
Hunter 68.3% 76 41
Wollongong 66.7% 55 36
Gold Coast 52.9% 47 17
Sunshine Coast 44.0% 49 25
Geelong 73.3% 35 15
0%
10%
20%
30%
40%
50%
60%
70%
80%
90%
100%
Feb 11 Feb 12 Feb 13 Feb 14 Feb 15 Feb 16 Feb 17
0%
10%
20%
30%
40%
50%
60%
70%
80%
90%
100%
Feb 11 Feb 12 Feb 13 Feb 14 Feb 15 Feb 16 Feb 17
0%
10%
20%
30%
40%
50%
60%
70%
80%
90%
100%
Feb 11 Feb 12 Feb 13 Feb 14 Feb 15 Feb 16 Feb 17
0%
10%
20%
30%
40%
50%
60%
70%
80%
90%
100%
Feb 11 Feb 12 Feb 13 Feb 14 Feb 15 Feb 16 Feb 17
0%
10%
20%
30%
40%
50%
60%
70%
80%
90%
Feb 11 Feb 12 Feb 13 Feb 14 Feb 15 Feb 16 Feb 17
City
Clearance
rate
Total
auctions
CoreLogic
auction
results
Cleared
auctions
Uncleared
auctions
Clearance
rate
(last year)
Total
auctions
(last year)
Sydney 84.8% 633 395 335 60 78.1% 513
Melbourne 75.4% 542 345 260 85 74.4% 556
Brisbane 65.7% 129 70 46 24 48.4% 111
Adelaide 72.3% 87 47 34 13 75.0% 91
Perth 37.5% 74 16 6 10 31.6% 46
Tasmania 60.0% 13 5 3 2 52.4% 24
Canberra 80.0% 86 60 48 12 71.2% 59
Weighted
Average
76.6% 1,564 938 732 206 71.8% 1,400
Preliminary clearance rates surges to 76.6 per cent as the number of auctions continues to trend higher
It has been strong week for auction activity across the capital cities, with the number of auctions more than doubling compared with last week in
Sydney and Melbourne. Despite the surge in the number of auctions held, the combined capitals region recorded a preliminary auction clearance
rate of 76.6 per cent, up from last week, when the final clearance rate dipped to 68.7 per cent. Auction volumes saw a significant increase over
the week, with volumes rising week-on-week across all of the capital cities, with the exception of Adelaide which saw a decrease. There were
1,564 properties taken to auction across the combined capital cities this week, compared to last week’s 881. At the same time last year, auction
volumes were lower, with 1,400 capital city auctions held with a lower rate of clearance (71.8 per cent). The two largest auctions markets,
Sydney and Melbourne, recorded a preliminary clearance rate of 84.8 per cent and 75.4 per cent respectively, suggesting that vendors are still
very much in the driver’s seat across these markets.
Weekly clearance rate, Melbourne
Weekly clearance rate, Adelaide
Weekly clearance rate, Sydney
1
The above results are preliminary, with ‘final’ auction clearance rates published each Thursday. CoreLogic, on average, collects between 85% and
90% of auction results each week. Clearance rates are calculated across properties that have been taken to auction over the past week.
CoreLogic Property Market Indicator Summary
All data to week ending 12 February 2017
Capital city auction statistics (preliminary) Weekly clearance rate, combined capital cities
Weekly clearance rate, Brisbane
$786,844
$565,000
$515,000
$440,000
$515,000
$350,000
$566,250
$587,750
$675,000
$450,000
$388,000
$310,000
$429,000
$313,000
$365,000
$410,000
$0
$100,000
$200,000
$300,000
$400,000
$500,000
$600,000
$700,000
$800,000
$900,000
Sydney Melbourne Brisbane Adelaide Perth Hobart Darwin Canberra
Houses Units
Capital city
Number
of Sales
Median
price
Number
of Sales
Median
price
Sydney 1,793 $786,844 966 $675,000
Melbourne 1,554 $565,000 663 $450,000
Brisbane 1,432 $515,000 265 $388,000
Adelaide 741 $440,000 135 $310,000
Perth 1,142 $515,000 237 $429,000
Hobart 188 $350,000 38 $313,000
Darwin 46 $566,250 14 $365,000
Canberra 138 $587,750 85 $410,000
Combined Capitals 7,034 $584,792 2,403 $519,599
HOUSES UNITS
0
10,000
20,000
30,000
40,000
50,000
Feb 10 Feb 11 Feb 12 Feb 13 Feb 14 Feb 15 Feb 16 Feb 17
Total listings New listingsCapital city
No of new
listings
12 mth
change (%)
No of total
listings
12 mth
change (%)
Sydney 7,770 1.0% 19,267 -11.0%
Melbourne 8,401 -2.0% 25,952 -7.6%
Brisbane 4,458 -0.6% 19,213 5.3%
Adelaide 2,127 -3.1% 8,146 0.7%
Perth 4,149 -6.1% 21,860 3.6%
Hobart 429 -0.5% 1,682 -33.2%
Darwin 158 -26.9% 1,504 -2.7%
Canberra 789 17.2% 1,950 -6.5%
Combined capitals 28,281 -1.4% 99,574 -3.6%
560
580
600
620
640
660
680
700
720
740
760
780
800
820
Feb 14 Aug 14 Feb 15 Aug 15 Feb 16 Aug 16 Feb 17
Daily Index Value
Capital city
Weekly
change
Monthly
change
Yr to date
change
12 mth
change
Sydney 0.9% 2.4% 2.2% 16.9%
Melbourne -0.4% -0.6% 0.2% 11.4%
Brisbane -0.3% 0.6% 0.2% 4.1%
Adelaide 0.5% 1.5% 1.0% 5.3%
Perth -1.0% 0.6% -0.9% -2.9%
Combined 5 capitals 0.1% 1.0% 1.0% 10.9%
2
Results are based on the CoreLogic Daily Home Value Index. Further information and daily updates on the index results are available from
http://www.corelogic.com.au/research/daily-indices.html.
*Brisbane results are for the combined Brisbane and Gold Coast
region. The monthly change is the change over the past 28 days.
Private treaty sales represent around 85% of all dwelling sales across the country. The statistics are calculated across houses and units sold over the most
recent four week period. Records without a valid sale price have been excluded from the analysis.
CoreLogic Property Market Indicator Summary
All data to week ending 12 February 2017
Capital city home value changes Daily home value index, 5 capital city aggregate
Capital city private treaty median prices Median house and unit prices
Capital city properties listed for sale Number of homes for sale, combined capital cities
These results are calculated across properties that have been advertised for sale over the past 28 days. A new listing is one which has not been advertised
for sale over the past 6 months, total listings include new listings and properties which have been previously advertised.
To access detailed analysis of some of these key indicators on a suburb level, please log into your CoreLogic Professional
system or contact us on info@corelogic.com.au. Alternatively, ring 1300 734 318 to subscribe to Market Trends
50
100
150
200
250
300
350
400
Feb 13 Aug 13 Feb 14 Aug 14 Feb 15 Aug 15 Feb 16 Aug 16 Feb 17
Listing Index
Region Index value
Month on month
change
Month on month
change (seas adj)
National 361.7 93.0% -3.2%
NSW 421.0 115.6% -4.2%
QLD 272.5 77.5% -2.2%
SA 310.0 78.2% -5.5%
TAS 154.1 96.4% -2.6%
VIC 493.0 95.7% -2.6%
WA 344.2 69.5% -2.4%
Region Index value
Month on month
change
Month on month
change (trend)
National 116.6 15.7% -8.9%
NSW 153.6 20.8% -11.0%
QLD 114.6 23.7% -8.9%
SA 77.0 8.0% -5.5%
TAS 94.7 28.7% -4.1%
VIC 120.8 6.5% -8.2%
WA 92.2 23.2% -9.0%
0
20
40
60
80
100
120
140
160
180
Feb 13 Aug 13 Feb 14 Aug 14 Feb 15 Aug 15 Feb 16 Aug 16 Feb 17
Mortgage Index
Mortgage Index (rolling three month trend)
ABS Owner Occupier housing finance commitments (monthly)
-4.1%
-3.6%
-5.4%
-5.5%
-8.1%
-4.7%
-8.3%
-2.5%
-4.1%
-5.1%
-6.2%
-6.8%
-9.2%
-4.9%
-10.5%
-2.9%
-12%
-11%
-10%
-9%
-8%
-7%
-6%
-5%
-4%
-3%
-2%
-1%
0%
Sydney Melbourne Brisbane Adelaide Perth Hobart Darwin Canberra
Houses Units
51days
46days
75days
69days
89days
48days
102days
55days
52days
62days
92days
71days
97days
43days
118days
67days
days
10 days
20 days
30 days
40 days
50 days
60 days
70 days
80 days
90 days
100 days
110 days
120 days
Sydney Melbourne Brisbane Adelaide Perth Hobart Darwin Canberra
Houses UnitsCapital city
Median
TOM
Avg Vendor
Disc.
Median
TOM
Avg Vendor
Disc.
Sydney 51 days -4.1% 52 days -4.1%
Melbourne 46 days -3.6% 62 days -5.1%
Brisbane 75 days -5.4% 92 days -6.2%
Adelaide 69 days -5.5% 71 days -6.8%
Perth 89 days -8.1% 97 days -9.2%
Hobart 48 days -4.7% 43 days -4.9%
Darwin 102 days -8.3% 118 days -10.5%
Canberra 55 days -2.5% 67 days -2.9%
HOUSES UNITS
‘Time on market’ (TOM) is simply the middle number of days between when a property is first listed for sale and the contract date. The rate of vendor
discounting is the average percentage difference between the original listing price and the final selling price. The statistics are calculated across results
received by CoreLogic over the past week and include properties transacted over the past four weeks. The data is based on private treaty sales only and
records without a valid sale price have been excluded from the vendor discount analysis. The analysis also excludes results where there are less than 10
observations.
3
CoreLogic systems monitor more than 100,000 mortgage activity events every month across our 4 main finance industry platforms. Monitoring the activity
events across this platform provides a unique and timely lead indicator to housing finance commitments. The index shows an 81% correlation with the ABS
housing finance data series (88% using the seasonally adjusted series). Based on the strong correlation and significant number of events being monitored,
the Mortgage Index provides the most timely and holistic measure of mortgage market activity available.
The CoreLogic Listings Index provides a lead indicator for the number of residential dwellings that are being prepared for sale across the Australian housing
market. CoreLogic customers account for over 70% of all listings in the Australian property market. The index, which tracks the flow of metadata across
CoreLogic’s real estate data platform, shows a 75% correlation with the number of new listings about to enter the market.
Capital city median time on market and
average vendor discounting results
Median time on market Average vendor
discounting
Mortgage market activity CoreLogic Mortgage Index
Listing market activity CoreLogic Listing Index
CoreLogic Property Market Indicator Summary
All data to week ending 12 February 2017
To access detailed analysis of some of these key indicators on a suburb level, please log into your CoreLogic Professional
system or contact us on info@corelogic.com.au. Alternatively, ring 1300 734 318 to subscribe to Market Trends
4
CoreLogic Property Market Indicator Summary
All data to week ending 12 February 2017
To access detailed analysis of some of these key indicators on a suburb level, please log into your CoreLogic Professional
system or contact us on info@corelogic.com.au. Alternatively, ring 1300 734 318 to subscribe to Market Trends
Top two sales over the past week, states and territories
69 Mackenzie St,
Hackett, ACT
5 Bed, 3 Bath, 2 Car house
$1,246,000
One Agency Crane
Properties Gungahlin
35 The Point Rd,
Woolwich, NSW
4 Bed, 4 Bath, 4 Car house
$6,680,000
McGrath Estate Agents
151 Woods Tce,
Braitling, NT
4 Bed, 2 Bath, 7 Car house
$550,000
Elders Alice Springs
32 Ivy St,
Indooroopilly, Qld
5 Bed, 5 Bath, 5 Car house
$3,250,000
McGrath Estate Agents
60 Galore St,
Crace, ACT
4 Bed, 3 Bath, 2 Car
$1,175,000
McGrath Estate Agents
79A Fletcher St,
Tamarama, NSW
4 Bed, 3 Bath, 2 Car house
$4,775,000
Phillips Pantzer Donnelley
Woollahra
4 Mayhew Cres,
Jingili, NT
3 Bed, 1 Bath, 2 Car house
$530,000
Home Zone NT Darwin
4 Garrick St,
Coolangatta, Qld
4 Bed, 4 Bath, 4 Car house
$2,370,000
McGrath Estate Agents
Australian Capital Territory
New South Wales
Northern Territory
Queensland
5
CoreLogic Property Market Indicator Summary
All data to week ending 12 February 2017
To access detailed analysis of some of these key indicators on a suburb level, please log into your CoreLogic Professional
system or contact us on info@corelogic.com.au. Alternatively, ring 1300 734 318 to subscribe to Market Trends
Top two sales over the past week, states and territories
397 Esplanade,
Henley Beach, SA
3 Bed, 2 Bath, 4 Car house
$2,170,000
Bruse Real Estate
5 Derwentwater Ave,
Sandy Bay, Tas
4 Bed, 2 Bath, 4 Car house
$1,050,000
Harcourts Hobart
200 South Rd,
Brighton East, Vic
4 Bed, 1 Bath, 1 Car house
$1,920,000
Nick Johnstone Real Estate
Brighton
4/62 Marine Pde,
Cottesloe, WA
3 Bed, 3 Bath, 2 Car house
$3,350,000
Shellabears Cottesloe
35 Star And Arrow Rd,
Cherry Gardens, SA
6 Bed, 2 Bath, 14 Car house
$1,300,000
Lauraine Burrowes Real
Estate Hahndorf
321 Brightwater Rd,
Howden, Tas
4 Bed, 2 Bath, 7 Car house
$868,000
Harcourts Kingborough
Kingston
80 Alfrieda St,
St Albans, Vic
3 Bed, 2 Bath, 2 Car house
$1,810,000
Ray White St Albans
10 The Lane ,
Churchlands, WA
4 Bed, 2 Bath, 2 Car house
$1,260,000
LJ Hooker Claremont
South Australia
Tasmania
Victoria
Western Australia
6
About CoreLogic
CoreLogic Australia is a wholly owned subsidiary of CoreLogic (NYSE: CLGX), which is the largest property data and analytics
company in the world. CoreLogic provides property information, analytics and services across Australia, New Zealand and Asia, and
recently expanded its service offering through the purchase of project activity and building cost information provider Cordell. With
Australia’s most comprehensive property databases, the company’s combined data offering is derived from public, contributory and
proprietary sources and includes over 500 million decision points spanning over three decades of collection, providing detailed
coverage of property and other encumbrances such as tenancy, location, hazard risk and related performance information.
With over 20,000 customers and 150,000 end users, CoreLogic is the leading provider of property data, analytics and related
services to consumers, investors, real estate, mortgage, finance, banking, building services, insurance, developers, wealth
management and government. CoreLogic delivers value to clients through unique data, analytics, workflow technology, advisory and
geo spatial services. Clients rely on CoreLogic to help identify and manage growth opportunities, improve performance and mitigate
risk. CoreLogic employs over 650 people across Australia and in New Zealand. For more information call 1300 734 318 or visit
www.corelogic.com.au
Disclaimers
In compiling this publication, RP Data Pty Ltd trading as CoreLogic has relied upon information supplied by a number of external
sources. CoreLogic does not warrant its accuracy or completeness and to the full extent allowed by law excludes liability in contract,
tort or otherwise, for any loss or damage sustained by subscribers, or by any other person or body corporate arising from or in
connection with the supply or use of the whole or any part of the information in this publication through any cause whatsoever and
limits any liability it may have to the amount paid to CoreLogic for the supply of such information.
Queensland Data
Based on or contains data provided by the State of Queensland (Department of Natural Resources and Mines) 2017. In consideration
of the State permitting use of this data you acknowledge and agree that the State gives no warranty in relation to the data (including
accuracy, reliability, completeness, currency or suitability) and accepts no liability (including without limitation, liability in negligence)
for any loss, damage or costs (including consequential damage) relating to any use of the data. Data must not be used for direct
marketing or be used in breach of the privacy laws.
South Australian Data
This information is based on data supplied by the South Australian Government and is published by permission. The South
Australian Government does not accept any responsibility for the accuracy or completeness of the published information or suitability
for any purpose of the published information or the underlying data.
New South Wales Data
Contains property sales information provided under licence from the Land and Property Information (“LPI”). CoreLogic is authorised
as a Property Sales Information provider by the LPI.
Victorian Data
The State of Victoria owns the copyright in the Property Sales Data which constitutes the basis of this report and reproduction of that
data in any way without the consent of the State of Victoria will constitute a breach of the Copyright Act 1968 (Cth). The State of
Victoria does not warrant the accuracy or completeness of the information contained in this report and any person using or relying
upon such information does so on the basis that the State of Victoria accepts no responsibility or liability whatsoever for any errors,
faults, defects or omissions in the information supplied.
Western Australian Data
Based on information provided by and with the permission of the Western Australian Land Information Authority (2017) trading as
Landgate.
Australian Capital Territory Data
The Territory Data is the property of the Australian Capital Territory. No part of it may in any form or by any means (electronic,
mechanical, microcopying, photocopying, recording or otherwise) be reproduced, stored in a retrieval system or transmitted without
prior written permission. Enquiries should be directed to: Director, Customer Services ACT Planning and Land Authority GPO Box
1908 Canberra ACT 2601.
Tasmanian Data
This product incorporates data that is copyright owned by the Crown in Right of Tasmania. The data has been used in the product
with the permission of the Crown in Right of Tasmania. The Crown in Right of Tasmania and its employees and agents:
a) give no warranty regarding the data's accuracy, completeness, currency or suitability for any particular purpose; and
b) do not accept liability howsoever arising, including but not limited to negligence for any loss resulting from the use of or reliance
upon the data.
Base data from the LIST © State of Tasmania http://www.thelist.tas.gov.au
CoreLogic Property Market Indicator Summary
All data to week ending 12 February 2017
To access detailed analysis of some of these key indicators on a suburb level, please log into your CoreLogic Professional
system or contact us on info@corelogic.com.au. Alternatively, ring 1300 734 318 to subscribe to Market Trends

More Related Content

What's hot

FVREB July 2020 Stats
FVREB July 2020 StatsFVREB July 2020 Stats
FVREB July 2020 StatsVicky Aulakh
 
Fraser Valley Real Estate Board August 2021 Statistics
Fraser Valley Real Estate Board August 2021 Statistics Fraser Valley Real Estate Board August 2021 Statistics
Fraser Valley Real Estate Board August 2021 Statistics Vicky Aulakh
 
Fraser Valley Real Estate Board July 2021 Statistics
Fraser Valley Real Estate Board July 2021 Statistics Fraser Valley Real Estate Board July 2021 Statistics
Fraser Valley Real Estate Board July 2021 Statistics Vicky Aulakh
 
FVREB June 2021 Statistics Package
FVREB June 2021 Statistics PackageFVREB June 2021 Statistics Package
FVREB June 2021 Statistics PackageVicky Aulakh
 
Fvreb package april 2020
Fvreb package april 2020Fvreb package april 2020
Fvreb package april 2020Vicky Aulakh
 
Fraser Valley Real Estate Board Statistics - November 2021
Fraser Valley Real Estate Board Statistics - November 2021 Fraser Valley Real Estate Board Statistics - November 2021
Fraser Valley Real Estate Board Statistics - November 2021 VickyAulakh1
 
FVREB October 2020 Statistics Package
FVREB October 2020 Statistics PackageFVREB October 2020 Statistics Package
FVREB October 2020 Statistics PackageVicky Aulakh
 
July fvreb stats package
July fvreb stats packageJuly fvreb stats package
July fvreb stats packageVicky Aulakh
 
Fraser Valley Real Estate Board June 2020
Fraser Valley Real Estate Board June 2020 Fraser Valley Real Estate Board June 2020
Fraser Valley Real Estate Board June 2020 Vicky Aulakh
 
FVREB April 2021 Statistics Package
FVREB April 2021 Statistics PackageFVREB April 2021 Statistics Package
FVREB April 2021 Statistics PackageVicky Aulakh
 
Fvreb August 2020 Stats Package
Fvreb August 2020 Stats PackageFvreb August 2020 Stats Package
Fvreb August 2020 Stats PackageVicky Aulakh
 
Nov 2019 fvreb stats package
Nov 2019 fvreb stats packageNov 2019 fvreb stats package
Nov 2019 fvreb stats packageVicky Aulakh
 
Dec 2020 Fraser Valley Real Estate Board Package
Dec 2020 Fraser Valley Real Estate Board PackageDec 2020 Fraser Valley Real Estate Board Package
Dec 2020 Fraser Valley Real Estate Board PackageVicky Aulakh
 
FVREB September 2021 Statistics Package
FVREB September 2021 Statistics PackageFVREB September 2021 Statistics Package
FVREB September 2021 Statistics PackageVickyAulakh1
 
Okanagan Real Estate Statistics Package - September 2021
Okanagan Real Estate Statistics Package - September 2021Okanagan Real Estate Statistics Package - September 2021
Okanagan Real Estate Statistics Package - September 2021VickyAulakh1
 
Fraser Valley Real Estate Board Statistics Package Jan 2021
Fraser Valley Real Estate Board Statistics Package Jan 2021Fraser Valley Real Estate Board Statistics Package Jan 2021
Fraser Valley Real Estate Board Statistics Package Jan 2021Vicky Aulakh
 
Fraser Valley Real Estate Board Statistics Package March 2021
Fraser Valley Real Estate Board Statistics Package March 2021 Fraser Valley Real Estate Board Statistics Package March 2021
Fraser Valley Real Estate Board Statistics Package March 2021 Vicky Aulakh
 
Feb 20 package fvreb
Feb 20 package fvrebFeb 20 package fvreb
Feb 20 package fvrebVicky Aulakh
 
Fraser Valley Real Estate Board Statistics Package January 2020
Fraser Valley Real Estate Board Statistics Package January 2020 Fraser Valley Real Estate Board Statistics Package January 2020
Fraser Valley Real Estate Board Statistics Package January 2020 Vicky Aulakh
 
Fvreb oct stats package 2019
Fvreb oct stats package 2019 Fvreb oct stats package 2019
Fvreb oct stats package 2019 Vicky Aulakh
 

What's hot (20)

FVREB July 2020 Stats
FVREB July 2020 StatsFVREB July 2020 Stats
FVREB July 2020 Stats
 
Fraser Valley Real Estate Board August 2021 Statistics
Fraser Valley Real Estate Board August 2021 Statistics Fraser Valley Real Estate Board August 2021 Statistics
Fraser Valley Real Estate Board August 2021 Statistics
 
Fraser Valley Real Estate Board July 2021 Statistics
Fraser Valley Real Estate Board July 2021 Statistics Fraser Valley Real Estate Board July 2021 Statistics
Fraser Valley Real Estate Board July 2021 Statistics
 
FVREB June 2021 Statistics Package
FVREB June 2021 Statistics PackageFVREB June 2021 Statistics Package
FVREB June 2021 Statistics Package
 
Fvreb package april 2020
Fvreb package april 2020Fvreb package april 2020
Fvreb package april 2020
 
Fraser Valley Real Estate Board Statistics - November 2021
Fraser Valley Real Estate Board Statistics - November 2021 Fraser Valley Real Estate Board Statistics - November 2021
Fraser Valley Real Estate Board Statistics - November 2021
 
FVREB October 2020 Statistics Package
FVREB October 2020 Statistics PackageFVREB October 2020 Statistics Package
FVREB October 2020 Statistics Package
 
July fvreb stats package
July fvreb stats packageJuly fvreb stats package
July fvreb stats package
 
Fraser Valley Real Estate Board June 2020
Fraser Valley Real Estate Board June 2020 Fraser Valley Real Estate Board June 2020
Fraser Valley Real Estate Board June 2020
 
FVREB April 2021 Statistics Package
FVREB April 2021 Statistics PackageFVREB April 2021 Statistics Package
FVREB April 2021 Statistics Package
 
Fvreb August 2020 Stats Package
Fvreb August 2020 Stats PackageFvreb August 2020 Stats Package
Fvreb August 2020 Stats Package
 
Nov 2019 fvreb stats package
Nov 2019 fvreb stats packageNov 2019 fvreb stats package
Nov 2019 fvreb stats package
 
Dec 2020 Fraser Valley Real Estate Board Package
Dec 2020 Fraser Valley Real Estate Board PackageDec 2020 Fraser Valley Real Estate Board Package
Dec 2020 Fraser Valley Real Estate Board Package
 
FVREB September 2021 Statistics Package
FVREB September 2021 Statistics PackageFVREB September 2021 Statistics Package
FVREB September 2021 Statistics Package
 
Okanagan Real Estate Statistics Package - September 2021
Okanagan Real Estate Statistics Package - September 2021Okanagan Real Estate Statistics Package - September 2021
Okanagan Real Estate Statistics Package - September 2021
 
Fraser Valley Real Estate Board Statistics Package Jan 2021
Fraser Valley Real Estate Board Statistics Package Jan 2021Fraser Valley Real Estate Board Statistics Package Jan 2021
Fraser Valley Real Estate Board Statistics Package Jan 2021
 
Fraser Valley Real Estate Board Statistics Package March 2021
Fraser Valley Real Estate Board Statistics Package March 2021 Fraser Valley Real Estate Board Statistics Package March 2021
Fraser Valley Real Estate Board Statistics Package March 2021
 
Feb 20 package fvreb
Feb 20 package fvrebFeb 20 package fvreb
Feb 20 package fvreb
 
Fraser Valley Real Estate Board Statistics Package January 2020
Fraser Valley Real Estate Board Statistics Package January 2020 Fraser Valley Real Estate Board Statistics Package January 2020
Fraser Valley Real Estate Board Statistics Package January 2020
 
Fvreb oct stats package 2019
Fvreb oct stats package 2019 Fvreb oct stats package 2019
Fvreb oct stats package 2019
 

Viewers also liked

Teoria psicologia laboral
Teoria psicologia laboralTeoria psicologia laboral
Teoria psicologia laboralchajinluis
 
Psicologia del trabajo y de las organizaciones psicologia laboral
Psicologia del trabajo y de las organizaciones   psicologia laboralPsicologia del trabajo y de las organizaciones   psicologia laboral
Psicologia del trabajo y de las organizaciones psicologia laboralRicardo Ruiz
 
Cuadro comparativo de la psicologia organizacional
Cuadro comparativo de la psicologia organizacionalCuadro comparativo de la psicologia organizacional
Cuadro comparativo de la psicologia organizacionalCarolina
 
psicologia industrial
psicologia industrialpsicologia industrial
psicologia industrial12144372
 
Psicologia organizacional
Psicologia organizacionalPsicologia organizacional
Psicologia organizacionaldarinka ra
 

Viewers also liked (6)

Psicologia trabajo
Psicologia trabajoPsicologia trabajo
Psicologia trabajo
 
Teoria psicologia laboral
Teoria psicologia laboralTeoria psicologia laboral
Teoria psicologia laboral
 
Psicologia del trabajo y de las organizaciones psicologia laboral
Psicologia del trabajo y de las organizaciones   psicologia laboralPsicologia del trabajo y de las organizaciones   psicologia laboral
Psicologia del trabajo y de las organizaciones psicologia laboral
 
Cuadro comparativo de la psicologia organizacional
Cuadro comparativo de la psicologia organizacionalCuadro comparativo de la psicologia organizacional
Cuadro comparativo de la psicologia organizacional
 
psicologia industrial
psicologia industrialpsicologia industrial
psicologia industrial
 
Psicologia organizacional
Psicologia organizacionalPsicologia organizacional
Psicologia organizacional
 

Similar to Sydney, Melbourne auction clearance rates and property prices

CoreLogic Property Market Indicator Summary
CoreLogic Property Market Indicator SummaryCoreLogic Property Market Indicator Summary
CoreLogic Property Market Indicator SummaryGigi Noble
 
Vancouver real estate stats package, August 2013
Vancouver real estate stats package, August 2013Vancouver real estate stats package, August 2013
Vancouver real estate stats package, August 2013Matt Collinge
 
CoreLogic’s national Home Value Index (HVI) rose 0.7% in July marking a fift...
CoreLogic’s national Home Value Index (HVI) rose 0.7% in July  marking a fift...CoreLogic’s national Home Value Index (HVI) rose 0.7% in July  marking a fift...
CoreLogic’s national Home Value Index (HVI) rose 0.7% in July marking a fift...LJ Gilland Real Estate Pty Ltd
 
FVREB September 2022 Statistics.pdf
FVREB September 2022 Statistics.pdfFVREB September 2022 Statistics.pdf
FVREB September 2022 Statistics.pdfVickyAulakh1
 
November 2017 rebgv stats mike stewart real estate agent
November 2017 rebgv stats mike stewart real estate agentNovember 2017 rebgv stats mike stewart real estate agent
November 2017 rebgv stats mike stewart real estate agentMike Stewart
 
Rebgv stats-pkg-october-2018 .pdf
Rebgv stats-pkg-october-2018 .pdf Rebgv stats-pkg-october-2018 .pdf
Rebgv stats-pkg-october-2018 .pdf Kathryn Huang
 
Rebgv stats-pkg-may-2018
Rebgv stats-pkg-may-2018Rebgv stats-pkg-may-2018
Rebgv stats-pkg-may-2018Kathryn Huang
 
REBGV Statistics Package October 2020
REBGV Statistics Package October 2020REBGV Statistics Package October 2020
REBGV Statistics Package October 2020Vicky Aulakh
 
August 2017 REBGV Stats Mike Stewart Realtor
August 2017 REBGV Stats Mike Stewart RealtorAugust 2017 REBGV Stats Mike Stewart Realtor
August 2017 REBGV Stats Mike Stewart RealtorMike Stewart
 
FVREB August 2022 Statistics Package
FVREB August 2022 Statistics PackageFVREB August 2022 Statistics Package
FVREB August 2022 Statistics PackageVickyAulakh1
 
May-2019 Stats Package for Greater Vancouver
May-2019 Stats Package for Greater VancouverMay-2019 Stats Package for Greater Vancouver
May-2019 Stats Package for Greater VancouverBC PRIME Realty
 
Rebgv stats-pkg-may-2019
Rebgv stats-pkg-may-2019Rebgv stats-pkg-may-2019
Rebgv stats-pkg-may-2019Kathryn Huang
 
Rebgv stats-pkg-june-2018
Rebgv stats-pkg-june-2018Rebgv stats-pkg-june-2018
Rebgv stats-pkg-june-2018Kathryn Huang
 
Austin Real Estate Market Report May 2013
Austin Real Estate Market Report May 2013 Austin Real Estate Market Report May 2013
Austin Real Estate Market Report May 2013 austinhometeam
 
Rebgv stats-pkg-april-2018
Rebgv stats-pkg-april-2018Rebgv stats-pkg-april-2018
Rebgv stats-pkg-april-2018Kathryn Huang
 
Rebgv stats-pkg-january-2018 2
Rebgv stats-pkg-january-2018 2Rebgv stats-pkg-january-2018 2
Rebgv stats-pkg-january-2018 2Kathryn Huang
 
201807 rebgv-stats-package-for-media
201807 rebgv-stats-package-for-media201807 rebgv-stats-package-for-media
201807 rebgv-stats-package-for-mediaKathryn Huang
 
Rebgv stats-pkg-november-2018
Rebgv stats-pkg-november-2018Rebgv stats-pkg-november-2018
Rebgv stats-pkg-november-2018Kathryn Huang
 

Similar to Sydney, Melbourne auction clearance rates and property prices (20)

CoreLogic Property Market Indicator Summary
CoreLogic Property Market Indicator SummaryCoreLogic Property Market Indicator Summary
CoreLogic Property Market Indicator Summary
 
CoreLogic-HVI-Sep-2023-FINAL.pdf
CoreLogic-HVI-Sep-2023-FINAL.pdfCoreLogic-HVI-Sep-2023-FINAL.pdf
CoreLogic-HVI-Sep-2023-FINAL.pdf
 
Vancouver real estate stats package, August 2013
Vancouver real estate stats package, August 2013Vancouver real estate stats package, August 2013
Vancouver real estate stats package, August 2013
 
CoreLogic’s national Home Value Index (HVI) rose 0.7% in July marking a fift...
CoreLogic’s national Home Value Index (HVI) rose 0.7% in July  marking a fift...CoreLogic’s national Home Value Index (HVI) rose 0.7% in July  marking a fift...
CoreLogic’s national Home Value Index (HVI) rose 0.7% in July marking a fift...
 
FVREB September 2022 Statistics.pdf
FVREB September 2022 Statistics.pdfFVREB September 2022 Statistics.pdf
FVREB September 2022 Statistics.pdf
 
November 2017 rebgv stats mike stewart real estate agent
November 2017 rebgv stats mike stewart real estate agentNovember 2017 rebgv stats mike stewart real estate agent
November 2017 rebgv stats mike stewart real estate agent
 
Rebgv stats-pkg-october-2018 .pdf
Rebgv stats-pkg-october-2018 .pdf Rebgv stats-pkg-october-2018 .pdf
Rebgv stats-pkg-october-2018 .pdf
 
Rebgv stats-pkg-may-2018
Rebgv stats-pkg-may-2018Rebgv stats-pkg-may-2018
Rebgv stats-pkg-may-2018
 
REBGV Statistics Package October 2020
REBGV Statistics Package October 2020REBGV Statistics Package October 2020
REBGV Statistics Package October 2020
 
Rebgv stats-pkg-october-2020
Rebgv stats-pkg-october-2020Rebgv stats-pkg-october-2020
Rebgv stats-pkg-october-2020
 
August 2017 REBGV Stats Mike Stewart Realtor
August 2017 REBGV Stats Mike Stewart RealtorAugust 2017 REBGV Stats Mike Stewart Realtor
August 2017 REBGV Stats Mike Stewart Realtor
 
FVREB August 2022 Statistics Package
FVREB August 2022 Statistics PackageFVREB August 2022 Statistics Package
FVREB August 2022 Statistics Package
 
May-2019 Stats Package for Greater Vancouver
May-2019 Stats Package for Greater VancouverMay-2019 Stats Package for Greater Vancouver
May-2019 Stats Package for Greater Vancouver
 
Rebgv stats-pkg-may-2019
Rebgv stats-pkg-may-2019Rebgv stats-pkg-may-2019
Rebgv stats-pkg-may-2019
 
Rebgv stats-pkg-june-2018
Rebgv stats-pkg-june-2018Rebgv stats-pkg-june-2018
Rebgv stats-pkg-june-2018
 
Austin Real Estate Market Report May 2013
Austin Real Estate Market Report May 2013 Austin Real Estate Market Report May 2013
Austin Real Estate Market Report May 2013
 
Rebgv stats-pkg-april-2018
Rebgv stats-pkg-april-2018Rebgv stats-pkg-april-2018
Rebgv stats-pkg-april-2018
 
Rebgv stats-pkg-january-2018 2
Rebgv stats-pkg-january-2018 2Rebgv stats-pkg-january-2018 2
Rebgv stats-pkg-january-2018 2
 
201807 rebgv-stats-package-for-media
201807 rebgv-stats-package-for-media201807 rebgv-stats-package-for-media
201807 rebgv-stats-package-for-media
 
Rebgv stats-pkg-november-2018
Rebgv stats-pkg-november-2018Rebgv stats-pkg-november-2018
Rebgv stats-pkg-november-2018
 

Recently uploaded

9990771857 Call Girls in Noida Sector 10 Noida (Call Girls) Delhi
9990771857 Call Girls in Noida Sector 10 Noida (Call Girls) Delhi9990771857 Call Girls in Noida Sector 10 Noida (Call Girls) Delhi
9990771857 Call Girls in Noida Sector 10 Noida (Call Girls) Delhidelhimodel235
 
9990771857 Call Girls in Noida Sector 1 Noida (Call Girls) Delhi
9990771857 Call Girls in Noida Sector 1 Noida (Call Girls) Delhi9990771857 Call Girls in Noida Sector 1 Noida (Call Girls) Delhi
9990771857 Call Girls in Noida Sector 1 Noida (Call Girls) Delhidelhimodel235
 
Low Rate Call Girls in Akshardham Delhi Call 9990771857
Low Rate Call Girls in Akshardham   Delhi Call 9990771857Low Rate Call Girls in Akshardham   Delhi Call 9990771857
Low Rate Call Girls in Akshardham Delhi Call 9990771857delhimodel235
 
Low Rate Call Girls in Triveni Complex Delhi Call 9990771857
Low Rate Call Girls in Triveni Complex Delhi Call 9990771857Low Rate Call Girls in Triveni Complex Delhi Call 9990771857
Low Rate Call Girls in Triveni Complex Delhi Call 9990771857delhimodel235
 
Call Girls In Sahibabad Ghaziabad ❤️8860477959 Low Rate Escorts Service In 24...
Call Girls In Sahibabad Ghaziabad ❤️8860477959 Low Rate Escorts Service In 24...Call Girls In Sahibabad Ghaziabad ❤️8860477959 Low Rate Escorts Service In 24...
Call Girls In Sahibabad Ghaziabad ❤️8860477959 Low Rate Escorts Service In 24...lizamodels9
 
Low Rate Call Girls in Tughlakabad Delhi Call 9990771857
Low Rate Call Girls in Tughlakabad Delhi Call 9990771857Low Rate Call Girls in Tughlakabad Delhi Call 9990771857
Low Rate Call Girls in Tughlakabad Delhi Call 9990771857delhimodel235
 
9990771857 Call Girls in Noida Sector 11 Noida (Call Girls) Delhi
9990771857 Call Girls in Noida Sector 11 Noida (Call Girls) Delhi9990771857 Call Girls in Noida Sector 11 Noida (Call Girls) Delhi
9990771857 Call Girls in Noida Sector 11 Noida (Call Girls) Delhidelhimodel235
 
Call Girls in Janakpuri ↫8447779280↫Short 1500 Night 6000-Escorts Service In ...
Call Girls in Janakpuri ↫8447779280↫Short 1500 Night 6000-Escorts Service In ...Call Girls in Janakpuri ↫8447779280↫Short 1500 Night 6000-Escorts Service In ...
Call Girls in Janakpuri ↫8447779280↫Short 1500 Night 6000-Escorts Service In ...asmaqueen5
 
Listing Turkey Sylvana Istanbul - Bahcesehir
Listing Turkey Sylvana Istanbul - BahcesehirListing Turkey Sylvana Istanbul - Bahcesehir
Listing Turkey Sylvana Istanbul - BahcesehirListing Turkey
 
call girls in Shahdara (DELHI) 🔝 >༒9953330565🔝 genuine Escort Service 🔝✔️✔️
call girls in Shahdara (DELHI) 🔝 >༒9953330565🔝 genuine Escort Service 🔝✔️✔️call girls in Shahdara (DELHI) 🔝 >༒9953330565🔝 genuine Escort Service 🔝✔️✔️
call girls in Shahdara (DELHI) 🔝 >༒9953330565🔝 genuine Escort Service 🔝✔️✔️9953056974 Low Rate Call Girls In Saket, Delhi NCR
 
Model Call Girl in Shastri Nagar Delhi reach out to us at 🔝8264348440🔝
Model Call Girl in Shastri Nagar Delhi reach out to us at 🔝8264348440🔝Model Call Girl in Shastri Nagar Delhi reach out to us at 🔝8264348440🔝
Model Call Girl in Shastri Nagar Delhi reach out to us at 🔝8264348440🔝soniya singh
 
Call Girls in laxmi Nagar Delhi 💯Call Us 🔝 9582086666🔝 South Delhi Escorts Se...
Call Girls in laxmi Nagar Delhi 💯Call Us 🔝 9582086666🔝 South Delhi Escorts Se...Call Girls in laxmi Nagar Delhi 💯Call Us 🔝 9582086666🔝 South Delhi Escorts Se...
Call Girls in laxmi Nagar Delhi 💯Call Us 🔝 9582086666🔝 South Delhi Escorts Se...delhimodel235
 
9990771857 Call Girls in Noida Sector 34 Noida (Call Girls) Delhi
9990771857 Call Girls in Noida Sector 34 Noida (Call Girls) Delhi9990771857 Call Girls in Noida Sector 34 Noida (Call Girls) Delhi
9990771857 Call Girls in Noida Sector 34 Noida (Call Girls) Delhidelhimodel235
 
Call Girls in Noida Sector 11 Noida 💯Call Us 🔝 9582086666 🔝 South Delhi Escor...
Call Girls in Noida Sector 11 Noida 💯Call Us 🔝 9582086666 🔝 South Delhi Escor...Call Girls in Noida Sector 11 Noida 💯Call Us 🔝 9582086666 🔝 South Delhi Escor...
Call Girls in Noida Sector 11 Noida 💯Call Us 🔝 9582086666 🔝 South Delhi Escor...delhimodel235
 
Nanke Area Estate commercial ( Dir. Kat Kuo)
Nanke Area Estate commercial ( Dir. Kat Kuo)Nanke Area Estate commercial ( Dir. Kat Kuo)
Nanke Area Estate commercial ( Dir. Kat Kuo)jessica288382
 
83770-87607 ۞Call Girls In Near The Park Hotel (Cp) Delhi
83770-87607 ۞Call Girls In Near The Park Hotel (Cp) Delhi83770-87607 ۞Call Girls In Near The Park Hotel (Cp) Delhi
83770-87607 ۞Call Girls In Near The Park Hotel (Cp) Delhidollysharma2066
 
9711199012 Call {Girls Delhi} Very Low rate Vaishali DownLoad PDF
9711199012 Call {Girls Delhi} Very Low rate Vaishali DownLoad PDF9711199012 Call {Girls Delhi} Very Low rate Vaishali DownLoad PDF
9711199012 Call {Girls Delhi} Very Low rate Vaishali DownLoad PDFMs Riya
 
Call Girls In Madipur Metro Delhi꧁ +91)8447779280꧂Low Rate 2 short 2000 full ...
Call Girls In Madipur Metro Delhi꧁ +91)8447779280꧂Low Rate 2 short 2000 full ...Call Girls In Madipur Metro Delhi꧁ +91)8447779280꧂Low Rate 2 short 2000 full ...
Call Girls In Madipur Metro Delhi꧁ +91)8447779280꧂Low Rate 2 short 2000 full ...asmaqueen5
 
Low Rate Call Girls In Madipur Slum Quarter +91)8447779280Low Rate 2 short 2...
Low Rate Call Girls In Madipur Slum Quarter  +91)8447779280Low Rate 2 short 2...Low Rate Call Girls In Madipur Slum Quarter  +91)8447779280Low Rate 2 short 2...
Low Rate Call Girls In Madipur Slum Quarter +91)8447779280Low Rate 2 short 2...asmaqueen5
 

Recently uploaded (20)

9990771857 Call Girls in Noida Sector 10 Noida (Call Girls) Delhi
9990771857 Call Girls in Noida Sector 10 Noida (Call Girls) Delhi9990771857 Call Girls in Noida Sector 10 Noida (Call Girls) Delhi
9990771857 Call Girls in Noida Sector 10 Noida (Call Girls) Delhi
 
9990771857 Call Girls in Noida Sector 1 Noida (Call Girls) Delhi
9990771857 Call Girls in Noida Sector 1 Noida (Call Girls) Delhi9990771857 Call Girls in Noida Sector 1 Noida (Call Girls) Delhi
9990771857 Call Girls in Noida Sector 1 Noida (Call Girls) Delhi
 
Low Rate Call Girls in Akshardham Delhi Call 9990771857
Low Rate Call Girls in Akshardham   Delhi Call 9990771857Low Rate Call Girls in Akshardham   Delhi Call 9990771857
Low Rate Call Girls in Akshardham Delhi Call 9990771857
 
Low Rate Call Girls in Triveni Complex Delhi Call 9990771857
Low Rate Call Girls in Triveni Complex Delhi Call 9990771857Low Rate Call Girls in Triveni Complex Delhi Call 9990771857
Low Rate Call Girls in Triveni Complex Delhi Call 9990771857
 
Call Girls In Sahibabad Ghaziabad ❤️8860477959 Low Rate Escorts Service In 24...
Call Girls In Sahibabad Ghaziabad ❤️8860477959 Low Rate Escorts Service In 24...Call Girls In Sahibabad Ghaziabad ❤️8860477959 Low Rate Escorts Service In 24...
Call Girls In Sahibabad Ghaziabad ❤️8860477959 Low Rate Escorts Service In 24...
 
Low Rate Call Girls in Tughlakabad Delhi Call 9990771857
Low Rate Call Girls in Tughlakabad Delhi Call 9990771857Low Rate Call Girls in Tughlakabad Delhi Call 9990771857
Low Rate Call Girls in Tughlakabad Delhi Call 9990771857
 
9990771857 Call Girls in Noida Sector 11 Noida (Call Girls) Delhi
9990771857 Call Girls in Noida Sector 11 Noida (Call Girls) Delhi9990771857 Call Girls in Noida Sector 11 Noida (Call Girls) Delhi
9990771857 Call Girls in Noida Sector 11 Noida (Call Girls) Delhi
 
Call Girls in Janakpuri ↫8447779280↫Short 1500 Night 6000-Escorts Service In ...
Call Girls in Janakpuri ↫8447779280↫Short 1500 Night 6000-Escorts Service In ...Call Girls in Janakpuri ↫8447779280↫Short 1500 Night 6000-Escorts Service In ...
Call Girls in Janakpuri ↫8447779280↫Short 1500 Night 6000-Escorts Service In ...
 
Listing Turkey Sylvana Istanbul - Bahcesehir
Listing Turkey Sylvana Istanbul - BahcesehirListing Turkey Sylvana Istanbul - Bahcesehir
Listing Turkey Sylvana Istanbul - Bahcesehir
 
Low Rate Call Girls in Triveni Complex Delhi Call 9873940964
Low Rate Call Girls in Triveni Complex Delhi Call 9873940964Low Rate Call Girls in Triveni Complex Delhi Call 9873940964
Low Rate Call Girls in Triveni Complex Delhi Call 9873940964
 
call girls in Shahdara (DELHI) 🔝 >༒9953330565🔝 genuine Escort Service 🔝✔️✔️
call girls in Shahdara (DELHI) 🔝 >༒9953330565🔝 genuine Escort Service 🔝✔️✔️call girls in Shahdara (DELHI) 🔝 >༒9953330565🔝 genuine Escort Service 🔝✔️✔️
call girls in Shahdara (DELHI) 🔝 >༒9953330565🔝 genuine Escort Service 🔝✔️✔️
 
Model Call Girl in Shastri Nagar Delhi reach out to us at 🔝8264348440🔝
Model Call Girl in Shastri Nagar Delhi reach out to us at 🔝8264348440🔝Model Call Girl in Shastri Nagar Delhi reach out to us at 🔝8264348440🔝
Model Call Girl in Shastri Nagar Delhi reach out to us at 🔝8264348440🔝
 
Call Girls in laxmi Nagar Delhi 💯Call Us 🔝 9582086666🔝 South Delhi Escorts Se...
Call Girls in laxmi Nagar Delhi 💯Call Us 🔝 9582086666🔝 South Delhi Escorts Se...Call Girls in laxmi Nagar Delhi 💯Call Us 🔝 9582086666🔝 South Delhi Escorts Se...
Call Girls in laxmi Nagar Delhi 💯Call Us 🔝 9582086666🔝 South Delhi Escorts Se...
 
9990771857 Call Girls in Noida Sector 34 Noida (Call Girls) Delhi
9990771857 Call Girls in Noida Sector 34 Noida (Call Girls) Delhi9990771857 Call Girls in Noida Sector 34 Noida (Call Girls) Delhi
9990771857 Call Girls in Noida Sector 34 Noida (Call Girls) Delhi
 
Call Girls in Noida Sector 11 Noida 💯Call Us 🔝 9582086666 🔝 South Delhi Escor...
Call Girls in Noida Sector 11 Noida 💯Call Us 🔝 9582086666 🔝 South Delhi Escor...Call Girls in Noida Sector 11 Noida 💯Call Us 🔝 9582086666 🔝 South Delhi Escor...
Call Girls in Noida Sector 11 Noida 💯Call Us 🔝 9582086666 🔝 South Delhi Escor...
 
Nanke Area Estate commercial ( Dir. Kat Kuo)
Nanke Area Estate commercial ( Dir. Kat Kuo)Nanke Area Estate commercial ( Dir. Kat Kuo)
Nanke Area Estate commercial ( Dir. Kat Kuo)
 
83770-87607 ۞Call Girls In Near The Park Hotel (Cp) Delhi
83770-87607 ۞Call Girls In Near The Park Hotel (Cp) Delhi83770-87607 ۞Call Girls In Near The Park Hotel (Cp) Delhi
83770-87607 ۞Call Girls In Near The Park Hotel (Cp) Delhi
 
9711199012 Call {Girls Delhi} Very Low rate Vaishali DownLoad PDF
9711199012 Call {Girls Delhi} Very Low rate Vaishali DownLoad PDF9711199012 Call {Girls Delhi} Very Low rate Vaishali DownLoad PDF
9711199012 Call {Girls Delhi} Very Low rate Vaishali DownLoad PDF
 
Call Girls In Madipur Metro Delhi꧁ +91)8447779280꧂Low Rate 2 short 2000 full ...
Call Girls In Madipur Metro Delhi꧁ +91)8447779280꧂Low Rate 2 short 2000 full ...Call Girls In Madipur Metro Delhi꧁ +91)8447779280꧂Low Rate 2 short 2000 full ...
Call Girls In Madipur Metro Delhi꧁ +91)8447779280꧂Low Rate 2 short 2000 full ...
 
Low Rate Call Girls In Madipur Slum Quarter +91)8447779280Low Rate 2 short 2...
Low Rate Call Girls In Madipur Slum Quarter  +91)8447779280Low Rate 2 short 2...Low Rate Call Girls In Madipur Slum Quarter  +91)8447779280Low Rate 2 short 2...
Low Rate Call Girls In Madipur Slum Quarter +91)8447779280Low Rate 2 short 2...
 

Sydney, Melbourne auction clearance rates and property prices

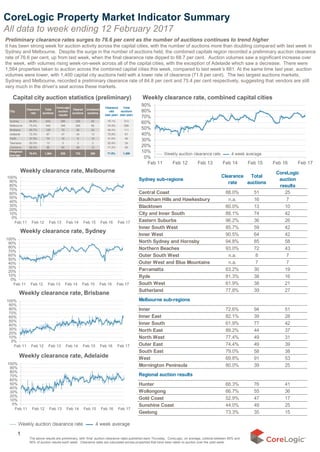
  • 1. Sydney sub-regions Clearance rate Total auctions CoreLogic auction results Central Coast 88.0% 51 25 Baulkham Hills and Hawkesbury n.a. 16 7 Blacktown 80.0% 13 10 City and Inner South 88.1% 74 42 Eastern Suburbs 96.2% 36 26 Inner South West 85.7% 59 42 Inner West 90.5% 64 42 North Sydney and Hornsby 94.8% 85 58 Northern Beaches 93.0% 72 43 Outer South West n.a. 8 7 Outer West and Blue Mountains n.a. 7 7 Parramatta 63.2% 30 19 Ryde 81.3% 38 16 South West 61.9% 38 21 Sutherland 77.8% 39 27 Melbourne sub-regions Inner 72.6% 94 51 Inner East 82.1% 39 28 Inner South 61.9% 77 42 North East 89.2% 44 37 North West 77.4% 49 31 Outer East 74.4% 49 39 South East 79.0% 58 38 West 69.8% 91 53 Mornington Peninsula 80.0% 39 25 Regional auction results Hunter 68.3% 76 41 Wollongong 66.7% 55 36 Gold Coast 52.9% 47 17 Sunshine Coast 44.0% 49 25 Geelong 73.3% 35 15 0% 10% 20% 30% 40% 50% 60% 70% 80% 90% 100% Feb 11 Feb 12 Feb 13 Feb 14 Feb 15 Feb 16 Feb 17 0% 10% 20% 30% 40% 50% 60% 70% 80% 90% 100% Feb 11 Feb 12 Feb 13 Feb 14 Feb 15 Feb 16 Feb 17 0% 10% 20% 30% 40% 50% 60% 70% 80% 90% 100% Feb 11 Feb 12 Feb 13 Feb 14 Feb 15 Feb 16 Feb 17 0% 10% 20% 30% 40% 50% 60% 70% 80% 90% 100% Feb 11 Feb 12 Feb 13 Feb 14 Feb 15 Feb 16 Feb 17 0% 10% 20% 30% 40% 50% 60% 70% 80% 90% Feb 11 Feb 12 Feb 13 Feb 14 Feb 15 Feb 16 Feb 17 City Clearance rate Total auctions CoreLogic auction results Cleared auctions Uncleared auctions Clearance rate (last year) Total auctions (last year) Sydney 84.8% 633 395 335 60 78.1% 513 Melbourne 75.4% 542 345 260 85 74.4% 556 Brisbane 65.7% 129 70 46 24 48.4% 111 Adelaide 72.3% 87 47 34 13 75.0% 91 Perth 37.5% 74 16 6 10 31.6% 46 Tasmania 60.0% 13 5 3 2 52.4% 24 Canberra 80.0% 86 60 48 12 71.2% 59 Weighted Average 76.6% 1,564 938 732 206 71.8% 1,400 Preliminary clearance rates surges to 76.6 per cent as the number of auctions continues to trend higher It has been strong week for auction activity across the capital cities, with the number of auctions more than doubling compared with last week in Sydney and Melbourne. Despite the surge in the number of auctions held, the combined capitals region recorded a preliminary auction clearance rate of 76.6 per cent, up from last week, when the final clearance rate dipped to 68.7 per cent. Auction volumes saw a significant increase over the week, with volumes rising week-on-week across all of the capital cities, with the exception of Adelaide which saw a decrease. There were 1,564 properties taken to auction across the combined capital cities this week, compared to last week’s 881. At the same time last year, auction volumes were lower, with 1,400 capital city auctions held with a lower rate of clearance (71.8 per cent). The two largest auctions markets, Sydney and Melbourne, recorded a preliminary clearance rate of 84.8 per cent and 75.4 per cent respectively, suggesting that vendors are still very much in the driver’s seat across these markets. Weekly clearance rate, Melbourne Weekly clearance rate, Adelaide Weekly clearance rate, Sydney 1 The above results are preliminary, with ‘final’ auction clearance rates published each Thursday. CoreLogic, on average, collects between 85% and 90% of auction results each week. Clearance rates are calculated across properties that have been taken to auction over the past week. CoreLogic Property Market Indicator Summary All data to week ending 12 February 2017 Capital city auction statistics (preliminary) Weekly clearance rate, combined capital cities Weekly clearance rate, Brisbane
  • 2. $786,844 $565,000 $515,000 $440,000 $515,000 $350,000 $566,250 $587,750 $675,000 $450,000 $388,000 $310,000 $429,000 $313,000 $365,000 $410,000 $0 $100,000 $200,000 $300,000 $400,000 $500,000 $600,000 $700,000 $800,000 $900,000 Sydney Melbourne Brisbane Adelaide Perth Hobart Darwin Canberra Houses Units Capital city Number of Sales Median price Number of Sales Median price Sydney 1,793 $786,844 966 $675,000 Melbourne 1,554 $565,000 663 $450,000 Brisbane 1,432 $515,000 265 $388,000 Adelaide 741 $440,000 135 $310,000 Perth 1,142 $515,000 237 $429,000 Hobart 188 $350,000 38 $313,000 Darwin 46 $566,250 14 $365,000 Canberra 138 $587,750 85 $410,000 Combined Capitals 7,034 $584,792 2,403 $519,599 HOUSES UNITS 0 10,000 20,000 30,000 40,000 50,000 Feb 10 Feb 11 Feb 12 Feb 13 Feb 14 Feb 15 Feb 16 Feb 17 Total listings New listingsCapital city No of new listings 12 mth change (%) No of total listings 12 mth change (%) Sydney 7,770 1.0% 19,267 -11.0% Melbourne 8,401 -2.0% 25,952 -7.6% Brisbane 4,458 -0.6% 19,213 5.3% Adelaide 2,127 -3.1% 8,146 0.7% Perth 4,149 -6.1% 21,860 3.6% Hobart 429 -0.5% 1,682 -33.2% Darwin 158 -26.9% 1,504 -2.7% Canberra 789 17.2% 1,950 -6.5% Combined capitals 28,281 -1.4% 99,574 -3.6% 560 580 600 620 640 660 680 700 720 740 760 780 800 820 Feb 14 Aug 14 Feb 15 Aug 15 Feb 16 Aug 16 Feb 17 Daily Index Value Capital city Weekly change Monthly change Yr to date change 12 mth change Sydney 0.9% 2.4% 2.2% 16.9% Melbourne -0.4% -0.6% 0.2% 11.4% Brisbane -0.3% 0.6% 0.2% 4.1% Adelaide 0.5% 1.5% 1.0% 5.3% Perth -1.0% 0.6% -0.9% -2.9% Combined 5 capitals 0.1% 1.0% 1.0% 10.9% 2 Results are based on the CoreLogic Daily Home Value Index. Further information and daily updates on the index results are available from http://www.corelogic.com.au/research/daily-indices.html. *Brisbane results are for the combined Brisbane and Gold Coast region. The monthly change is the change over the past 28 days. Private treaty sales represent around 85% of all dwelling sales across the country. The statistics are calculated across houses and units sold over the most recent four week period. Records without a valid sale price have been excluded from the analysis. CoreLogic Property Market Indicator Summary All data to week ending 12 February 2017 Capital city home value changes Daily home value index, 5 capital city aggregate Capital city private treaty median prices Median house and unit prices Capital city properties listed for sale Number of homes for sale, combined capital cities These results are calculated across properties that have been advertised for sale over the past 28 days. A new listing is one which has not been advertised for sale over the past 6 months, total listings include new listings and properties which have been previously advertised. To access detailed analysis of some of these key indicators on a suburb level, please log into your CoreLogic Professional system or contact us on info@corelogic.com.au. Alternatively, ring 1300 734 318 to subscribe to Market Trends
  • 3. 50 100 150 200 250 300 350 400 Feb 13 Aug 13 Feb 14 Aug 14 Feb 15 Aug 15 Feb 16 Aug 16 Feb 17 Listing Index Region Index value Month on month change Month on month change (seas adj) National 361.7 93.0% -3.2% NSW 421.0 115.6% -4.2% QLD 272.5 77.5% -2.2% SA 310.0 78.2% -5.5% TAS 154.1 96.4% -2.6% VIC 493.0 95.7% -2.6% WA 344.2 69.5% -2.4% Region Index value Month on month change Month on month change (trend) National 116.6 15.7% -8.9% NSW 153.6 20.8% -11.0% QLD 114.6 23.7% -8.9% SA 77.0 8.0% -5.5% TAS 94.7 28.7% -4.1% VIC 120.8 6.5% -8.2% WA 92.2 23.2% -9.0% 0 20 40 60 80 100 120 140 160 180 Feb 13 Aug 13 Feb 14 Aug 14 Feb 15 Aug 15 Feb 16 Aug 16 Feb 17 Mortgage Index Mortgage Index (rolling three month trend) ABS Owner Occupier housing finance commitments (monthly) -4.1% -3.6% -5.4% -5.5% -8.1% -4.7% -8.3% -2.5% -4.1% -5.1% -6.2% -6.8% -9.2% -4.9% -10.5% -2.9% -12% -11% -10% -9% -8% -7% -6% -5% -4% -3% -2% -1% 0% Sydney Melbourne Brisbane Adelaide Perth Hobart Darwin Canberra Houses Units 51days 46days 75days 69days 89days 48days 102days 55days 52days 62days 92days 71days 97days 43days 118days 67days days 10 days 20 days 30 days 40 days 50 days 60 days 70 days 80 days 90 days 100 days 110 days 120 days Sydney Melbourne Brisbane Adelaide Perth Hobart Darwin Canberra Houses UnitsCapital city Median TOM Avg Vendor Disc. Median TOM Avg Vendor Disc. Sydney 51 days -4.1% 52 days -4.1% Melbourne 46 days -3.6% 62 days -5.1% Brisbane 75 days -5.4% 92 days -6.2% Adelaide 69 days -5.5% 71 days -6.8% Perth 89 days -8.1% 97 days -9.2% Hobart 48 days -4.7% 43 days -4.9% Darwin 102 days -8.3% 118 days -10.5% Canberra 55 days -2.5% 67 days -2.9% HOUSES UNITS ‘Time on market’ (TOM) is simply the middle number of days between when a property is first listed for sale and the contract date. The rate of vendor discounting is the average percentage difference between the original listing price and the final selling price. The statistics are calculated across results received by CoreLogic over the past week and include properties transacted over the past four weeks. The data is based on private treaty sales only and records without a valid sale price have been excluded from the vendor discount analysis. The analysis also excludes results where there are less than 10 observations. 3 CoreLogic systems monitor more than 100,000 mortgage activity events every month across our 4 main finance industry platforms. Monitoring the activity events across this platform provides a unique and timely lead indicator to housing finance commitments. The index shows an 81% correlation with the ABS housing finance data series (88% using the seasonally adjusted series). Based on the strong correlation and significant number of events being monitored, the Mortgage Index provides the most timely and holistic measure of mortgage market activity available. The CoreLogic Listings Index provides a lead indicator for the number of residential dwellings that are being prepared for sale across the Australian housing market. CoreLogic customers account for over 70% of all listings in the Australian property market. The index, which tracks the flow of metadata across CoreLogic’s real estate data platform, shows a 75% correlation with the number of new listings about to enter the market. Capital city median time on market and average vendor discounting results Median time on market Average vendor discounting Mortgage market activity CoreLogic Mortgage Index Listing market activity CoreLogic Listing Index CoreLogic Property Market Indicator Summary All data to week ending 12 February 2017 To access detailed analysis of some of these key indicators on a suburb level, please log into your CoreLogic Professional system or contact us on info@corelogic.com.au. Alternatively, ring 1300 734 318 to subscribe to Market Trends
  • 4. 4 CoreLogic Property Market Indicator Summary All data to week ending 12 February 2017 To access detailed analysis of some of these key indicators on a suburb level, please log into your CoreLogic Professional system or contact us on info@corelogic.com.au. Alternatively, ring 1300 734 318 to subscribe to Market Trends Top two sales over the past week, states and territories 69 Mackenzie St, Hackett, ACT 5 Bed, 3 Bath, 2 Car house $1,246,000 One Agency Crane Properties Gungahlin 35 The Point Rd, Woolwich, NSW 4 Bed, 4 Bath, 4 Car house $6,680,000 McGrath Estate Agents 151 Woods Tce, Braitling, NT 4 Bed, 2 Bath, 7 Car house $550,000 Elders Alice Springs 32 Ivy St, Indooroopilly, Qld 5 Bed, 5 Bath, 5 Car house $3,250,000 McGrath Estate Agents 60 Galore St, Crace, ACT 4 Bed, 3 Bath, 2 Car $1,175,000 McGrath Estate Agents 79A Fletcher St, Tamarama, NSW 4 Bed, 3 Bath, 2 Car house $4,775,000 Phillips Pantzer Donnelley Woollahra 4 Mayhew Cres, Jingili, NT 3 Bed, 1 Bath, 2 Car house $530,000 Home Zone NT Darwin 4 Garrick St, Coolangatta, Qld 4 Bed, 4 Bath, 4 Car house $2,370,000 McGrath Estate Agents Australian Capital Territory New South Wales Northern Territory Queensland
  • 5. 5 CoreLogic Property Market Indicator Summary All data to week ending 12 February 2017 To access detailed analysis of some of these key indicators on a suburb level, please log into your CoreLogic Professional system or contact us on info@corelogic.com.au. Alternatively, ring 1300 734 318 to subscribe to Market Trends Top two sales over the past week, states and territories 397 Esplanade, Henley Beach, SA 3 Bed, 2 Bath, 4 Car house $2,170,000 Bruse Real Estate 5 Derwentwater Ave, Sandy Bay, Tas 4 Bed, 2 Bath, 4 Car house $1,050,000 Harcourts Hobart 200 South Rd, Brighton East, Vic 4 Bed, 1 Bath, 1 Car house $1,920,000 Nick Johnstone Real Estate Brighton 4/62 Marine Pde, Cottesloe, WA 3 Bed, 3 Bath, 2 Car house $3,350,000 Shellabears Cottesloe 35 Star And Arrow Rd, Cherry Gardens, SA 6 Bed, 2 Bath, 14 Car house $1,300,000 Lauraine Burrowes Real Estate Hahndorf 321 Brightwater Rd, Howden, Tas 4 Bed, 2 Bath, 7 Car house $868,000 Harcourts Kingborough Kingston 80 Alfrieda St, St Albans, Vic 3 Bed, 2 Bath, 2 Car house $1,810,000 Ray White St Albans 10 The Lane , Churchlands, WA 4 Bed, 2 Bath, 2 Car house $1,260,000 LJ Hooker Claremont South Australia Tasmania Victoria Western Australia
  • 6. 6 About CoreLogic CoreLogic Australia is a wholly owned subsidiary of CoreLogic (NYSE: CLGX), which is the largest property data and analytics company in the world. CoreLogic provides property information, analytics and services across Australia, New Zealand and Asia, and recently expanded its service offering through the purchase of project activity and building cost information provider Cordell. With Australia’s most comprehensive property databases, the company’s combined data offering is derived from public, contributory and proprietary sources and includes over 500 million decision points spanning over three decades of collection, providing detailed coverage of property and other encumbrances such as tenancy, location, hazard risk and related performance information. With over 20,000 customers and 150,000 end users, CoreLogic is the leading provider of property data, analytics and related services to consumers, investors, real estate, mortgage, finance, banking, building services, insurance, developers, wealth management and government. CoreLogic delivers value to clients through unique data, analytics, workflow technology, advisory and geo spatial services. Clients rely on CoreLogic to help identify and manage growth opportunities, improve performance and mitigate risk. CoreLogic employs over 650 people across Australia and in New Zealand. For more information call 1300 734 318 or visit www.corelogic.com.au Disclaimers In compiling this publication, RP Data Pty Ltd trading as CoreLogic has relied upon information supplied by a number of external sources. CoreLogic does not warrant its accuracy or completeness and to the full extent allowed by law excludes liability in contract, tort or otherwise, for any loss or damage sustained by subscribers, or by any other person or body corporate arising from or in connection with the supply or use of the whole or any part of the information in this publication through any cause whatsoever and limits any liability it may have to the amount paid to CoreLogic for the supply of such information. Queensland Data Based on or contains data provided by the State of Queensland (Department of Natural Resources and Mines) 2017. In consideration of the State permitting use of this data you acknowledge and agree that the State gives no warranty in relation to the data (including accuracy, reliability, completeness, currency or suitability) and accepts no liability (including without limitation, liability in negligence) for any loss, damage or costs (including consequential damage) relating to any use of the data. Data must not be used for direct marketing or be used in breach of the privacy laws. South Australian Data This information is based on data supplied by the South Australian Government and is published by permission. The South Australian Government does not accept any responsibility for the accuracy or completeness of the published information or suitability for any purpose of the published information or the underlying data. New South Wales Data Contains property sales information provided under licence from the Land and Property Information (“LPI”). CoreLogic is authorised as a Property Sales Information provider by the LPI. Victorian Data The State of Victoria owns the copyright in the Property Sales Data which constitutes the basis of this report and reproduction of that data in any way without the consent of the State of Victoria will constitute a breach of the Copyright Act 1968 (Cth). The State of Victoria does not warrant the accuracy or completeness of the information contained in this report and any person using or relying upon such information does so on the basis that the State of Victoria accepts no responsibility or liability whatsoever for any errors, faults, defects or omissions in the information supplied. Western Australian Data Based on information provided by and with the permission of the Western Australian Land Information Authority (2017) trading as Landgate. Australian Capital Territory Data The Territory Data is the property of the Australian Capital Territory. No part of it may in any form or by any means (electronic, mechanical, microcopying, photocopying, recording or otherwise) be reproduced, stored in a retrieval system or transmitted without prior written permission. Enquiries should be directed to: Director, Customer Services ACT Planning and Land Authority GPO Box 1908 Canberra ACT 2601. Tasmanian Data This product incorporates data that is copyright owned by the Crown in Right of Tasmania. The data has been used in the product with the permission of the Crown in Right of Tasmania. The Crown in Right of Tasmania and its employees and agents: a) give no warranty regarding the data's accuracy, completeness, currency or suitability for any particular purpose; and b) do not accept liability howsoever arising, including but not limited to negligence for any loss resulting from the use of or reliance upon the data. Base data from the LIST © State of Tasmania http://www.thelist.tas.gov.au CoreLogic Property Market Indicator Summary All data to week ending 12 February 2017 To access detailed analysis of some of these key indicators on a suburb level, please log into your CoreLogic Professional system or contact us on info@corelogic.com.au. Alternatively, ring 1300 734 318 to subscribe to Market Trends