
Recommended
Recommended
More Related Content
What's hot
What's hot (19)
Viewers also liked
Viewers also liked (18)
Similar to Weekly market update week ending 2017 february 19
Similar to Weekly market update week ending 2017 february 19 (20)
Recently uploaded
Recently uploaded (20)
Weekly market update week ending 2017 february 19
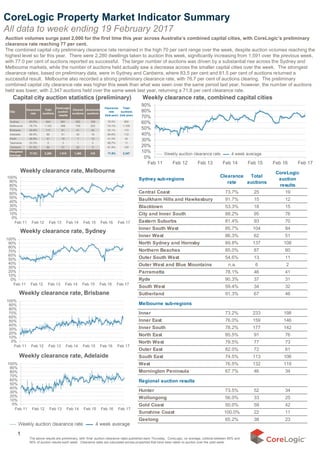
- 1. Sydney sub-regions Clearance rate Total auctions CoreLogic auction results Central Coast 73.7% 25 19 Baulkham Hills and Hawkesbury 91.7% 15 12 Blacktown 53.3% 18 15 City and Inner South 88.2% 95 76 Eastern Suburbs 81.4% 93 70 Inner South West 85.7% 104 84 Inner West 86.3% 62 51 North Sydney and Hornsby 89.8% 137 108 Northern Beaches 85.0% 87 60 Outer South West 54.6% 13 11 Outer West and Blue Mountains n.a. 6 2 Parramatta 78.1% 46 41 Ryde 90.3% 37 31 South West 59.4% 34 32 Sutherland 91.3% 67 46 Melbourne sub-regions Inner 73.2% 233 198 Inner East 76.0% 159 146 Inner South 78.2% 177 142 North East 85.5% 91 76 North West 79.5% 77 73 Outer East 82.0% 72 61 South East 74.5% 113 106 West 76.5% 132 119 Mornington Peninsula 67.7% 46 34 Regional auction results Hunter 73.5% 52 34 Wollongong 56.0% 33 25 Gold Coast 50.0% 59 42 Sunshine Coast 100.0% 22 11 Geelong 65.2% 38 23 0% 10% 20% 30% 40% 50% 60% 70% 80% 90% 100% Feb 11 Feb 12 Feb 13 Feb 14 Feb 15 Feb 16 Feb 17 0% 10% 20% 30% 40% 50% 60% 70% 80% 90% 100% Feb 11 Feb 12 Feb 13 Feb 14 Feb 15 Feb 16 Feb 17 0% 10% 20% 30% 40% 50% 60% 70% 80% 90% 100% Feb 11 Feb 12 Feb 13 Feb 14 Feb 15 Feb 16 Feb 17 0% 10% 20% 30% 40% 50% 60% 70% 80% 90% 100% Feb 11 Feb 12 Feb 13 Feb 14 Feb 15 Feb 16 Feb 17 0% 10% 20% 30% 40% 50% 60% 70% 80% 90% Feb 11 Feb 12 Feb 13 Feb 14 Feb 15 Feb 16 Feb 17 City Clearance rate Total auctions CoreLogic auction results Cleared auctions Uncleared auctions Clearance rate (last year) Total auctions (last year) Sydney 83.5% 844 661 552 109 76.5% 800 Melbourne 76.7% 1,103 958 735 223 74.1% 1,105 Brisbane 50.6% 117 81 41 40 53.1% 172 Adelaide 68.9% 86 61 42 19 64.6% 112 Perth 36.8% 41 19 7 12 41.0% 42 Tasmania 33.3% 5 3 1 2 85.7% 11 Canberra 81.5% 84 27 22 5 61.9% 105 Weighted Average 77.0% 2,280 1,810 1,400 410 71.8% 2,347 Auction volumes surge past 2,000 for the first time this year across Australia’s combined capital cities, with CoreLogic’s preliminary clearance rate reaching 77 per cent. The combined capital city preliminary clearance rate remained in the high 70 per cent range over the week, despite auction volumes reaching the highest level so far this year. There were 2,280 dwellings taken to auction this week, significantly increasing from 1,591 over the previous week, with 77.0 per cent of auctions reported as successful. The larger number of auctions was driven by a substantial rise across the Sydney and Melbourne markets, while the number of auctions held actually saw a decrease across the smaller capital cities over the week. The strongest clearance rates, based on preliminary data, were in Sydney and Canberra, where 83.5 per cent and 81.5 per cent of auctions returned a successful result. Melbourne also recorded a strong preliminary clearance rate, with 76.7 per cent of auctions clearing. The preliminary combined capital city clearance rate was higher this week than what was seen over the same period last year, however, the number of auctions held was lower, with 2,347 auctions held over the same week last year, returning a 71.8 per cent clearance rate. Weekly clearance rate, Melbourne Weekly clearance rate, Adelaide Weekly clearance rate, Sydney 1 The above results are preliminary, with ‘final’ auction clearance rates published each Thursday. CoreLogic, on average, collects between 85% and 90% of auction results each week. Clearance rates are calculated across properties that have been taken to auction over the past week. CoreLogic Property Market Indicator Summary All data to week ending 19 February 2017 Capital city auction statistics (preliminary) Weekly clearance rate, combined capital cities Weekly clearance rate, Brisbane
- 2. $818,000 $590,000 $515,000 $440,000 $516,000 $362,500 $565,000 $600,500 $698,525 $465,000 $387,000 $315,000 $434,250 $310,000 $372,500 $400,000 $0 $100,000 $200,000 $300,000 $400,000 $500,000 $600,000 $700,000 $800,000 $900,000 Sydney Melbourne Brisbane Adelaide Perth Hobart Darwin Canberra Houses Units Capital city Number of Sales Median price Number of Sales Median price Sydney 2,243 $818,000 1,232 $698,525 Melbourne 1,836 $590,000 852 $465,000 Brisbane 1,390 $515,000 275 $387,000 Adelaide 696 $440,000 147 $315,000 Perth 1,148 $516,000 250 $434,250 Hobart 174 $362,500 34 $310,000 Darwin 45 $565,000 24 $372,500 Canberra 186 $600,500 96 $400,000 Combined Capitals 7,718 $613,198 2,910 $541,559 HOUSES UNITS 0 20,000 40,000 60,000 80,000 100,000 120,000 140,000 160,000 Feb 10 Feb 11 Feb 12 Feb 13 Feb 14 Feb 15 Feb 16 Feb 17 Total listings New listingsCapital city No of new listings 12 mth change (%) No of total listings 12 mth change (%) Sydney 7,850 -3.2% 19,774 -12.3% Melbourne 8,590 -4.0% 26,749 -7.4% Brisbane 4,616 -2.3% 19,533 4.3% Adelaide 2,151 -4.2% 8,094 -2.2% Perth 4,023 -10.5% 21,399 -0.6% Hobart 443 -0.9% 1,669 -35.4% Darwin 166 -28.4% 1,516 -3.9% Canberra 822 20.5% 2,031 -8.5% Combined capitals 28,661 -4.1% 100,765 -5.2% 560 580 600 620 640 660 680 700 720 740 760 780 800 820 Feb 14 Aug 14 Feb 15 Aug 15 Feb 16 Aug 16 Feb 17 Daily Index Value Capital city Weekly change Monthly change Yr to date change 12 mth change Sydney 0.6% 2.6% 2.8% 17.4% Melbourne 0.3% -0.4% 0.6% 11.7% Brisbane 0.2% 1.3% 0.4% 4.2% Adelaide -0.3% -0.1% 0.8% 4.2% Perth -0.8% -1.0% -1.7% -3.3% Combined 5 capitals 0.3% 1.1% 1.3% 11.2% 2 Results are based on the CoreLogic Daily Home Value Index. Further information and daily updates on the index results are available from http://www.corelogic.com.au/research/daily-indices.html. *Brisbane results are for the combined Brisbane and Gold Coast region. The monthly change is the change over the past 28 days. Private treaty sales represent around 85% of all dwelling sales across the country. The statistics are calculated across houses and units sold over the most recent four week period. Records without a valid sale price have been excluded from the analysis. CoreLogic Property Market Indicator Summary All data to week ending 19 February 2017 Capital city home value changes Daily home value index, 5 capital city aggregate Capital city private treaty median prices Median house and unit prices Capital city properties listed for sale Number of homes for sale, combined capital cities These results are calculated across properties that have been advertised for sale over the past 28 days. A new listing is one which has not been advertised for sale over the past 6 months, total listings include new listings and properties which have been previously advertised. To access detailed analysis of some of these key indicators on a suburb level, please log into your CoreLogic Professional system or contact us on info@corelogic.com.au. Alternatively, ring 1300 734 318 to subscribe to Market Trends
- 3. -4.2% -3.5% -5.1% -5.3% -7.8% -4.6% -7.5% -2.8% -4.0% -5.1% -6.2% -6.1% -8.8% -2.9% -10.9% -3.2% -12% -11% -10% -9% -8% -7% -6% -5% -4% -3% -2% -1% 0% Sydney Melbourne Brisbane Adelaide Perth Hobart Darwin Canberra Houses Units 37days 36days 72days 68days 90days 44days 98days 33days 34days 56days 91days 70days 93days 38days 115days 72days days 10 days 20 days 30 days 40 days 50 days 60 days 70 days 80 days 90 days 100 days 110 days 120 days Sydney Melbourne Brisbane Adelaide Perth Hobart Darwin Canberra Houses UnitsCapital city Median TOM Avg Vendor Disc. Median TOM Avg Vendor Disc. Sydney 37 days -4.2% 34 days -4.0% Melbourne 36 days -3.5% 56 days -5.1% Brisbane 72 days -5.1% 91 days -6.2% Adelaide 68 days -5.3% 70 days -6.1% Perth 90 days -7.8% 93 days -8.8% Hobart 44 days -4.6% 38 days -2.9% Darwin 98 days -7.5% 115 days -10.9% Canberra 33 days -2.8% 72 days -3.2% HOUSES UNITS 50 100 150 200 250 300 350 400 Feb 13 Aug 13 Feb 14 Aug 14 Feb 15 Aug 15 Feb 16 Aug 16 Feb 17 Listing Index Region Index value Month on month change Month on month change (seas adj) National 365.3 53.3% 0.9% NSW 423.4 63.4% 0.4% QLD 275.2 45.2% 1.4% SA 311.7 43.6% -2.4% TAS 145.6 43.6% -0.7% VIC 508.3 59.9% 2.3% WA 339.8 34.9% 0.9% 0 20 40 60 80 100 120 140 160 180 Feb 13 Aug 13 Feb 14 Aug 14 Feb 15 Aug 15 Feb 16 Aug 16 Feb 17 Mortgage Index Mortgage Index (rolling three month trend) ABS Owner Occupier housing finance commitments (monthly) Region Index value Month on month change Month on month change (trend) National 123.1 34.9% -8.6% NSW 163.0 42.7% -10.7% QLD 120.0 39.4% -8.3% SA 81.1 28.2% -5.5% TAS 94.5 34.2% -2.9% VIC 128.8 26.9% -8.0% WA 95.6 33.4% -8.5% ‘Time on market’ (TOM) is simply the middle number of days between when a property is first listed for sale and the contract date. The rate of vendor discounting is the average percentage difference between the original listing price and the final selling price. The statistics are calculated across results received by CoreLogic over the past week and include properties transacted over the past four weeks. The data is based on private treaty sales only and records without a valid sale price have been excluded from the vendor discount analysis. The analysis also excludes results where there are less than 10 observations. 3 CoreLogic systems monitor more than 100,000 mortgage activity events every month across our 4 main finance industry platforms. Monitoring the activity events across this platform provides a unique and timely lead indicator to housing finance commitments. The index shows an 81% correlation with the ABS housing finance data series (88% using the seasonally adjusted series). Based on the strong correlation and significant number of events being monitored, the Mortgage Index provides the most timely and holistic measure of mortgage market activity available. The CoreLogic Listings Index provides a lead indicator for the number of residential dwellings that are being prepared for sale across the Australian housing market. CoreLogic customers account for over 70% of all listings in the Australian property market. The index, which tracks the flow of metadata across CoreLogic’s real estate data platform, shows a 75% correlation with the number of new listings about to enter the market. Capital city median time on market and average vendor discounting results Median time on market Average vendor discounting Mortgage market activity CoreLogic Mortgage Index Listing market activity CoreLogic Listing Index CoreLogic Property Market Indicator Summary All data to week ending 19 February 2017 To access detailed analysis of some of these key indicators on a suburb level, please log into your CoreLogic Professional system or contact us on info@corelogic.com.au. Alternatively, ring 1300 734 318 to subscribe to Market Trends
- 4. 4 CoreLogic Property Market Indicator Summary All data to week ending 19 February 2017 To access detailed analysis of some of these key indicators on a suburb level, please log into your CoreLogic Professional system or contact us on info@corelogic.com.au. Alternatively, ring 1300 734 318 to subscribe to Market Trends Top two sales over the past week, states and territories 14 Geerilong Garden, Reid, ACT 4 Bed, 2 Bath, 2 Car house $1,810,000 Luton Properties Canberra City 47 Stanley Street, Chatswood, NSW 5 Bed, 2 Bath, 4 Car house $4,955,000 LJ Hooker Willoughby 4 Phoenix Street, Nightcliff, NT 4 Bed, 2 Bath, 2 Car house $920,000 Territory Real Estate Darwin 12 Clear Water Bay Avenue, Clear Island Waters, Qld 7 Bed, 5 Bath, 2 Car house $2,450,000 Ray White Broadbeach 30 Mueller Street, Yarralumla, ACT 4 Bed, 3 Bath, 2 Car $1,700,000 Cream Residential Hughes 2/1a Lavender Crescent, Lavender Bay, NSW 3 Bed, 2 Bath, 2 Car unit $4,400,000 Belle Property Neutral Bay 194 Hutchison Road, Herbert, NT 5 Bed, 2 Bath, 2 Car house $775,000 Raine & Horne Darwin 29 Daventry Street, West End, Qld 4 Bed, 3 Bath, 4 Car house $2,030,000 Drakos Real Estate West End Australian Capital Territory New South Wales Northern Territory Queensland
- 5. 5 CoreLogic Property Market Indicator Summary All data to week ending 19 February 2017 To access detailed analysis of some of these key indicators on a suburb level, please log into your CoreLogic Professional system or contact us on info@corelogic.com.au. Alternatively, ring 1300 734 318 to subscribe to Market Trends Top two sales over the past week, states and territories 19 Avenue Street, Millswood, SA 6 Bed, 2 Bath, 2 Car house $2,210,000 Harcourts Luxury Property 25 Fitzroy Place, Sandy Bay, Tas 7 Bed, 5 Bath, 1 Car house $1,467,500 Knight Frank Hobart 4 Victoria Avenue, Canterbury, Vic 4 Bed, 3 Bath, 3 Car house $4,200,000 Jellis Craig Boroondara Group 11 Alness Street, Applecross, WA 3 Bed, 1 Bath house $1,525,000 Vitale Fine Properties Perppermint Grove 89 Grant Avenue, Toorak Gardens, SA 4 Bed, 2 Bath, 2 Car house $1,410,000 Klemich Real Estate 10 Ellington Road, Sandy Bay, Tas 4 Bed, 2 Bath, 3 Car house $1,240,000 LJ Hooker Hobart 3 Huntingfield Road, Brighton, Vic 4 Bed, 3 Bath, 6 Car house $4,000,000 Nick Johnstone Real Estate Brighton 8 Egretta Drive, Waterford, WA 5 Bed, 3 Bath, 2 Car house $1,410,000 RE/MAX Southern Stars Cannington South Australia Tasmania Victoria Western Australia
- 6. 6 About CoreLogic CoreLogic Australia is a wholly owned subsidiary of CoreLogic (NYSE: CLGX), which is the largest property data and analytics company in the world. CoreLogic provides property information, analytics and services across Australia, New Zealand and Asia, and recently expanded its service offering through the purchase of project activity and building cost information provider Cordell. With Australia’s most comprehensive property databases, the company’s combined data offering is derived from public, contributory and proprietary sources and includes over 500 million decision points spanning over three decades of collection, providing detailed coverage of property and other encumbrances such as tenancy, location, hazard risk and related performance information. With over 20,000 customers and 150,000 end users, CoreLogic is the leading provider of property data, analytics and related services to consumers, investors, real estate, mortgage, finance, banking, building services, insurance, developers, wealth management and government. CoreLogic delivers value to clients through unique data, analytics, workflow technology, advisory and geo spatial services. Clients rely on CoreLogic to help identify and manage growth opportunities, improve performance and mitigate risk. CoreLogic employs over 650 people across Australia and in New Zealand. For more information call 1300 734 318 or visit www.corelogic.com.au Disclaimers In compiling this publication, RP Data Pty Ltd trading as CoreLogic has relied upon information supplied by a number of external sources. CoreLogic does not warrant its accuracy or completeness and to the full extent allowed by law excludes liability in contract, tort or otherwise, for any loss or damage sustained by subscribers, or by any other person or body corporate arising from or in connection with the supply or use of the whole or any part of the information in this publication through any cause whatsoever and limits any liability it may have to the amount paid to CoreLogic for the supply of such information. Queensland Data Based on or contains data provided by the State of Queensland (Department of Natural Resources and Mines) 2017. In consideration of the State permitting use of this data you acknowledge and agree that the State gives no warranty in relation to the data (including accuracy, reliability, completeness, currency or suitability) and accepts no liability (including without limitation, liability in negligence) for any loss, damage or costs (including consequential damage) relating to any use of the data. Data must not be used for direct marketing or be used in breach of the privacy laws. South Australian Data This information is based on data supplied by the South Australian Government and is published by permission. The South Australian Government does not accept any responsibility for the accuracy or completeness of the published information or suitability for any purpose of the published information or the underlying data. New South Wales Data Contains property sales information provided under licence from the Land and Property Information (“LPI”). CoreLogic is authorised as a Property Sales Information provider by the LPI. Victorian Data The State of Victoria owns the copyright in the Property Sales Data which constitutes the basis of this report and reproduction of that data in any way without the consent of the State of Victoria will constitute a breach of the Copyright Act 1968 (Cth). The State of Victoria does not warrant the accuracy or completeness of the information contained in this report and any person using or relying upon such information does so on the basis that the State of Victoria accepts no responsibility or liability whatsoever for any errors, faults, defects or omissions in the information supplied. Western Australian Data Based on information provided by and with the permission of the Western Australian Land Information Authority (2017) trading as Landgate. Australian Capital Territory Data The Territory Data is the property of the Australian Capital Territory. No part of it may in any form or by any means (electronic, mechanical, microcopying, photocopying, recording or otherwise) be reproduced, stored in a retrieval system or transmitted without prior written permission. Enquiries should be directed to: Director, Customer Services ACT Planning and Land Authority GPO Box 1908 Canberra ACT 2601. Tasmanian Data This product incorporates data that is copyright owned by the Crown in Right of Tasmania. The data has been used in the product with the permission of the Crown in Right of Tasmania. The Crown in Right of Tasmania and its employees and agents: a) give no warranty regarding the data's accuracy, completeness, currency or suitability for any particular purpose; and b) do not accept liability howsoever arising, including but not limited to negligence for any loss resulting from the use of or reliance upon the data. Base data from the LIST © State of Tasmania http://www.thelist.tas.gov.au CoreLogic Property Market Indicator Summary All data to week ending 19 February 2017 To access detailed analysis of some of these key indicators on a suburb level, please log into your CoreLogic Professional system or contact us on info@corelogic.com.au. Alternatively, ring 1300 734 318 to subscribe to Market Trends