
Recommended
More Related Content
What's hot
What's hot (20)
Similar to Open source historian
Similar to Open source historian (20)
Recently uploaded
Recently uploaded (20)
Open source historian
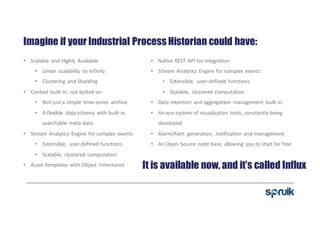
- 1. Imagine if your Industrial Process Historian could have: • Scalable and Highly Available • Linear scalability to infinity • Clustering and Sharding • Context built-in, not bolted on • Not just a simple time-series archive • A flexible data schema with built-in, searchable meta-data • Stream Analytics Engine for complex events • Extensible, user-defined functions • Scalable, clustered computation • Asset Templates with Object Inheritance • Native REST API for integration • Stream Analytics Engine for complex events • Extensible, user-defined functions • Scalable, clustered computation • Data retention and aggregation management built in • An eco-system of visualization tools, constantly being developed • Alarm/Alert generation, notification and management • An Open-Source code base, allowing you to start for free It is available now, and it’s called Influx
- 3. Visualization Tools ChronografGrafanaSeeq • Seeq – For Process Engineers (www.seeq.com) • Next-gen time-series analysis tool • Simple Machine-Learning, Pattern recognition, and predictive modelling • Connectors for InfluxDB and OSI Pi, allowing staged migration • Grafana (grafana.com) • An open ecosystem of visualization tools • Connectors to many modern data tools • Chronograf • Influx Native visualization • System Admin
- 4. Spruik can get you started • Decades of experience with traditional Industrial Process Historians including: • OSI Pi • Wonderware • Ignition • Value Added Reseller of Seeq software • Authorized systems integrator for Influx application • Many applications require no software licences • Non-clustered applications up to 100,000 tags • OEE, SPC, Real-time Dashboards • Commercial extensions available • Software support • Clustering – for very large systems (Tested at 1 Billion tags) • Seeq Process Analytics Software • To find out more, contact me geoff.nunan@spruiktec.com