Download to read offline


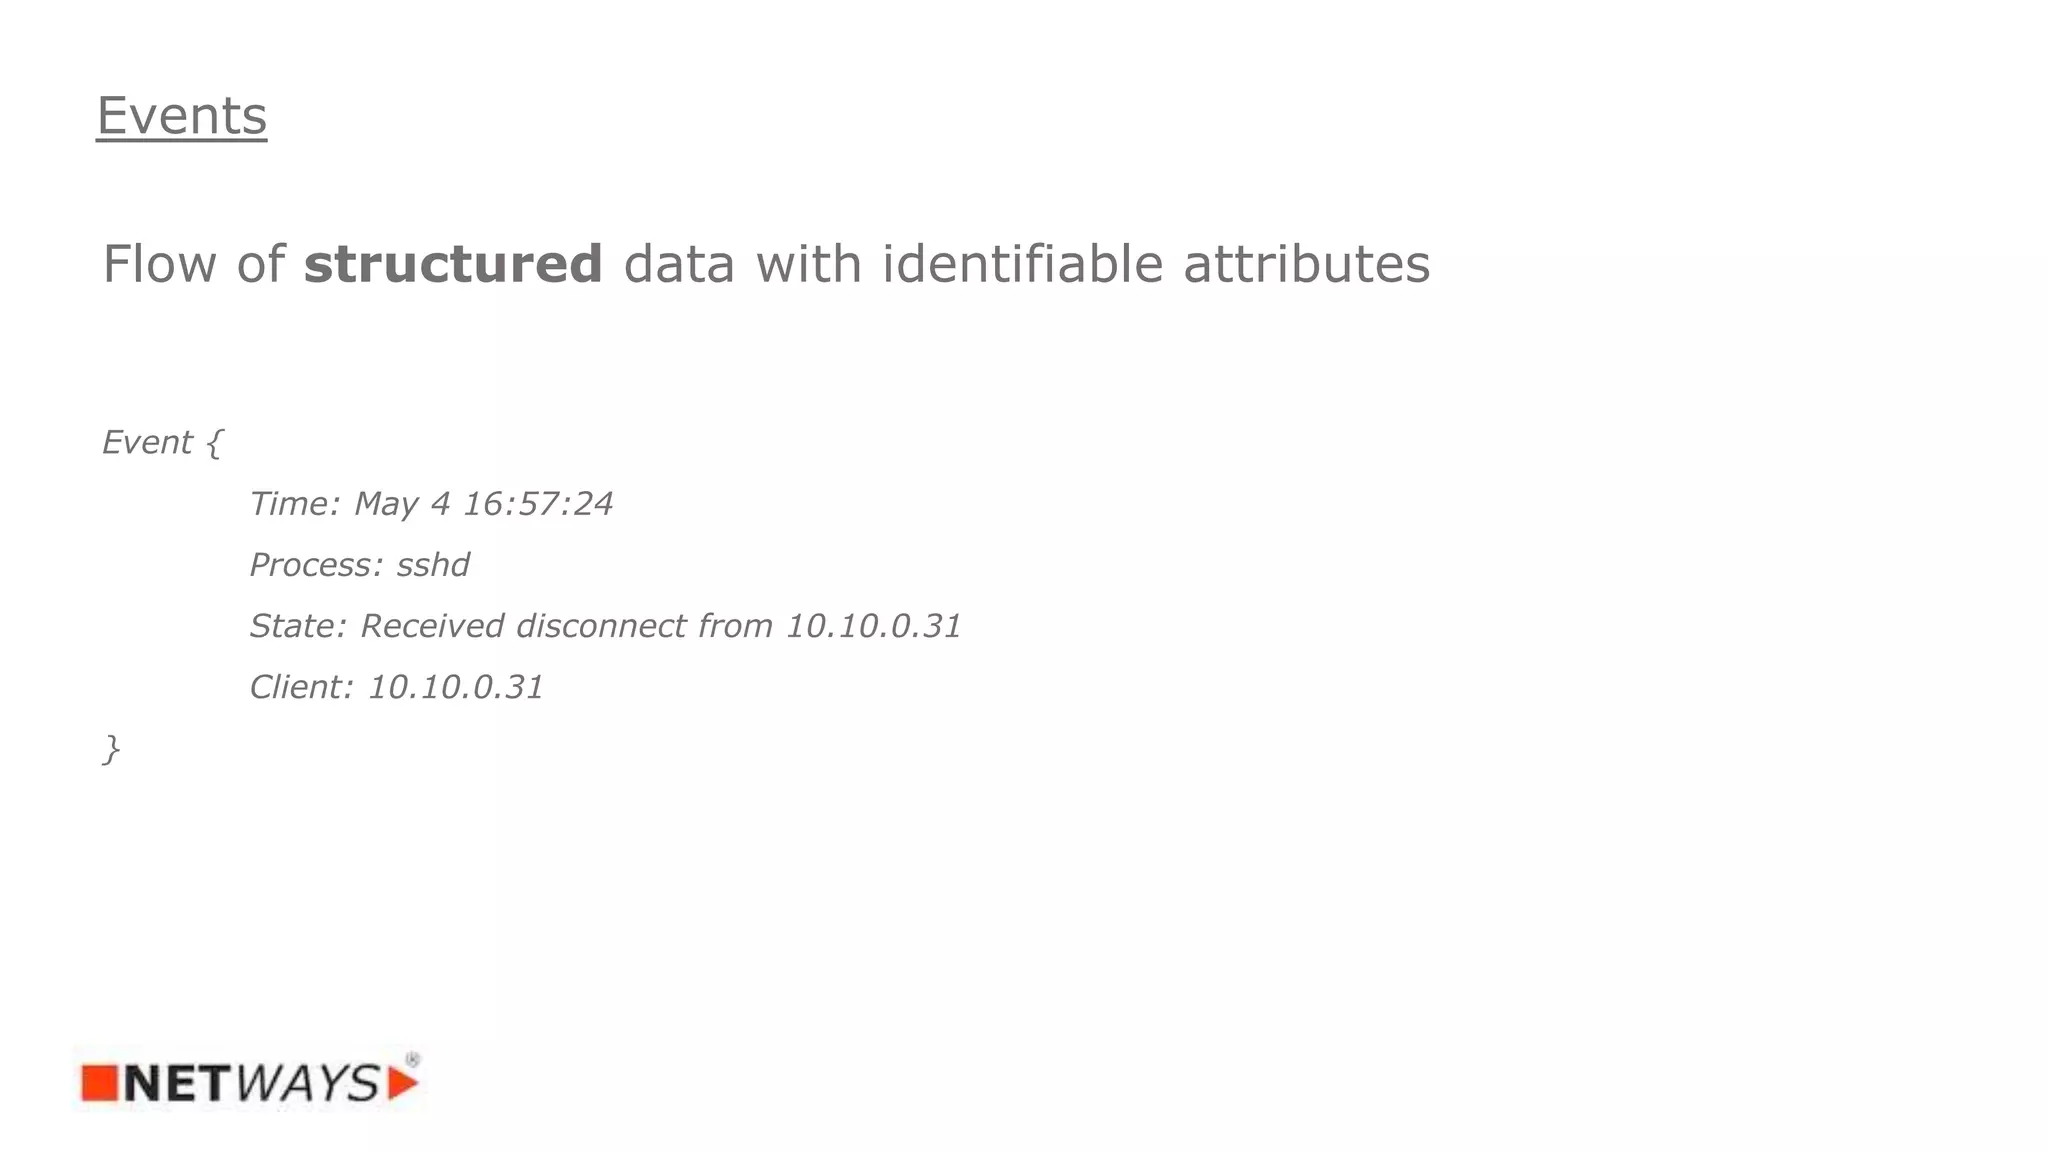
![Flow of unstructured data with timestamp and message
May 4 16:57:24 web sshd[25828]: Received disconnect from 10.10.0.31: 11: disconnected by user
Logs](https://image.slidesharecdn.com/rootconf2017monitoringlandscape-170511051149/75/Rootconf-2017-State-of-the-Open-Source-monitoring-landscape-50-2048.jpg)


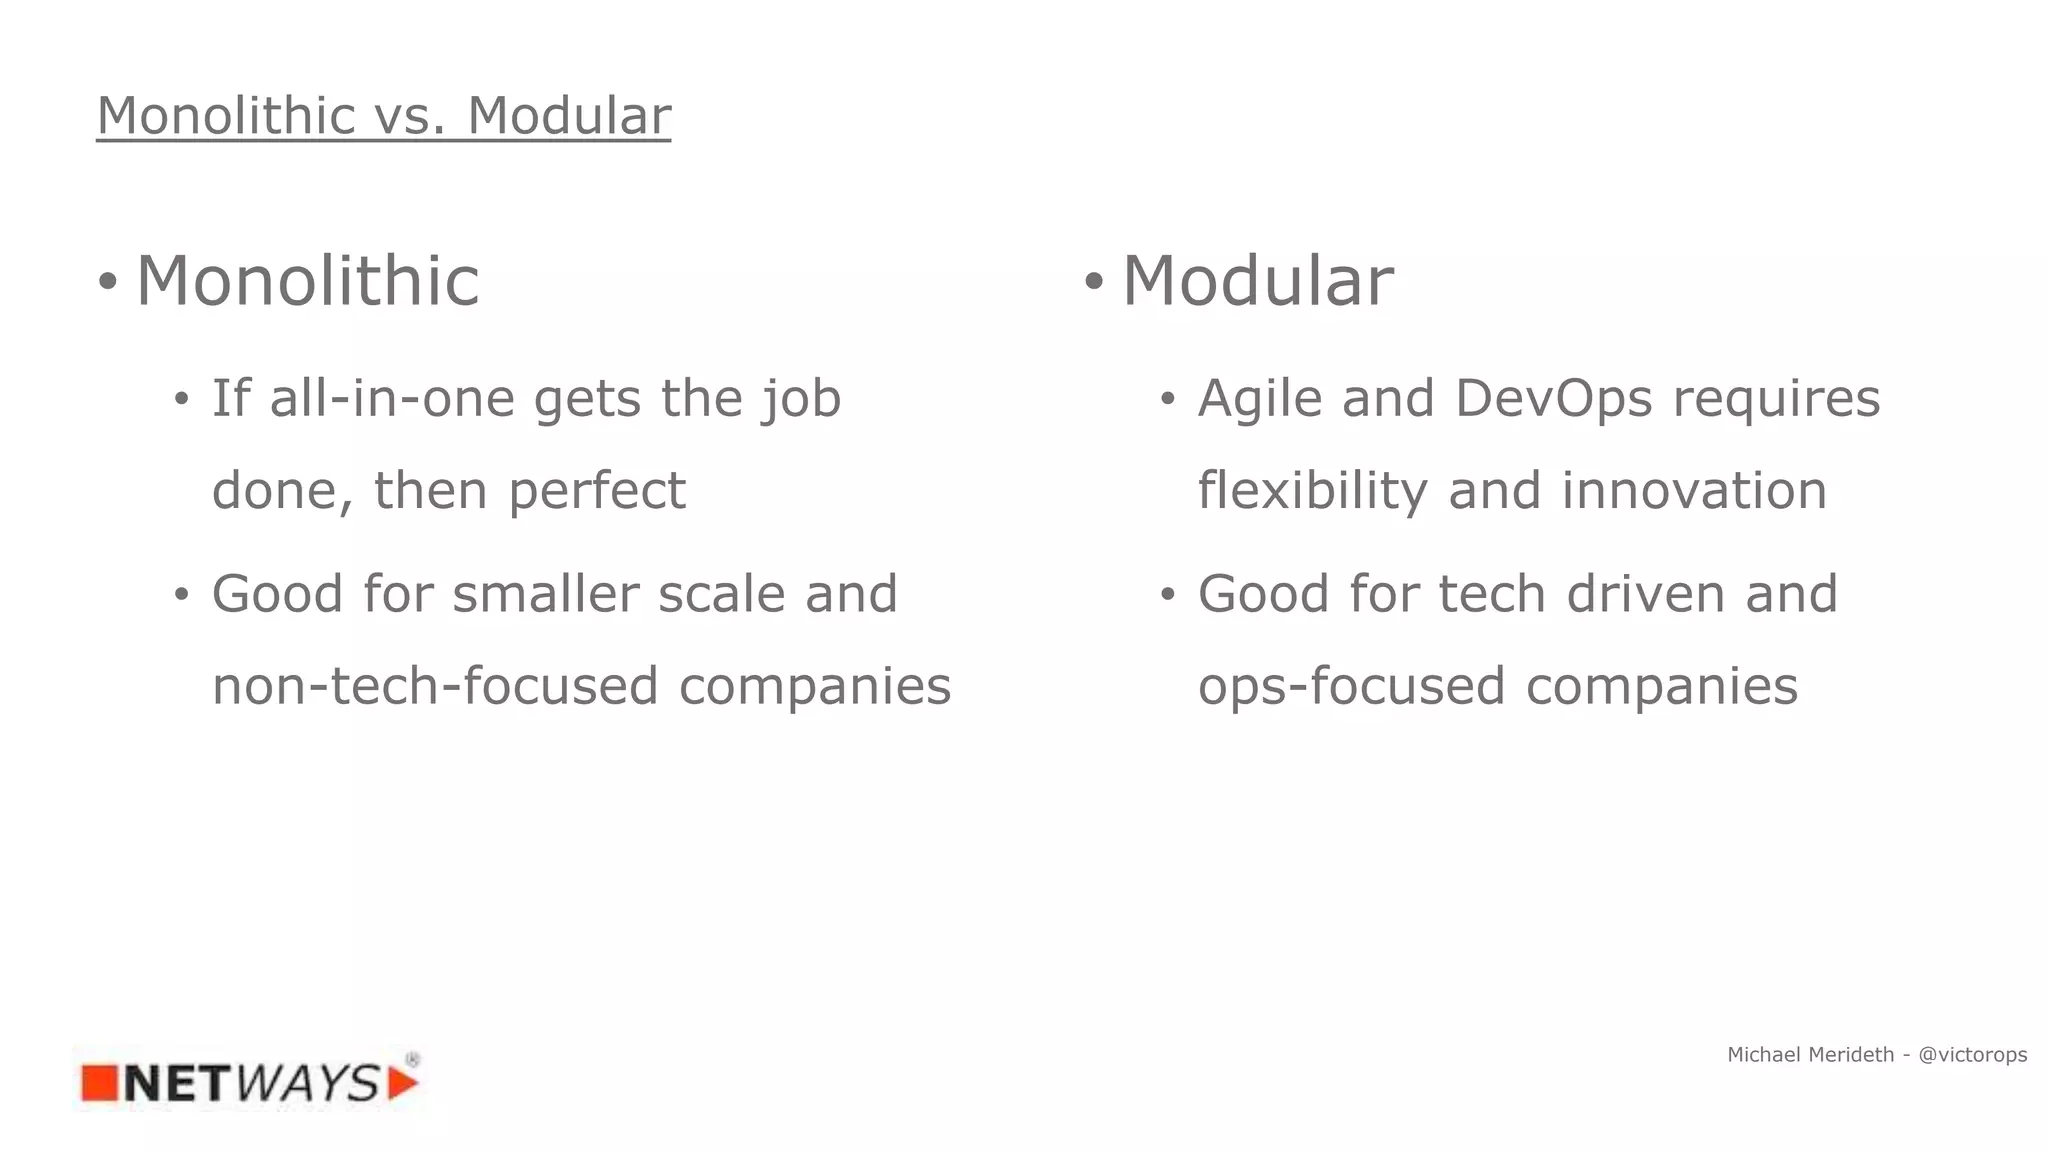

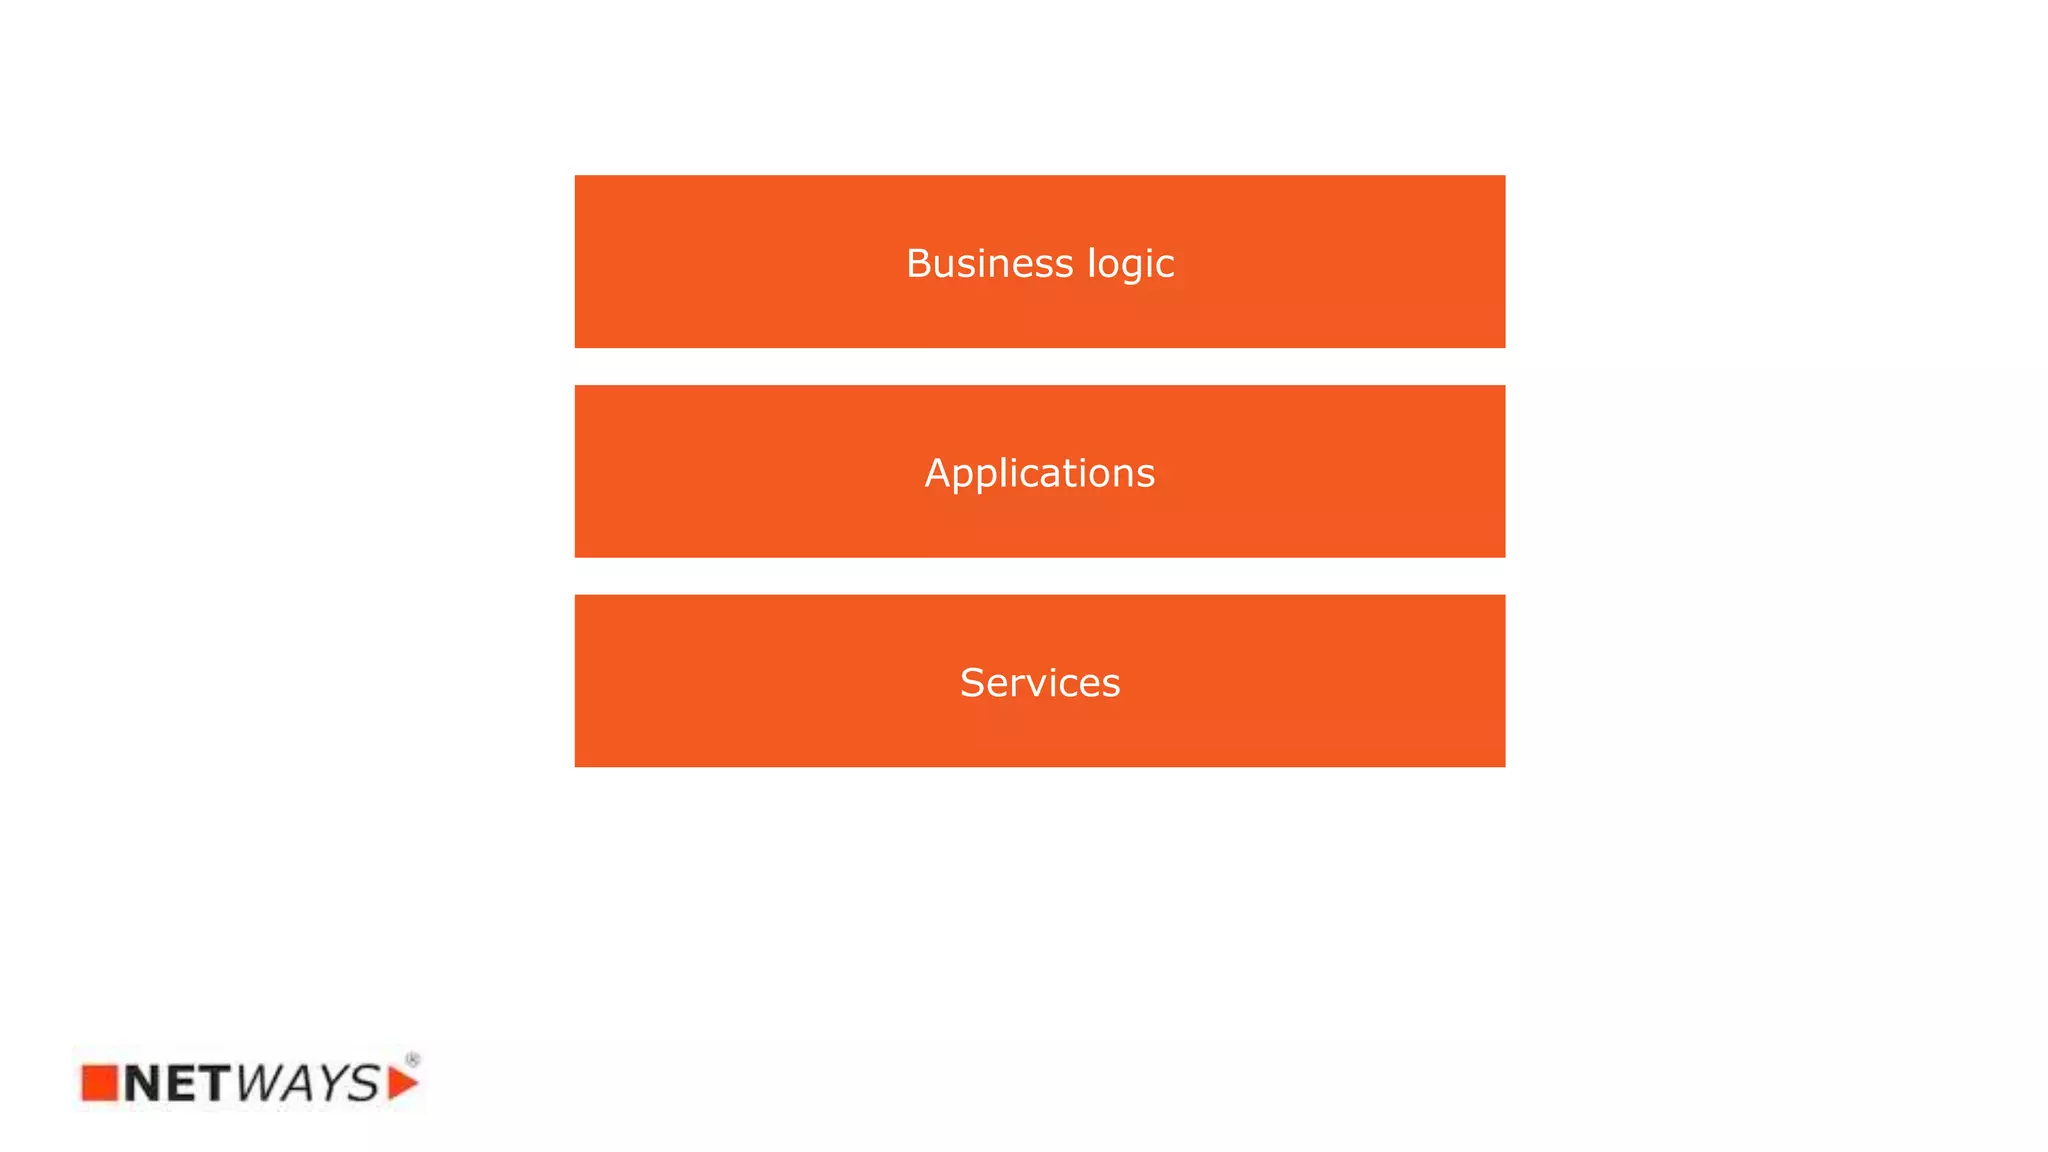
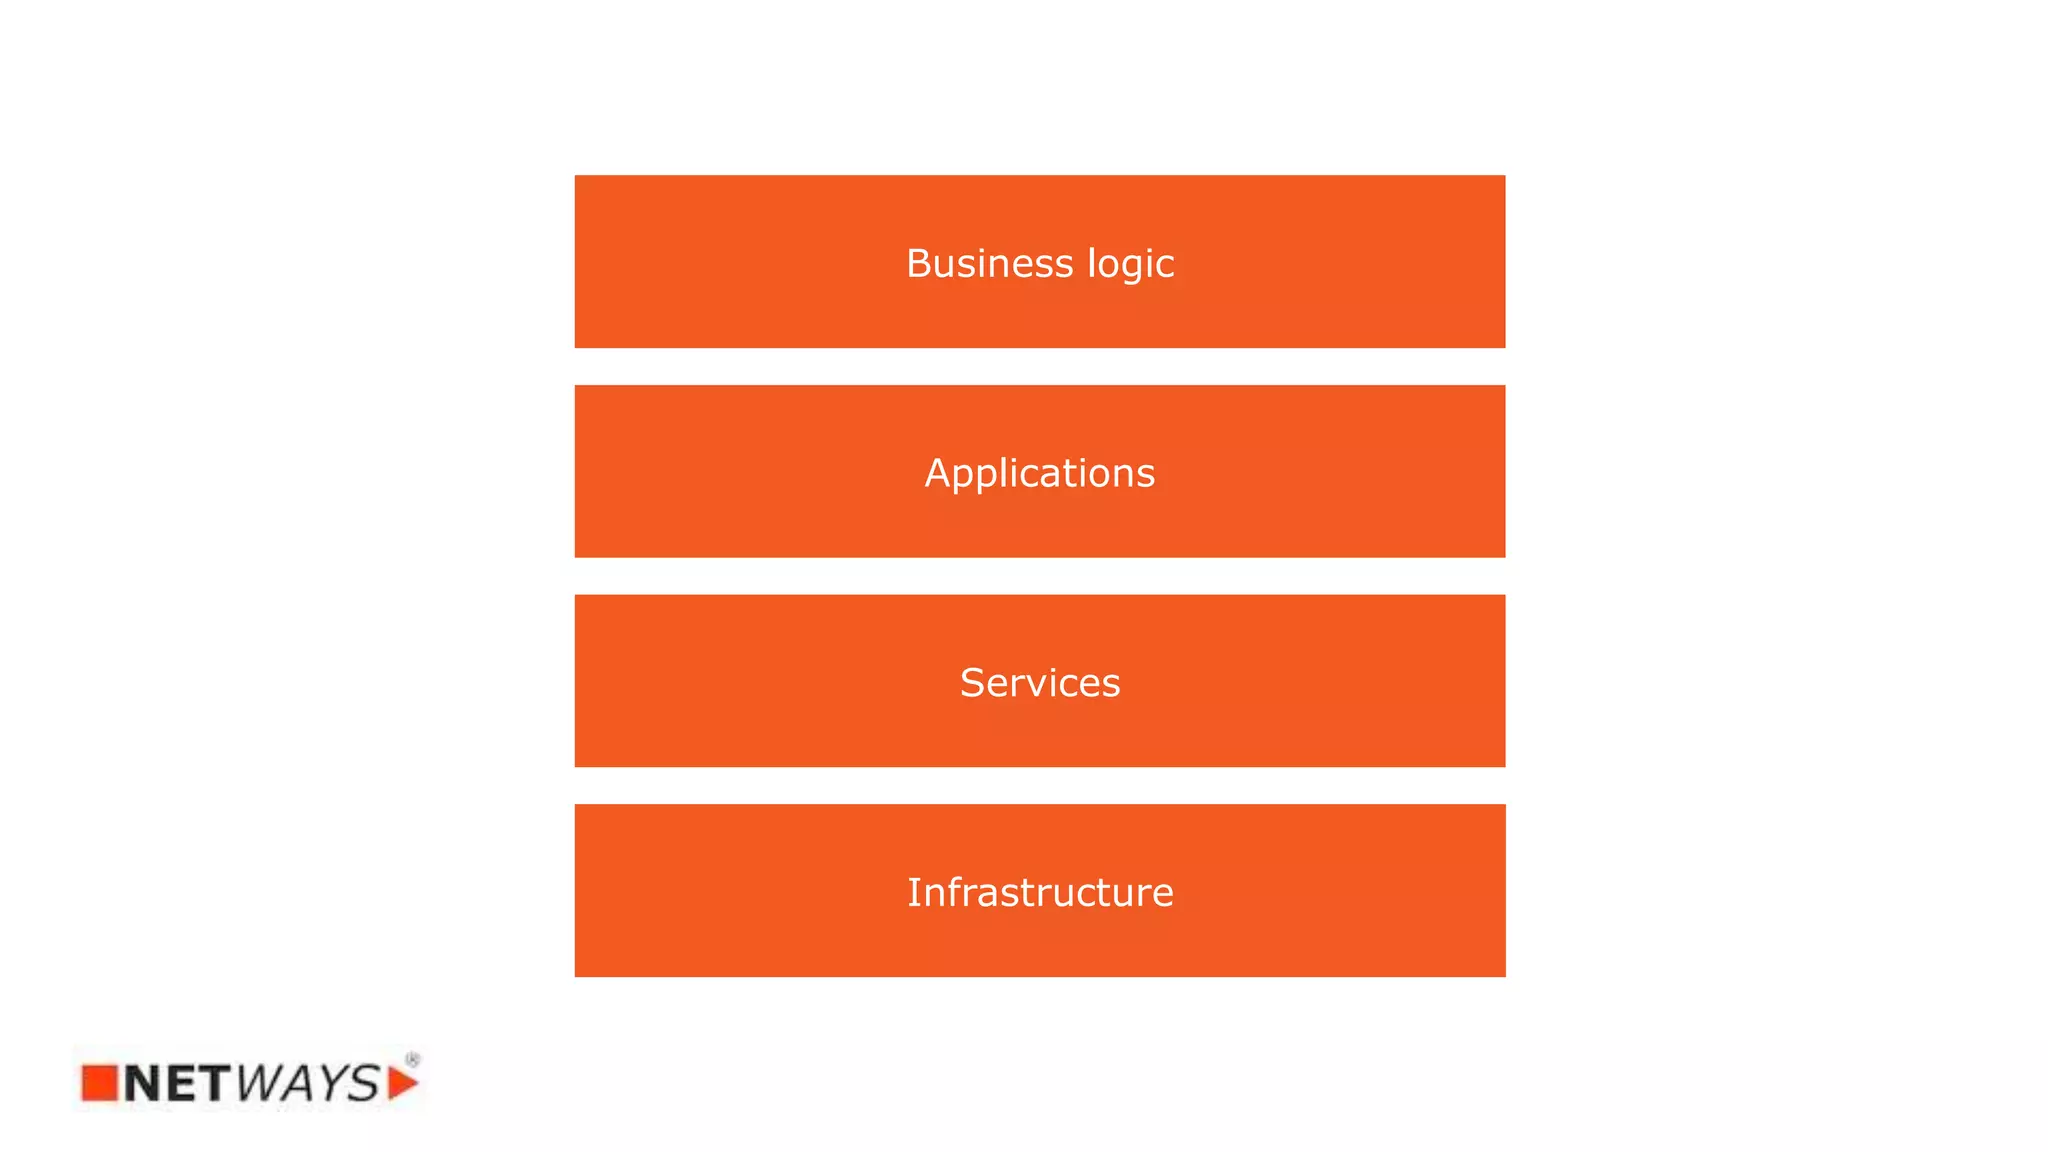
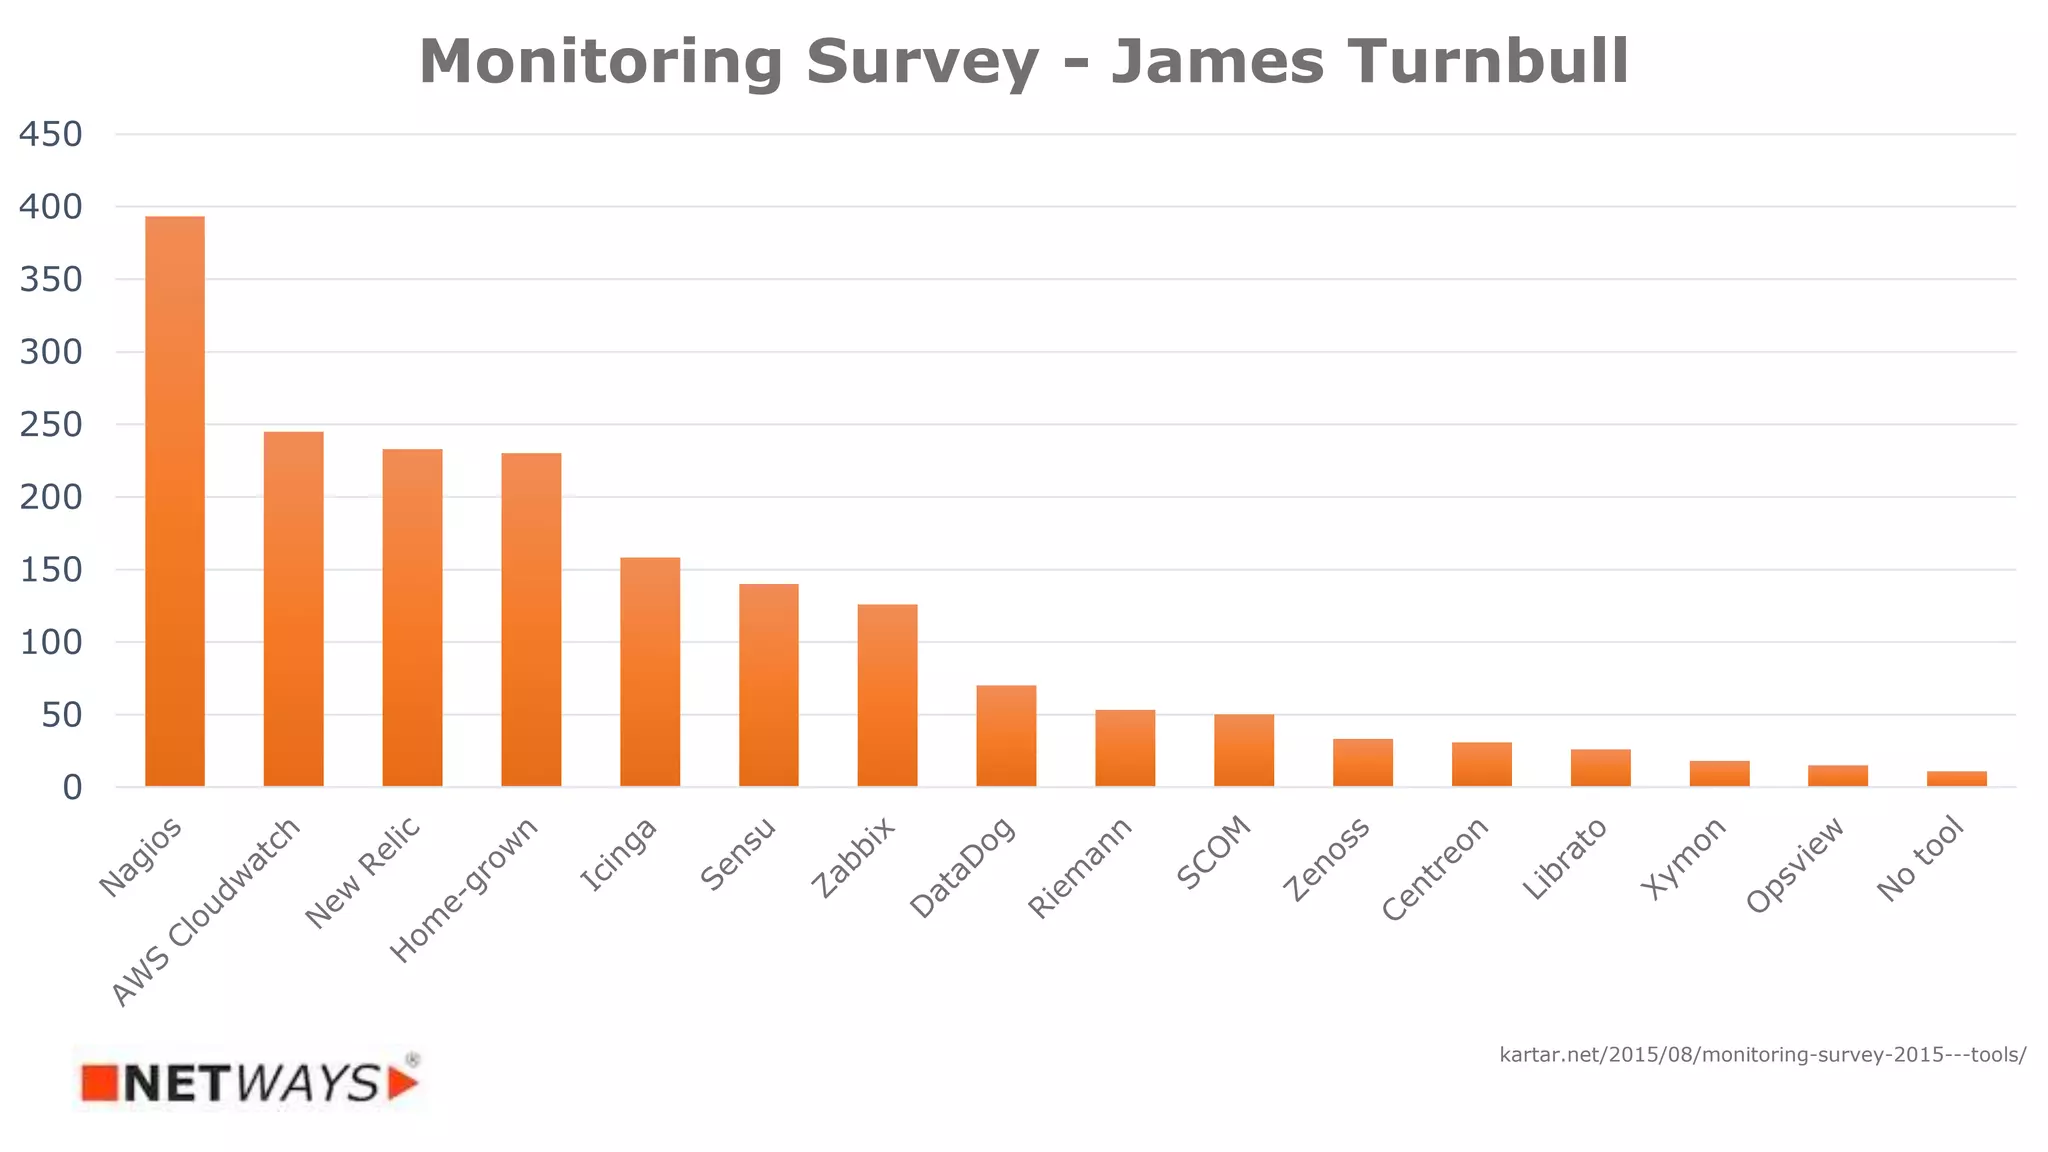
The document discusses the open source monitoring landscape as of May 2017, highlighting various monitoring tools like Nagios, Icinga, Sensu, and Zabbix, each with its unique features and limitations. It emphasizes the need for a top-down approach to monitoring, focusing on monitoring business logic and infrastructure. The conclusion suggests that there is no one-size-fits-all tool, advocating for a flexible, modular approach tailored to specific organizational needs.


![Vibe Coding vs. Spec-Driven Development [Free Meetup]](https://cdn.slidesharecdn.com/ss_thumbnails/vibecodingvsspecdrivendevelopment-251209105622-43f455e7-thumbnail.jpg?width=640&height=640&fit=bounds)


