Downloaded 69 times


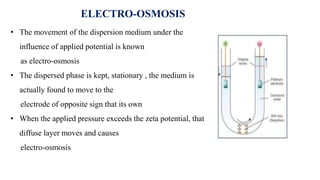


![ELECTRON TRANSFER REACTIONS : THE MARCUS THEORY
Definition:
• Chemical reaction in which an electron transferred from the reduced form of a reactant
to the oxidized form of a reactant in solution is called electron transfer method
Examples:
1. MnO4
2- + MnO4
- → MnO4
- + MnO4
2-
2. [Fe(H2O)6]2+ + [Fe(H2O)6]3+ →
[Fe(H2O)6]3+ + [Fe(H2O)6]2+](https://image.slidesharecdn.com/electricaldoublelayer-210610055049/85/ELECTROCHEMISTRY-ELECTRICAL-DOUBLE-LAYER-32-320.jpg)

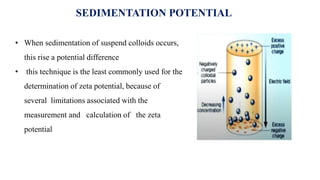
![ELECTRON TRANSFER REACTION
• Consider electron transfer form a donor species D to an acceptor species A in solution
• First D and A must diffuse through the solution and collide to form a complete DA in
which the donor and the acceptor are separated by a distance r which is the distance
between the edges of each species
i.e., D + A ⇌ DA ; K1 =
[𝐷𝐴]
𝐷 [𝐴]
DA → D+A- ; rate = Ket [DA]
D+A- ⇌ D+ + A- ; Kv =
D+ [A−]
[D+A−]
Mechanism and kinetics of electron transfer reaction:](https://image.slidesharecdn.com/electricaldoublelayer-210610055049/85/ELECTROCHEMISTRY-ELECTRICAL-DOUBLE-LAYER-34-320.jpg)


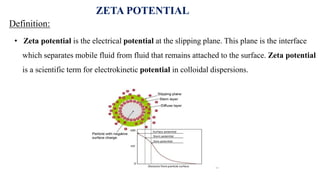
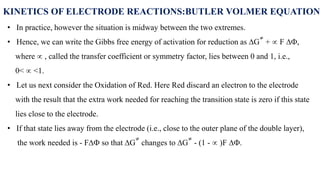
![• Consider a reaction at the electrode in which a particular species is reduced by the transfer
of a single electron in a rate-determining step. Let [Ox] and [Red] be the concentration of
the oxidized and reduced forms of the species, outside the double layer. Clearly the net
current at the electrode is the difference of the currents resulting from the reduction of Ox and
oxidation of red. The rates of these process are kc[ox] and ka[Red], respectively. In a reduction
process, the magnitude of charge transferred per mole of reaction events is
F = eNA
Where F is the faraday constant
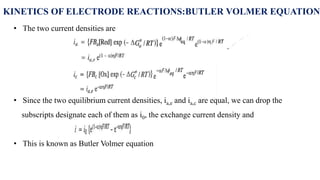
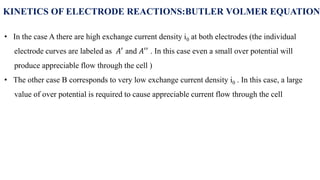
KINETICS OF ELECTRODE REACTIONS:BUTLER VOLMER EQUATION](https://image.slidesharecdn.com/electricaldoublelayer-210610055049/85/ELECTROCHEMISTRY-ELECTRICAL-DOUBLE-LAYER-44-320.jpg)
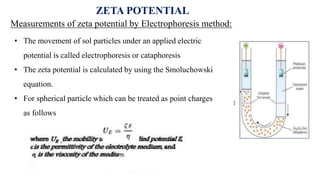
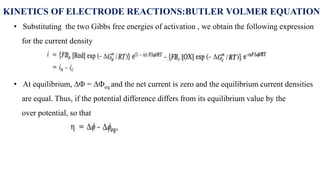
![• The cathodic current density ic, arising from the reduction is given by
ic = F kc [Ox]
• An opposing anodic current density ia, arising from oxidation is given by
ia = F ka [Red]
• Where kis are the corresponding rate constants. Hence the net current density at the electrode is
given by
i = ia – ic = F ka [Red] - F kc [Ox]
= F Ba [Red] exp (-∆Ga
≠
/ RT) – F Bc [Ox] exp (-∆Gc
≠
/ RT)
• When ia > ic so that i > 0, the current is anodic and ic > ia so that i < 0, the current is cathodic
KINETICS OF ELECTRODE REACTIONS:BUTLER VOLMER EQUATION](https://image.slidesharecdn.com/electricaldoublelayer-210610055049/85/ELECTROCHEMISTRY-ELECTRICAL-DOUBLE-LAYER-45-320.jpg)


![• For an anodic reaction (oxidation)
M → Mn+ + ne-
• Metal ionic concentration increases at the vicinity of the metal and the electrode potential
is increases as per the Nernst equation
E (M+, M) = E0
(M+, M) +
𝑅𝑇
𝑛𝐹
ln [Mn+ ]
• For a cathodic reaction (reduction)
Mn+ + ne- → M
• Metal ionic concentration decreases at the vicinity of the metal and the electrode potential
is decreases as per the Nernst equation
E (M+, M) = E0
(M+, M) +
𝑅𝑇
𝑛𝐹
ln [Mn+ ]
CONCENTRATION POLARIZATION](https://image.slidesharecdn.com/electricaldoublelayer-210610055049/85/ELECTROCHEMISTRY-ELECTRICAL-DOUBLE-LAYER-57-320.jpg)
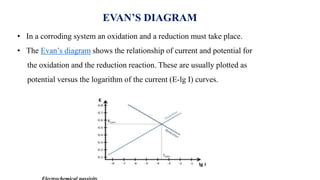
![POURBAIX DIAGRAM [PE VS PH], [E0 VS PH]
[Electrode potential Vs PH]
• Graphical representation of the thermodynamics equilibrium state of a metal –electrolyte system
is called Pourbaix diagram
Eg: Iron Pourbaix diagram](https://image.slidesharecdn.com/electricaldoublelayer-210610055049/85/ELECTROCHEMISTRY-ELECTRICAL-DOUBLE-LAYER-58-320.jpg)
![• The lines of the diagram dividing different zones of the equilibrium states are calculated by
• Nernst Equation
E = E0 – (
0.059
𝑛
) ln Cion
• where, E0 is the standard electrode potential
0.0591/n is the number of electron transferred
Cion is the molar activity of ions
POURBAIX DIAGRAM [PE VS PH], [E0 VS PH]](https://image.slidesharecdn.com/electricaldoublelayer-210610055049/85/ELECTROCHEMISTRY-ELECTRICAL-DOUBLE-LAYER-59-320.jpg)
![• Pourbaix diagram help us to determine the corrosion behavior of a metal in water solution.
i.e., the direction of the electrochemical process and the equilibrium state of a metal at a
certain electrode potential in a water solution at a certain value of PH
• Normally Pourbaix diagram built for the low concentration of metal ions
• Dashed line (blue colour) enclose the theoretical region of the stability of the water
2H2O → O2 + 4H+ + 4e-
• Above the dashed line, water is oxidized to oxygen
• Below the lower dashed line, water is reduced to hydrogen. 2H+ + 2e- →H2
POURBAIX DIAGRAM [PE VS PH], [E0 VS PH]](https://image.slidesharecdn.com/electricaldoublelayer-210610055049/85/ELECTROCHEMISTRY-ELECTRICAL-DOUBLE-LAYER-60-320.jpg)
![Solid iron zone : (Below a-b-j)
(Immunity zone)
• The electrochemical reactions in this zone proceed in the direction of reduction of iron ions
• No corrosion occurs in this zone
Fe2+ zone : (Below a-b-n-c-d-e)
(corrosion zone)
• Aqueous solution of ion (Fe2+)
• Metallic ion oxidizes in this zone (Iron corrodes in this zone)
POURBAIX DIAGRAM [PE VS PH], [E0 VS PH]](https://image.slidesharecdn.com/electricaldoublelayer-210610055049/85/ELECTROCHEMISTRY-ELECTRICAL-DOUBLE-LAYER-61-320.jpg)
![Fe3+ zone : (e-d-f-g-k)
(corrosion zone)
• Aqueous solution of ion (Fe3+ )
• Metallic ion oxidizes in this zone (Iron corrodes in this zone)
Fe2O3 (solid) zone : (e-d-f-h-i)
(Passivation zone)
• Solid ferrous oxide (Fe2O3)
• Iron corrodes in this zone however the resulted oxide film depresses the oxidation
process passivation
• Passivation means – Protection of the metal from corrosion due to the formation
of a film of a solid product of the oxidation reaction
POURBAIX DIAGRAM [PE VS PH], [E0 VS PH]](https://image.slidesharecdn.com/electricaldoublelayer-210610055049/85/ELECTROCHEMISTRY-ELECTRICAL-DOUBLE-LAYER-62-320.jpg)
 zone : (n-c-i-p)
(Passivation zone)
• The iron oxide film causes passivation
POURBAIX DIAGRAM [PE VS PH], [E0 VS PH]](https://image.slidesharecdn.com/electricaldoublelayer-210610055049/85/ELECTROCHEMISTRY-ELECTRICAL-DOUBLE-LAYER-63-320.jpg)
![Fe(OH)2 (solid hydroxide) zone : (b-n-p-j)
(Green rust )
(Passivation zone)
• Green rust is an unstable corrosion product typically produced in low-oxygen environment
• Green rust occurs when the concentration of OH is more (PH increases )
Horizontal lines: (a-b), (e-d)
• Represent redox reactions which are independent of PH
Fe(s) → Fe(aq)
2+ + 2e-
Fe2+ → Fe3+ + e-
POURBAIX DIAGRAM [PE VS PH], [E0 VS PH]](https://image.slidesharecdn.com/electricaldoublelayer-210610055049/85/ELECTROCHEMISTRY-ELECTRICAL-DOUBLE-LAYER-64-320.jpg)
![Vertical line : (d-f)(b-n)
• Represents non redox reaction, electrons are not involved which are dependent on PH
• (Acid base reaction)
2Fe3+
(aq) + 3O2-→ Fe2O3
Fe2+ + 2OH- → Fe(OH)2
Diagonal line : (c-d)(b-j)
• Represents the redox reaction, which are dependent on PH
• (Acid base reaction)
(c-d) 2Fe2+
(aq) + 3H2O→ Fe2O3(s) + 6H+
(aq) + 2e-
(b-j) Fe + 2OH- → Fe(OH)2 + 2e-
POURBAIX DIAGRAM [PE VS PH], [E0 VS PH]](https://image.slidesharecdn.com/electricaldoublelayer-210610055049/85/ELECTROCHEMISTRY-ELECTRICAL-DOUBLE-LAYER-65-320.jpg)
![• Active metal Fe is stable below the H2 line this means that iron metal is unstable in
contact with water
• Water is stable only below the dashed line
POURBAIX DIAGRAM [PE VS PH], [E0 VS PH]](https://image.slidesharecdn.com/electricaldoublelayer-210610055049/85/ELECTROCHEMISTRY-ELECTRICAL-DOUBLE-LAYER-66-320.jpg)


![• The Fe 2+ ions and 2OH- ions diffused towards and precipitated as Fe(OH)2
i.e., Fe 2+ +2OH- → Fe(OH)2
• If enough oxygen is present Fe(OH)2 is easily oxidized to ferric hydroxide
4Fe(OH)2 + O2 + 2H2O → 4Fe(OH)3 [2Fe2O3.6H2O]
• The resulted ferric hydroxide is called rust and as formula Fe2O3.xH2O. the value of
x varied depending upon the availability of water
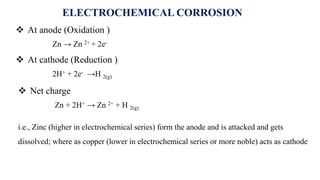
At anode (Oxidation )
Fe → Fe 2+ + 2e-
At cathode (Reduction )
½ O2 + H2O + 2e- → 2OH-
ELECTROCHEMICAL CORROSION](https://image.slidesharecdn.com/electricaldoublelayer-210610055049/85/ELECTROCHEMISTRY-ELECTRICAL-DOUBLE-LAYER-72-320.jpg)


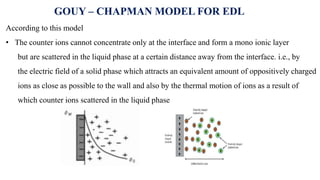
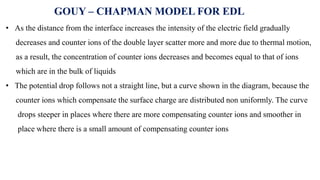
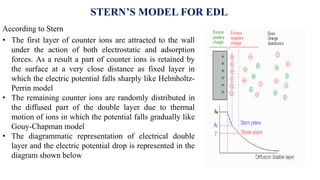
The document provides a comprehensive overview of the concept of the electrical double layer (EDL) and its significance in electrochemistry, including definitions, evidence, and examples related to stability in colloidal systems. It explores electro capillary and electro kinetic phenomena related to zeta potential, along with their measurement techniques and applications in various industries. Additionally, it discusses surfactants, overvoltage, and the kinetics of electron transfer reactions in electrode processes.


![PHASE TRANSFER CATALYSIS [PTC]](https://cdn.slidesharecdn.com/ss_thumbnails/64-191219161253-thumbnail.jpg?width=640&height=640&fit=bounds)


