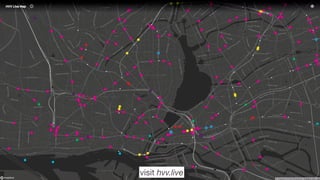
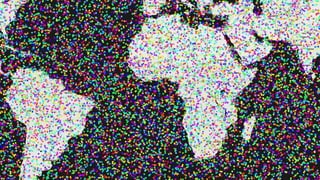
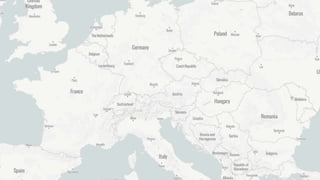
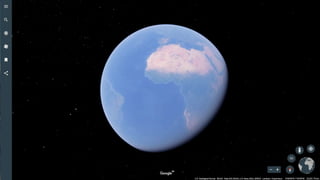
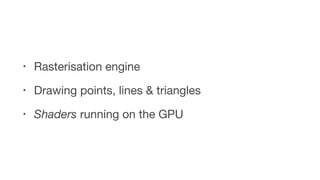
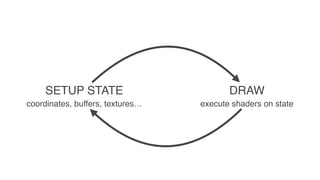
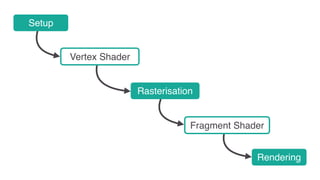
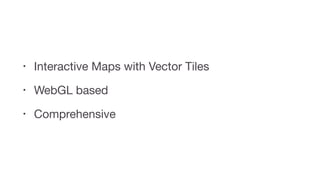
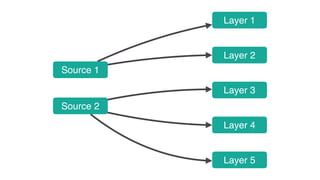
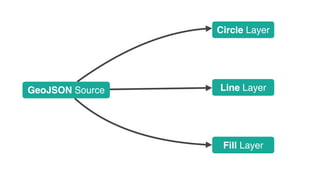
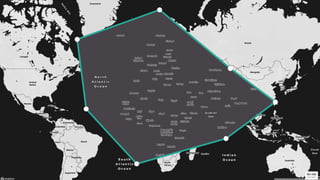
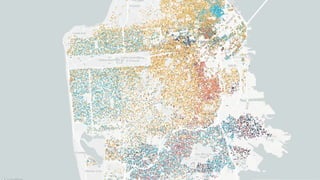
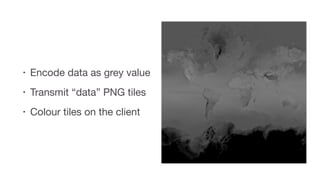
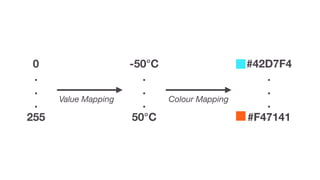
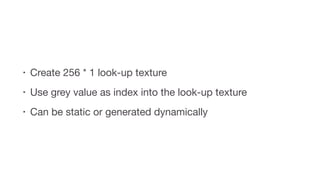
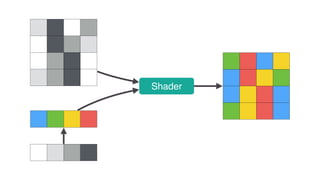
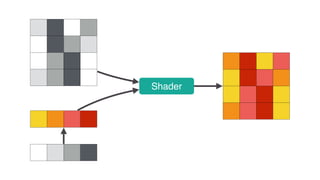
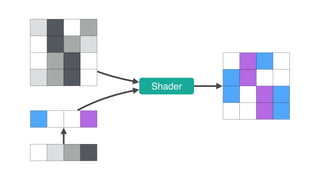
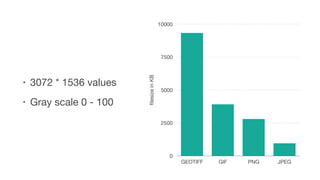
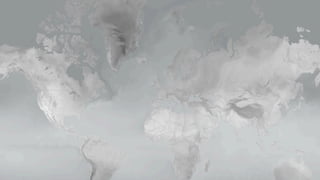
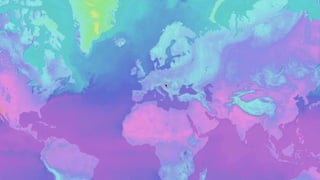
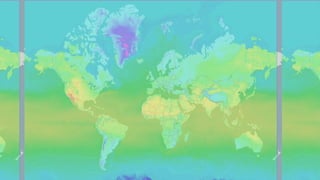
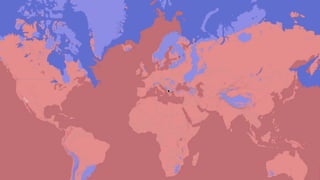
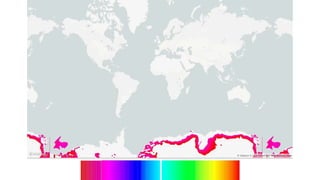
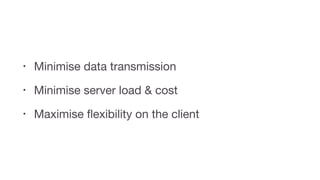
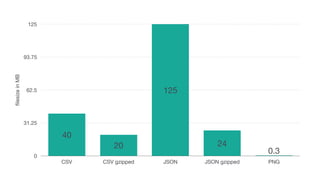
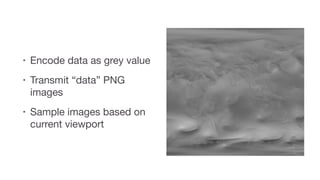
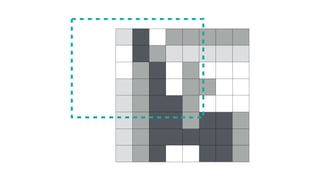
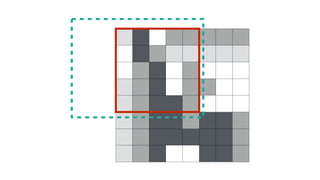
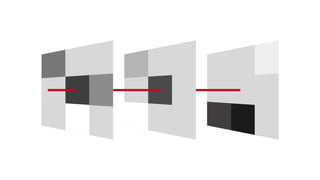
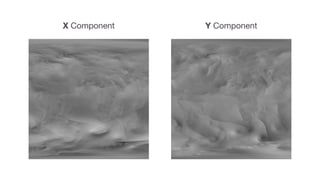
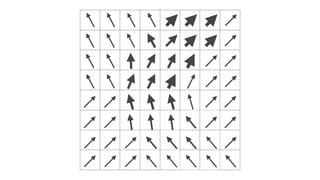
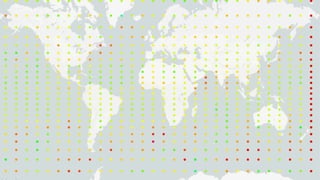
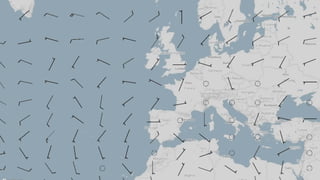
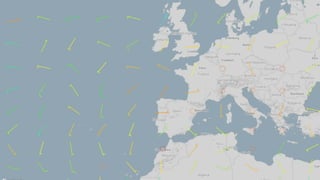
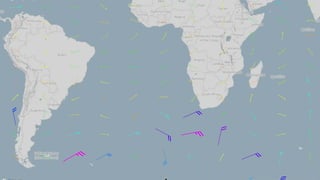
Franz Neubert discusses the creation of interactive map applications using Mapbox GL and WebGL, focusing on efficient data visualization through the minimization of data transmission and server load. The document details methods for encoding data as grey values, rendering tiles dynamically, and maximizing flexibility on the client side. It highlights techniques for color mapping and rendering maps while showcasing the use of shaders and various file formats.


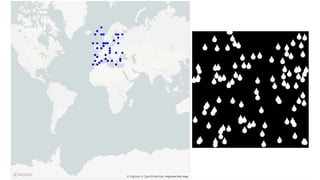
![x x x
x x x
x x x
[10, -34]
[15, -29]](https://image.slidesharecdn.com/foss4g-170802104028/85/Make-It-Rain-with-Mapbox-GL-Franz-Neubert-44-320.jpg)
![[10, -34]
[15, -29]](https://image.slidesharecdn.com/foss4g-170802104028/85/Make-It-Rain-with-Mapbox-GL-Franz-Neubert-45-320.jpg)


![HDFC bank experiance certificate[1].PDF](https://cdn.slidesharecdn.com/ss_thumbnails/d880958d-1c51-4511-98af-ac8dca594d06-161102004652-thumbnail.jpg?width=640&height=640&fit=bounds)