SlideShare a Scribd company logo
1 of 442
Download to read offline
F I N A L R E P O R T
TRAFFIC OPERATIONS ANALYSIS REPORT
SR-210 MIXED FLOW LANE ADDITION
FROM HIGHLAND AVENUE (PM R25.0) TO
SAN BERNARDINO AVENUE (PM R33.2)
IN THE COUNTY OF SAN BERNARDINO
EA 0C700
Prepared for
SAN BERNARDINO ASSOCIATED GOVERNMENTS
In conjunction with
Caltrans – District 8
February 2014
2020 East First Street, Suite 400
Santa Ana, California 92705
08-SBD-210
PM R25.0/R33.2
EA 0C700, Project No. 0812000164
SR-210 Mixed Flow Lane Addition Project i
Traffic Operations Analysis Revised: February 2014
TABLE OF CONTENTS
1.0 INTRODUCTION...............................................................................................................................................3
Background .............................................................................................................................................. 3
2.0 TRAVEL DEMAND FORECAST MODEL ........................................................................................................6
SBTAM Model Background ..................................................................................................................... 6
SANBAG Traffic Modeling Data.............................................................................................................. 6
Project SBTAM Traffic Modeling Scenarios .......................................................................................... 6
Model Conversion and Post Processing Methodology........................................................................ 7
Traffic Model Projections for 2020 Project Opening and 2040 Future Year Project Conditions...... 7
3.0 ANALYSIS METHODOLOGY...........................................................................................................................8
Basic Freeway Segments ........................................................................................................................ 9
Weave Segments.................................................................................................................................... 10
Freeway Merge and Diverge Segments ............................................................................................... 11
4.0 EXISTING (2012) TRAFFIC CONDITIONS....................................................................................................13
Existing Volumes ................................................................................................................................... 13
Existing Truck Data................................................................................................................................ 14
Existing Traffic Conditions.................................................................................................................... 15
5.0 OPENING YEAR (2020) TRAFFIC CONDITIONS .........................................................................................20
Opening Year (2020) - No Build Traffic Conditions ............................................................................ 20
Opening Year 2020 - Build Traffic Conditions..................................................................................... 25
6.0 HORIZON YEAR (2040) TRAFFIC CONDITIONS .........................................................................................30
Horizon Year (2040) - No Build Traffic Conditions.............................................................................. 30
Horizon Year (2040) - Build Traffic Conditions.................................................................................... 35
7.0 SUMMARY AND CONCLUSION....................................................................................................................40
APPENDICES
Appendix A – Traffic Model Projections
Appendix B – Traffic Analysis Worksheets
Appendix C – SR-210 Traffic Volume Summary, Traffic Counts and Volume Factors
08-SBD-210
PM R25.0/R33.2
EA 0C700, Project No. 0812000164
SR-210 Mixed Flow Lane Addition Project ii
Traffic Operations Analysis Revised: February 2014
FIGURES AND TABLES
List of Figures
Figure 1: Project Location Map ............................................................................................................................... 5
Figure 2: Existing (2012) Freeway Mainline and Ramp Geometrics..................................................................... 16
Figure 3: Existing (2012) Freeway Mainline and Ramp Volumes......................................................................... 17
Figure 4: Opening Year (2020) - No Build Freeway Mainline and Ramp Geometrics.......................................... 21
Figure 5: Opening Year (2020) - No Build Freeway Mainline and Ramp Volumes .............................................. 22
Figure 6: Opening Year (2020) - Build Freeway Mainline and Ramp Geometrics................................................ 26
Figure 7: Opening Year (2020) - Build Freeway Mainline and Ramp Volumes.................................................... 27
Figure 8: Horizon Year (2040) - No Build Freeway Mainline and Ramp Geometrics ........................................... 31
Figure 9: Horizon Year (2040) - No Build Freeway Mainline and Ramp Volumes................................................ 32
Figure 10: Horizon Year (2040) - Build Freeway Mainline and Ramp Geometrics............................................... 36
Figure 11: Horizon Year (2040) - Build Freeway Mainline and Ramp Volumes ................................................... 37
List of Tables
Table 1: LOS Criteria for Basic Freeway Segments ............................................................................................. 10
Table 2: LOS Criteria for Weaving Segments....................................................................................................... 11
Table 3: LOS Freeway Merge and Diverge Segments ......................................................................................... 12
Table 4: Existing (2012) - SR-210 Eastbound Mainline and Ramp Operations LOS ........................................... 18
Table 5: Existing (2012) - SR-210 Westbound Mainline and Ramp Operations LOS .......................................... 19
Table 6: Opening Year (2020) SR-210 - No Build Eastbound Mainline and Ramp Operations LOS................... 23
Table 7: Opening Year (2020) SR-210 - No Build Westbound Mainline and Ramp Operations LOS.................. 24
Table 8: Opening Year (2020) SR-210 - Build Eastbound Mainline and Ramp Operations LOS......................... 28
Table 9: Opening Year (2020) SR-210 – Build Westbound Mainline and Ramp Operations LOS....................... 29
Table 10: Horizon Year (2040) SR-210 – No Build Eastbound Mainline and Ramp Operations LOS ................. 33
Table 11: Horizon Year (2040) SR-210 – No Build Westbound Mainline and Ramp Operations LOS ................ 34
Table 12: Horizon Year (2040) SR-210 – Build Eastbound Mainline and Ramp Operations LOS....................... 38
Table 13: Horizon Year (2040) SR-210 – Build Westbound Mainline and Ramp Operations LOS...................... 39
08-SBD-210
PM R25.0/R33.2
EA 0C700, Project No. 0812000164
SR-210 Mixed Flow Lane Addition Project 3
Traffic Operations Analysis Revised: February 2014
TRAFFIC OPERATIONS ANALYSIS
1.0 INTRODUCTION
This report presents the results of the traffic operations analysis conducted for the State Route
210 (SR-210) Mixed Flow Lane Addition Project (“Project’) in San Bernardino County. The
proposed improvements are located within Caltrans District 8 jurisdiction, from post mile (PM)
R25.0 to R33.2. The traffic study area includes the freeway mainline and ramp merge and
diverge areas from west of Highland Avenue/Arden Avenue to east of San Bernardino Avenue.
The scope and Purpose and Need of the project focuses primarily on the mainline segment lane
addition and associated improvements only. The project proposes to add one mixed flow lane in
each direction within the median of SR-210, create auxiliary lanes between the Base Line and
Fifth Street interchanges and add an acceleration lane at the eastbound Fifth Street on-ramp.
The auxiliary lanes between Base Line and 5th
Street will be created by extending the existing
deceleration lanes at the off-ramps back to the adjacent interchange’s on-ramps.
Existing (2012), Opening Year (2020) and Horizon Year (2040) conditions were analyzed in this
traffic operations analysis report. Existing (2012) used as baseline which is the year that
environmental studies were initiated.
Background
A Project Study Report/Project Development Support (PSR/PDS) was approved in 2008. The
PSR/PDS had originally called for providing one additional mixed flow lane in each direction
from Highland Avenue to San Bernardino Avenue and one new HOV lane in each direction from
I-215 to I-10. The current project is to provide one additional mixed flow lane in each direction
from Highland Avenue to San Bernardino Avenue plus associated auxiliary lane and
acceleration lane improvements.
The SR-210 Mixed Flow Lane Addition Project is located within the Valley Region Planning Area
as described in the San Bernardino County General Plan. The cities of Highland in the north
and Redlands in the south surround much of the project study area. Adjacent jurisdictions
include the City of San Bernardino and unincorporated areas of San Bernardino County.
State Route 210 (SR-210)
State Route 210 (SR-210), refers to the eastern segment and extension of Interstate 210 (I-
210). SR-210 comprises the segment starting at the east end of the I-210, in the City of San
Dimas, and extends eastward for approximately 33.2 miles, reaching the terminus at Interstate
10 in the City of Redlands. Within the project limits, the SR-210 provides adjacent junctions onto
Interstate 15, Interstate 215, State Route 259, State Route 18, State Route 330, Interstate 10
and, adjacent interchanges onto Highland Avenue, Base Line, 5th Street/Greenspot Road and
San Bernardino Avenue. A new future service interchange is under consideration at Victoria
Avenue, 0.6 miles east of the Highland Avenue interchange and 1.3 miles west of the SR-210 to
SR-330 interchange, approximately at PM R27.8. SR-210 is included in the National Highway
System, the California Freeway and Expressway System and the “12 foot Wide Arterial
System”. The SR-210, within the project limit, is classified as a Principal Arterial highway.
08-SBD-210
PM R25.0/R33.2
EA 0C700, Project No. 0812000164
SR-210 Mixed Flow Lane Addition Project 4
Traffic Operations Analysis Revised: February 2014
West of the Project (west of Highland Avenue) SR-210 consists of three mixed flow lanes in
each direction. East of the Project (east of San Bernardino Avenue) SR-210 consists of four
mixed flow lanes in each direction.
State Route 330 (SR-330)
State Route 330 (SR-330) is a 15 mile freeway/conventional two-lane highway where the
westerly segment begins at the junction of the SR-210 and extends northeasterly to SR-18. SR-
330 is mostly considered a conventional two-lane highway as only the initial 1-mile segment
from the junction at SR-210 is constructed to freeway standards. SR-330 is located within San
Bernardino County and is utilized as one of the main accesses into the cities of Big Bear and
Lake Arrowhead. Access from east/westbound SR-210, onto northbound SR-330 is provided
via connector ramps and access onto east/westbound SR-210 from southbound SR-330 is
provided also via connector ramps.
Interstate 10 (I-10)
Interstate 10 (I-10), within the state of California, is a major east-west interstate highway that
spans approximately 250 miles starting in the City of Santa Monica and ending in the City of
Blythe. The segment of I-10 adjacent to the Project, where it serves as the terminus for the SR-
210, is located at post mile marker 77.3. Access between east/westbound SR-210 and
east/westbound I-10 is provided via connector ramps.
SR-210 Mixed Flow Lane Addition
(PM R26.0/R33.2) - EA 0C700
K:2012SR-210
Mixed
Flow
Lane
AdditionFigures.ai
Governments
SANBAG
Working T
ogether
Governments
SANBAG
Working T
ogether
LOMA LINDA
LOMA LINDA
SAN BERNARDINO
SAN BERNARDINO
HIGHLAND
3RD ST
ALMOND AV
ORANGE
ST
E HIGHLAND AV
HUGO ST
X ST
TEXAS
ST
SANTA ANA RIVER TR
BRYN
MAWR
AV
MILLAR ST
W ST
PERIMETER RD
W LUGONIA AV
ALABAMA
ST
PALMETTO AV
Y ST
MILL ST
GUIDO AV
5TH ST
CYPRESS ST
ALT
A
ST
VA
LA
RIA
DR
BELL
CT
BNSF RR
CHURCH
AV
14TH ST
PALM
AV
T
IA
R
A
A
V
E PACIFIC ST
VICTOR AV
ARDEN
AV
PIONEER AV
MEINES ST
CALH
OUN
ST
6TH ST
BUCKEYE
ST
B
O
U
L
D
E
R
A
V
LASHEART DR
DOMESTIC AV
7TH ST
9TH ST
11TH ST
EUCALYPTUS
DR
WEBSTER
ST
N
BOULDER
AV
TE
NN
ES
SE
E
ST
PLUM LN
BASE LINE
CIE
NE
GA
DR
FISHER ST
W PALMETTO AV
SA
N
FR
AN
CI
SC
O
ST
U ST
COLE
AV
VICTORIA
AV
CITRUS
PLAZA
DR
WARD ST
I-10 E EXIT 75
S
T
R
E
A
T
E
R
A
V
GRAPE
ST
I-10 W EXIT 76
MESSINA ST
BONITA
DR
SAN BERNARDINO AV
NEVADA
ST
ELISE DR
LYNWOOD
WY
ROGERS
LN
VILLA
AV
LASSEN
ST
HERALD
ST
E 17TH ST
MIDWAY
I-10 W EXIT 75
MAIN ST
13TH ST
LUNT LN
HARLAN LN
MANSFIELD ST
BALDWIN AV
DUNKIRK
AV
E 21ST ST
KARON
ST
MERRIDY AV
RUBY AV
ATLANTIC AV
107TH
ST
NEWCOMB
ST
SR-30
E
EXIT
34
E SUNRISE LN
BRA
DFO
RD
AV
SPARKS ST
NONA AV
N
SEINE
AV
10TH ST
ARGYLE
AV
HARTZELL AV
LIVE OAK RD
INDIANA
CT
W PIONEER AV
NEWCASTLE
RD
N
W
E
S
T
F
R
O
N
T
A
E RAINBOW LN
SAGUARO WY
OAK RIDGE RD
G
R
O
V
E
A
V
RESEARCH
DR
BRUCE ST
STERLING
AV
SEVILLE
AV
BROWNING
RD
1
0
0
T
H
S
T
LAWTON
ST
ROCKFORD
AV
DR
UM
MO
ND
AV
C
A
V
E
S
T
WESTERN AV
NORWOOD ST
BAN
GOR
AV
ROGERS ST
DUNDEE
AV
FLEMING ST
C
A
R
LS
O
N
AV
CLYD
ESD
ALE
ST
TROLLEY
WY
EAS
TVI
EW
DR
7TH ST
14TH ST
REDLANDS
A
ð
A
³
SANTA ANA RIVER
A
³
!
"
$̀
C
IT
Y
C
R
E
E
K
SAND
CREEK
PLUNGE CREEK
Figure 1
Project Location Map
08-SBD-210
PM R25.0/R33.2
EA 0C700, Project No. 0812000164
SR-210 Mixed Flow Lane Addition Project 6
Traffic Operations Analysis Revised: February 2014
2.0 TRAVEL DEMAND FORECAST MODEL
This section discusses the traffic forecast model developed by SANBAG specifically for use
within San Bernardino County. The current SANBAG model is a sub-regional (subset) of the
regional Southern California Associated Governments (SCAG) Model and incorporates more
refined local details otherwise not included in larger scale regional models. The SANBAG
Model incorporates elements of the most recent Regional Transportation Plan (RTP) (2012-
2035) as compared to the earlier SCAG Model used in the preparation of the 2008 PSR/PDS
document for this project.
The development of the San Bernardino County Transportation Analysis Model (SBTAM) was
completed in June 2012, in partnership with Southern California Association of Governments
(SCAG).
SBTAM Model Background
According to SANBAG, the San Bernardino Transportation Analysis Model, (SBTAM) “replaces
the former RIVSAN subregional travel demand model, which is no longer being supported by
SCAG. The model is designed as the primary travel demand forecasting tool for use throughout
San Bernardino County, including the Valley, Victor Valley, Morongo Basin, and other
Mountain/Desert subareas. Some of the anticipated uses of SBTAM include: highway design
and environmental studies, traffic impact analysis reports for development projects, general
plans, land use policy analysis, and subregional transportation studies. SBTAM will also be
used for development of the County Transportation Plan, being initiated in Fiscal Year 2012-
2013.”
SANBAG Traffic Modeling Data
SANBAG currently has the 2008 and 2035 San Bernardino Traffic Analysis Model (SBTAM)
traffic model networks applicable for the proposed project and study area. The current SBTAM
model had been modified to reflect the no build and build conditions of the proposed project for
traffic forecasting needs.
The applicable 2008 and 2035 SBTAM model forecast output volumes were provided by
SANBAG. The provided model data, however, are mixed-flow traffic volume forecast only, and
do not contain separate truck only model forecast volumes.
Project SBTAM Traffic Modeling Scenarios
The following traffic modeling data scenarios and detailed content description were used in the
development of project opening year (2020) and project design year (2040) No Build and Build
conditions.
Future Year No Build Alternative (2035):
ƒ Include all programmed improvements from the RTP, except:
o Delete the SR-210 Mixed Flow Lane Addition Project and all of its associated
improvements from Highland Avenue to San Bernardino Avenue (i.e. this
segment should generally be modeled as 2 mixed flow lanes in each direction);
o Delete the proposed auxiliary lanes between Base Line and 5th Street;
08-SBD-210
PM R25.0/R33.2
EA 0C700, Project No. 0812000164
SR-210 Mixed Flow Lane Addition Project 7
Traffic Operations Analysis Revised: February 2014
o Delete the proposed southbound acceleration lane at the 5th Street on-ramp.
ƒ Include all of the SR-210/Base Line Interchange Improvement Project improvements
(including widening Base Line from Church Avenue to Boulder Avenue and widening the
ramps).
Future Year Build Alternative (2035):
ƒ Include all programmed improvements from the RTP with the exception of the SR-210
HOV lanes.
ƒ Include all of the SR-210 Mixed Flow Lane Addition Project improvements.
Model Conversion and Post Processing Methodology
The traffic model post-processing methodology follows and is consistent with SANBAG’s future
forecasting standards and requirements as outlined in Appendix H – Post Processed Traffic
Volume Guidelines from the San Bernardino County CMP documentation.
SANBAG’s traffic modeling output is expressed in terms of peak period traffic forecasts. In
order to utilize the data, SANBAG has developed conversion factors to convert peak period
volumes into usable peak hour volumes for use in the traffic analysis, which are summarized
below.
Model Conversion Factors
The following conversion factors are applied to derive peak period traffic volume forecast from
the traffic model peak period volume forecast. The intent is to develop usable peak hour
AM/PM analysis volumes from the peak period AM/PM forecast.
Passenger Car Model
AM peak hour = 0.38 x AM peak period
PM peak hour = 0.28 x PM peak period
Traffic Model Projections for 2020 Project Opening and 2040 Future Year Project
Conditions
Based on the traffic modeling updates described above, SANBAG had developed Year 2008
and Year 2035 Model run forecasts which were subsequently post-processed to develop
Opening Year 2020 and Horizon Year 2040 traffic volume projections.
Consistent with the methodology used in similar projects in the area and as an acceptable
method with SANBAG, the forecasted traffic volume differential between the 2008 and 2035
conditions was used to determine an annualized growth rate. Using Year 2012 as the pivot
year, the annualized growth factors were used to develop Opening Year 2020 and Horizon Year
2040 projected traffic volumes. This straight-line extrapolation may over or under predict future
volumes; however, it is considered an acceptable method of estimation for planning purposes
given the overall accuracy level of the model’s future year forecasts.
The results of the traffic model forecast post processing is summarized in Appendix A.
08-SBD-210
PM R25.0/R33.2
EA 0C700, Project No. 0812000164
SR-210 Mixed Flow Lane Addition Project 8
Traffic Operations Analysis Revised: February 2014
Related Projects in the Study Area
In addition to the proposed SR-210 Mixed Flow Lane Addition project (the project) the following
projects are planned within the limits of the project. These projects are included in the 2035
San Bernardino Traffic Analysis Model (SBTAM) and were reviewed in the development of the
Mixed Flow Lane Addition project traffic analysis modeling.
SR-210/Base Line Interchange Improvement Project
This project is included as a Financially Constrained Project (RTP ID 4M07007) in the SCAG
2012-2035 RTP. This improvement includes widening of at the ramps and ramp terminal
junctions and is included in both 2035 No Build and Build Model.
SR-210/Victoria Avenue Interchange Project
A Project Study Report/Project Development Support (PSR/PDS) for the SR-210/Victoria
Avenue Interchange was approved by Caltrans on April 8, 2011 to evaluate the feasibility of
constructing a new interchange within the city limits of Highland and San Bernardino on SR-210
at Victoria Avenue. This project is included as a Financially Constrained Project (RTP ID
4M0801) in the SCAG 2012-2035 RTP. This project is included in both the 2035 No Build and
Build Models.
SR-210 HOV Lane Addition Project
This project calls for the addition of one HOV lane in each direction between I-215 and I-10.
Based on the 2012-2035 RTP, the HOV project is also in the Financially Constrained Project
list. In order to assess the environmental impacts of the Mixed Flow Lane Addition project, the
HOV Lane Addition project was not included in the 2035 No Build model used in the analysis.
Consistent with the No Build assumption, the HOV Lane Addition project was similarly not
included in the 2035 Build model. This approach ensures consistency of assumptions used in
the evaluation of the traffic impacts for the Mixed Flow Lane Addition project.
3.0 ANALYSIS METHODOLOGY
This report documents the evaluation of the traffic operations of the SR-210 Mixed Flow Lane
Addition Project (the “project”) which is generally defined as the segment of SR-210 between
Highland Avenue/Arden Avenue and San Bernardino Avenue. The analysis evaluated Existing
(2012) conditions, Opening Year (2020) conditions and Horizon Year (2040) conditions.
In consultation with Caltrans District 8 staff, the project traffic operational analysis was
conducted in accordance with the procedures outlined in the 2010 Edition of the Highway
Capacity Manual which hereinafter will also be referred to as “HCM 2010” or “HCM”. The HCM
2010 offers a significant update to the analysis procedures outlined from the previous version,
HCM 2000.
As described in Volume 2 (“Uninterrupted Flow”) of the HCM 2010, and for purposes of
evaluating the proposed project, SR-210 will be divided into various segments for analysis.
Descriptions of the freeway facility components and the methodologies used to analyze them
are described below.
08-SBD-210
PM R25.0/R33.2
EA 0C700, Project No. 0812000164
SR-210 Mixed Flow Lane Addition Project 9
Traffic Operations Analysis Revised: February 2014
Basic Freeway Segments
A basic freeway segment is a section of the freeway mainline which is not within a ramp
influence area (i.e., not within 1,500 feet of a ramp junction) or weaving segment. Adding or
dropping a lane results in the termination of a basic freeway segment. Peak hour volumes on
basic freeway segments are analyzed using the methodology described in the HCM Chapter 11
(“Basic Freeway Segments”) and Highway Capacity Software (HCS 2010, Version 6.4).
The TOAR did not evaluate segments between off and on ramps (within the interchanges) since
mainline freeway segment operations within these areas will always result in levels of service as
good or better than the upstream mainline segments prior to the interchanges.
The upgraded HCS 2010, Version 6.4 implements and automates the HCM 2010 procedures
and includes modules to implement the new procedures for Basic Freeway Segments and will
be used in the evaluation of the proposed project. Table 1 provides the LOS criteria for basic
freeway segments characterized by three performance measures, namely: density in passenger
cars per mile per lane (pc/mi/ln), space mean speed in miles per hour (mi/h), and ratio of
demand flow rate (volume) to capacity (v/c).
According to the HCM 2010, “speed is a constant through a broad range of flows and the v/c
ratio is not directly discernible to road users (except at capacity), the service measure for basic
freeway segments is density.”
08-SBD-210
PM R25.0/R33.2
EA 0C700, Project No. 0812000164
SR-210 Mixed Flow Lane Addition Project 10
Traffic Operations Analysis Revised: February 2014
Table 1: LOS Criteria for Basic Freeway Segments
LOS Density (pc/mi/ln)
A ≤11
B >11-18
C >18-26
D >26-35
E >35-45
Demand exceeds capacity
F >45
Source: Exhibit 11-5 from Highway Capacity Manual 2010.
Determining free-flow speed (FFS)
According to the HCM, the freeway FFS is best measured in the field, however, sometimes it is
not possible to make field measurements e.g. future design for future facilities. In this instance,
the segment’s FFS may be estimated by using Equation 11-1 of the HCM, which is based on
the physical characteristics of the segment under study and is illustrated below:
FFS = 75.4 – fLW – fLC – 3.22TRD0.84
where
FFS = FFS of basic freeway segment (mi/h)
fLW = adjustment for lane width (mi/h)
fLC = adjustment for right-side lateral clearance (mi/h), and
TRD = total ramp density (ramps/mi)
Weave Segments
The HCM 2010 defines weaving as the crossing of two or more traffic streams traveling in the
same direction along a significant length of highway without the aid of traffic control devices or
guide signs. Weave segments occur when merge segments are closely followed by diverge
segments. The “close” condition implies that there is not sufficient distance between the merge
and diverge segments for them to operate independently from each other.
Peak hour volumes within the freeway weaving sections are analyzed using the methodology
contained in HCM Chapter 12 (“Freeway Weaving Segments”). A weaving segment’s
performance is primarily influenced by three key geometric characteristics, namely: length, width
and configuration. An eight-step HCM flowchart shown in Chapter 12, Exhibit 12-6 Weaving
Methodology Flowchart describes the basic steps that define the methodology for analyzing
freeway weaving segments.
The upgraded HCS 2010, Version 6.4 implements and automates the HCM 2010 procedures
and includes modules to implement the new procedures for Weave Segments and will be used
in the evaluation of the proposed project. The LOS criteria for weaving segments are described
in Table 2.
08-SBD-210
PM R25.0/R33.2
EA 0C700, Project No. 0812000164
SR-210 Mixed Flow Lane Addition Project 11
Traffic Operations Analysis Revised: February 2014
Table 2: LOS Criteria for Weaving Segments
LOS Density (pc/mi/ln)
A 0-10
B > 10-20
C > 20-28
D > 28-35
E > 35
F Demand exceeds capacity
Source: Exhibit 12-10 from Highway Capacity Manual 2010.
Determining weaving speeds
According to the HCM, the heart of the weaving segment methodology is the estimation of
average speeds of weaving and non-weaving vehicles in the weaving segment. These speeds
are estimated separately because they are affected by various factors and can be significantly
different from each other. The algorithm for predicting the average speed of weaving vehicles in
a weaving segment is illustrated by Equation 12-17 of the HCM.
In cases that require the FFS to be estimated, the methodology described in Chapter 11, Basic
Freeway Segments is used. The average speed of weaving vehicles within the weaving
segment is estimated by using Equations 12-8 and 12-9 of the HCM.
Freeway Merge and Diverge Segments
The following five-step HCM 2010 methodology is used to analyze ramp-freeway junctions
calibrated specifically for one-lane, right-side ramp freeway junctions applicable for merge and
diverge segments. Specific details of the computational steps and directions are provided in
Chapter 13 (“Freeway Merge and Diverge Segments”) of the HCM. For all other cases such as
two-lane ramp junctions, left side ramps and major merge and diverge configurations, the
analyses are conducted according to the procedures outlined in the Special Cases Section.
Step 1 – Specify Inputs and Convert Demand Volumes to Demand Flow.
Step 2 – Estimate the Approaching Flow Rate in Lanes 1 and 2 of the Freeway Immediately
Upstream of the Ramp Influence Area.
Step 3 – Estimate the Capacity of the Ramp-Freeway Junction and Compare with Demand Flow
Rates.
Step 4 – Estimate Density in the Ramp Influence Area and Determine the Prevailing LOS.
Step 5 – Estimate Speeds in the Vicinity of Ramp-Freeway Junctions.
The above steps are illustrated in the HCM 2010, Exhibit 13-4 Flowchart for Analysis of Ramp-
Freeway Junctions. According to the HCM, other freeway lanes may be affected by merging or
diverging maneuvers, but the defined area within 1,500 feet of the ramp junction generally
experiences the greatest impacts across all Level of Service. Based on Figures 504.2A and
504.2B in the Highway Design Manual (HDM), as per California design standards, the default
08-SBD-210
PM R25.0/R33.2
EA 0C700, Project No. 0812000164
SR-210 Mixed Flow Lane Addition Project 12
Traffic Operations Analysis Revised: February 2014
acceleration and deceleration lengths employed in the evaluation of ramp merge and diverge
areas are 600 feet and 141 feet, respectively.
The upgraded HCS 2010, Version 6.4 implements and automates the HCM 2010 procedures
described above and includes modules to implement the new procedures for Freeway Merge
and Diverge Segments and will be used in the evaluation of the proposed project. The LOS
criteria for merge and diverge segments are described in Table 3 below.
Table 3: LOS Freeway Merge and Diverge Segments
LOS Density (pc/mi/ln) Comments
A 0-10 Unrestricted operations
B > 10-20
Merging and diverging maneuvers noticeable to
drivers
C > 20-28 Influence area speeds begin to decline
D > 28-35 Influence area turbulence becomes intrusive
E > 35 Turbulence felt by virtually all drivers
F Demand exceeds capacity Ramp and freeway queues form
Source: Exhibit 13-2 from Highway Capacity Manual 2010.
Determining free-flow speed (FFS)
The HCM 2010 recommends that the freeway FFS is best measured in the field. However, if
field measurements are not available, FFS for Freeway Merge and Diverge Segments may be
estimated using the methodology used to determine the FFS for basic freeway segments
presented in Chapter 11, Basic Freeway Segments.
08-SBD-210
PM R25.0/R33.2
EA 0C700, Project No. 0812000164
SR-210 Mixed Flow Lane Addition Project 13
Traffic Operations Analysis Revised: February 2014
4.0 EXISTING (2012) TRAFFIC CONDITIONS
The existing SR-210 mainline within the project limits is generally a four-lane freeway facility.
Freeway ramps are provided at Highland Avenue and Arden Avenue, freeway connectors are
provided at the SR-330 Junction, and interchanges currently exist at Base Line, 5th Street and
San Bernardino Avenue. This section of the report presents the existing freeway operations
analysis results.
Existing Volumes
Existing mainline counts were developed based on weekday (Tuesday, Wednesday, and
Thursday) data from Caltrans’ Traffic Data Report (15 Minute Loop Data) for the period between
October 16 and October 25, 2012. The 15 minute loop counts are provided for five locations for
AM and PM peak hours, 6-9 AM and 3-7 PM respectively. The five locations along SR-210
mainline are located at Post Miles (PM) 26.25, 28.7, 30.1, 31.4 and 32.6. For each location, the
maximum hourly flow within the peak period is selected and an average is taken for all the days
that data is available. The Existing 2012 freeway mainline traffic count data sheets are provided
in Appendix C. Additionally, the SR-210 Traffic Volume summary is provided in Appendix C that
shows the development of the traffic volume data from Existing 2012 to Year 2020 and Year
2040 conditions.
The 2012 ramp volume development methodology was conducted following the development
and finalization of the existing SR-210 mainline flow along the freeway study segments. A
combination of resources (including the SR-210 2008 PSR/PDS and 2008 SBTAM baseline
forecast) were consulted to develop the ramp volumes along the study corridor. Since no
existing ramp counts are available at the study corridor ramps, the SR-210 2008 PSR/PDS
ramp and freeway flow data were utilized to establish the ramp-to-freeway volume split at each
interchange. The Existing 2012 ramp volumes developed for this report were calculated based
on either the SR-210 2008 PSR/PDS split or by applying flow conservation along the freeway.
Truck percentages were derived from the Caltrans Traffic Data Branch 2010 database and a
passenger car equivalent (PCE) factor of 1.5 was applied to trucks in the Highway Capacity
Software (HCS) analysis. Since ramp truck percentage values were not available, the mainline
truck percentage assumptions were similarly used in the weaving, merge and diverge analysis.
Existing mainline ADT data were developed based on the existing peak hour directional
volumes described above and using peak hour and ADT relationship using published Caltrans
Traffic Database K and D factors table provided in Appendix C. Key steps and factors in the
ADT volume development include the following:
AADT = PHV/KxD
08-SBD-210
PM R25.0/R33.2
EA 0C700, Project No. 0812000164
SR-210 Mixed Flow Lane Addition Project 14
Traffic Operations Analysis Revised: February 2014
where
K = The percentage of the AADT in both directions during the peak hour. Values in the Caltrans
table are derived by dividing the measured 2-way PHV by the AADT.
D = D factor. The percentage of traffic in the peak direction during the peak hour. Values in the
traffic count book are derived by dividing the measured PHV by the sum of both directions of
travel during the peak hour.
KxD = The product of K and D. The percentage of AADT in the peak direction during the peak
hour. Values in the Caltrans table are derived by dividing the measured 1-way PHV by the
AADT.
PHV = Peak Hour Volume in the peak direction. A one way volume in vehicles per hour (vph)
as used here. The PHV is analogous to the DDHV as used for design purposes.
AADT = Annual Average Daily Traffic in vehicles per day. (Derived here in this TOAR as ADT)
• Identify applicable K and D factors within the study area – Existing 2011 SR-210 K & D
Factor at PM 31.72 between the San Bernardino Avenue and 5th Street-Greenspot
Road. These are the only available published K and D factors for the project study
segments. The source table for the K and D factors are provided in Appendix C.
• Apply K and D factors to the previously developed peak hour ramp volumes and
compare ADT results between corresponding movements in the eastbound and
westbound direction. For analysis purposes, it was conservaltively assumed that the
higher calculated directional ADT was selected and applied to both directions.
Theoretically, opposing directional ADT’s are anticipated to be equal by direction on a
daily basis.
• Using the mainline segment between San Bernardino Avenue and 5th Street-Greenspot
Road as the starting point, the mainline ADT at this location was developed using the
aforementioned K and D factors. The resulting mainline ADT was propagated through
the study segments using the principles of flow conservation and taking into
consideration the derived ramp ADTs.
Existing Truck Data
Based on the review of the latest 2011 and 2010 truck volume data from Caltrans Traffic Data
Branch, the review indicated no usable 2011 data for the SR-210 freeway study segments
within the project limits. However, the 2010 truck count data showed a combination of verified
and estimated truck counts within the project limits. Additional research yielded no further
information beyond those presented in the Caltrans Traffic Data Branch 2010 truck count data.
Using the 2010 truck data, we have used existing and future year truck percentage of 7 percent
between Highland Avenue and SR-330 and 6 percent between SR-330 and San Bernardino
08-SBD-210
PM R25.0/R33.2
EA 0C700, Project No. 0812000164
SR-210 Mixed Flow Lane Addition Project 15
Traffic Operations Analysis Revised: February 2014
Avenue for both mainline and ramp area analysis. The aforementioned truck percentages were
similarly adopted and used in the TI Analysis.
Existing Traffic Conditions
Figure 2 illustrates the roadway lane geometrics for existing conditions. Figure 3 illustrates the
SR-210 mainline and ramp ADT and peak hour volumes from Caltrans District 8. The existing
2012 count data are utilized as the starting point in the development of Opening Year 2020 and
Horizon Year 2040 traffic forecast.
HCM 2010 operational analysis was conducted for existing conditions for the SR-210 study
mainline, weaving, ramp merge and diverge areas within the project study limits. Tables 4 and 5
summarize the density and level of service results of the analysis performed at the project study
locations. The traffic analysis worksheets are provided in Appendix B.
SR-210 Mixed Flow Lane Addition
(PM R26.0/R33.2) - EA 0C700
K:2012SR-210
Mixed
Flow
Lane
AdditionFigures.ai
Governments
SANBAG
Working T
ogether
Governments
SANBAG
Working T
ogether
INTERSTATE
CALIFORNIA
10
INTERSTATE
CALIFORNIA
10
CALIFORNIA
210
CALIFORNIA
210
CALIFORNIA
330
FIFTH ST
BASE LINE
HIGHLAND AVE
PIONEER AVE
SAN BERNARDINO AVE
ARDEN
AVE
VICTORIA
AVE
ALABAMA
ST
SANTA ANA RIVER
GREENSPOT RD
NOT TO SCALE
Figure 2
Existing (2012) Freeway Mainline and
Ramp Geometrics
3
3
3
4
2 2
2
2
2
2
3
3
2
2
LEGEND
X Number of Lanes
SR-210 Mixed Flow Lane Addition
(PM R26.0/R33.2) - EA 0C700
K:2012SR-210
Mixed
Flow
Lane
AdditionFigures.ai
Governments
SANBAG
Working T
ogether
Governments
SANBAG
Working T
ogether
INTERSTATE
CALIFORNIA
10
INTERSTATE
CALIFORNIA
10
CALIFORNIA
210
CALIFORNIA
210
CALIFORNIA
330
FIFTH ST
BASE LINE
HIGHLAND AVE
PIONEER AVE
SAN BERNARDINO AVE
ARDEN
AVE
VICTORIA
AVE
ALABAMA
ST
SANTA ANA RIVER
GREENSPOT RD
NOT TO SCALE
41,300
3,026
3,305
41,300
3,359
3,394
10,000
633
691 3,400
449
282
34,700
3,176
2,985
4,800
544
398
5,000
190
409
34,900
2,823
2,996
9,400
552
522
38,500
2,640
3,038
4,300
209
266
11,900
652
944
46,100
3,083
3,716
8,800
615
720
6,800
194
778
44,100
2,663
3,774
5,800
735
480
10,000
864
786
4,800
361
287
5,000
380
228
34,900
2,779
2,948
5,800
252
347
9,400
819
554
4,300
375
381
11,900
1,032
820
46,100
4,003
3,594
8,800
568
614
6,800
590
466
44,100
4,025
3,446
38,500
3,346
3,155
34,700
2,760
3,007
3,400
598
488
Figure 3
Existing (2012) Freeway Mainline and
Ramp Volumes
LEGEND
XXXXX Average Daily Traffic
XXXX AM Peak Hour
XXXX PM Peak Hour
08-SBD-210
PM R25.0/R33.2
EA 0C700, Project No. 0812000164
SR-210 Mixed Flow Lane Addition Project 18
Traffic Operations Analysis Revised: February 2014
Table 4:
Existing (2012) - SR-210 Eastbound Mainline and Ramp Operations LOS
Freeway Mainline Segment /
Ramp Connection
Freeway Mainline / Ramp Connection
Merge/Diverge Analyses
Existing (2012)
Facility Lanes
AM Peak PM Peak
Den. LOS Den. LOS
SR-210 between Sterling Avenue and Highland
Avenue-Arden Avenue
Freeway 3MF 17.1 B 18.5 C
SR-210 Highland Avenue Off-ramp
Trap
Lane
2MF/
1L
Trap
N/A3
N/A3
N/A3
N/A3
SR-210 Arden Avenue On-ramp Merge
2MF/
1L
Ramp
25.1 C 27.0 C
SR-210 between Highland Avenue-Arden
Avenue and SR-330
Freeway 2MF 23.4 C 25.5 C
SR-210 SR-330 Connector Diverge
2MF/
1L
Decel
19.8 B 21.8 C
SR-210 between SR-330 and Base Line Weave
2MF/
1 Aux
17.8 B 18.4 B
SR-210 Base Line On-ramp Merge
2MF/
1L
Ramp
29.9 D 28.1 D
SR-210 between Base Line and 5th Street-
Greenspot Road
Freeway 2MF 29.4 D 26.9 D
SR-210 5th Street Off-ramp Diverge
2MF/
1L
Ramp
28.2 D 26.1 C
SR-210 5th Street On-ramp Merge
2MF/
1L
Ramp
35.4 E 31.7 D
SR-210 between 5th Street-Greenspot Road
and San Bernardino Avenue
Freeway 2MF 39.1 E 32.1 D
SR-210 San Bernardino Avenue Off-ramp Diverge
3MF/
1L
Ramp
28.5 D 26.3 C
SR-210 San Bernardino Avenue On-ramp Merge
4MF/
1L
Ramp
18.2 B 15.5 B
SR-210 between San Bernardino Avenue and
I-10 Freeway
Freeway 4MF 17.0 B 14.4 B
Notes:
1. “Highland Avenue-Arden Avenue” refers to SR-210 off-ramps to Highland Avenue and SR-210 on-ramps from
Arden Avenue (EB) and both Arden Avenue/Highland Avenue (WB).
2. “5th Street-Greenspot Road” refers to SR-210 off/on-ramps to 5th Street (EB) and SR-210 off/on-ramps to Greenspot
Road (WB).
3. Ramp junction analysis is not applicable for lane drop (trap) lane or lane addition connection to freeway.
08-SBD-210
PM R25.0/R33.2
EA 0C700, Project No. 0812000164
SR-210 Mixed Flow Lane Addition Project 19
Traffic Operations Analysis Revised: February 2014
Table 5:
Existing (2012) - SR-210 Westbound Mainline and Ramp Operations LOS
Freeway Mainline Segment /
Ramp Connection
Freeway Mainline / Ramp Connection
Merge/Diverge Analyses
Existing (2012)
Facility Lanes
AM Peak PM Peak
Den. LOS Den. LOS
SR-210 between I-10 Freeway and
San Bernardino Avenue
Freeway 3MF 15.0 B 21.0 C
SR-210 San Bernardino Avenue Off-ramp Diverge
3MF/
1L
Ramp
20.6 C 27.5 C
SR-210 San Bernardino Avenue On-ramp Merge
2MF/
1L
Ramp
27.8 C 32.8 D
SR-210 between San Bernardino Avenue and
5th Street-Greenspot Road
Freeway 2MF 26.5 D 33.8 D
SR-210 Greenspot Road Off-ramp Diverge
2MF/
1L
Ramp
32.0 D 37.6 E
SR-210 Greenspot Road On-ramp Merge
2MF/
1L
Ramp
24.2 C 27.3 C
SR-210 between 5th Street-Greenspot Road
and Base Line
Freeway 2MF 22.3 C 25.7 C
SR-210 Base Line Off-ramp Diverge
2MF/
1L
Ramp
21.5 C 24.9 C
SR-210 between Base Line and SR-330 Weave
2MF/
1 Aux
18.8 B 19.2 B
SR-210 SR-330 Connector Merge
2MF/
1L
Ramp
28.8 D 26.9 C
SR-210 between SR-330 and Highland
Avenue-Arden Avenue
Freeway 2MF 27.6 D 25.3 C
SR-210 Highland Avenue Off-ramp Diverge
2MF/
1L
Ramp
33.1 D 31.0 D
Notes:
1. “Highland Avenue-Arden Avenue” refers to SR-210 off-ramps to Highland Avenue and SR-210 on-ramps from
Arden Avenue (EB) and both Arden Avenue/Highland Avenue (WB).
2. “5th Street-Greenspot Road” refers to SR-210 off/on-ramps to 5th Street (EB) and SR-210 off/on-ramps to Greenspot
Road (WB).
3. Ramp junction analysis is not applicable for lane drop (trap) lane or lane addition connection to freeway.
08-SBD-210
PM R25.0/R33.2
EA 0C700, Project No. 0812000164
SR-210 Mixed Flow Lane Addition Project 20
Traffic Operations Analysis Revised: February 2014
5.0 OPENING YEAR (2020) TRAFFIC CONDITIONS
The purpose of this chapter is to present and document the forecast future traffic conditions on
the anticipated Opening Year (2020) of the proposed project. Opening year traffic volumes
were developed for Opening Year (2020) No Build and Build conditions. Under Opening Year
(2020) No Build Traffic Conditions, it was assumed that SR-210 would be geometrically identical
to existing conditions and the other related SR-210 projects are assumed to be unconstructed
and not implemented.
Opening Year (2020) mainline and ramp traffic count data has been developed using
annualized growth factors described previously in Chapter 2 of this report. During Opening year
(2020) traffic conditions, volume proportion/flow conservation has been maintained during the
development of future mainline traffic count data and the truck percentage values for the
mainline were also assumed for ramp traffic and was used in the weaving, merge and diverge
analysis. In addition, the previously discussed truck percentages and the 1.5 PCE factor for
trucks had been maintained for use in the Opening Year (2020) traffic operations analysis.
Opening Year (2020) - No Build Traffic Conditions
Figure 4 illustrates Opening Year (2020) - No Build Freeway Mainline and Ramp Geometric
configurations. Figure 5 illustrates Opening Year (2020) – No Build Freeway Mainline and
Ramp ADT and peak hour traffic volumes.
An operational analysis was conducted for the SR-210 mainline, ramp merge and diverge areas
within the project study area and the results are summarized in Table 6 for the eastbound SR-
210 direction and in Table 7 for the westbound SR-210 direction.
SR-210 Mixed Flow Lane Addition
(PM R26.0/R33.2) - EA 0C700
K:2012SR-210
Mixed
Flow
Lane
AdditionFigures.ai
Governments
SANBAG
Working T
ogether
Governments
SANBAG
Working T
ogether
INTERSTATE
CALIFORNIA
10
INTERSTATE
CALIFORNIA
10
CALIFORNIA
210
CALIFORNIA
210
CALIFORNIA
330
FIFTH ST
BASE LINE
HIGHLAND AVE
PIONEER AVE
SAN BERNARDINO AVE
ARDEN
AVE
VICTORIA
AVE
ALABAMA
ST
SANTA ANA RIVER
GREENSPOT RD
NOT TO SCALE
Figure 4
Opening Year (2020) No Build Freeway
Mainline and Ramps Geometrics
3
3
3
4
2
2
2
2
3
3
2
2
2
2
LEGEND
X Number of Lanes
SR-210 Mixed Flow Lane Addition
(PM R26.0/R33.2) - EA 0C700
K:2012SR-210
Mixed
Flow
Lane
AdditionFigures.ai
Governments
SANBAG
Working T
ogether
Governments
SANBAG
Working T
ogether
INTERSTATE
CALIFORNIA
10
INTERSTATE
CALIFORNIA
10
CALIFORNIA
210
CALIFORNIA
210
CALIFORNIA
330
FIFTH ST
BASE LINE
HIGHLAND AVE
PIONEER AVE
SAN BERNARDINO AVE
ARDEN
AVE
VICTORIA
AVE
ALABAMA
ST
SANTA ANA RIVER
GREENSPOT RD
NOT TO SCALE
47,900
3,600
3,840
47,900
3,870
4,020
12,600
810
1,000 4,400
520
360
39,700
3,580
3,380
5,500
580
450
5,200
200
430
39,400
3,200
3,360
9,800
560
530
42,000
2,980
3,300
4,700
210
280
12,200
670
970
49,500
3,440
3,990
9,600
700
790
7,800
260
870
47,700
3,000
4,070
7,200
780
590
12,600
1,090
1,020
5,500
400
340
5,200
440
240
39,400
3,190
3,270
7,200
390
370
9,800
850
570
4,700
410
470
12,200
1,060
860
49,500
4,300
3,860
9,600
610
650
7,800
680
530
47,700
4,370
3,740
42,000
3,650
3,470
39,700
3,150
3,370
4,400
640
550
Figure 5
Opening Year (2020) No Build Freeway
Mainline and Ramp Volumes
LEGEND
XXXXX Average Daily Traffic
XXXX AM Peak Hour
XXXX PM Peak Hour
08-SBD-210
PM R25.0/R33.2
EA 0C700, Project No. 0812000164
SR-210 Mixed Flow Lane Addition Project 23
Traffic Operations Analysis Revised: February 2014
Table 6:
Opening Year (2020) SR-210 - No Build Eastbound Mainline and Ramp Operations LOS
Freeway Mainline Segment /
Ramp Connection
Freeway Mainline / Ramp Connection
Merge/Diverge Analyses
Opening Year (2020)
Facility Lanes
AM Peak PM Peak
Den. LOS Den. LOS
SR-210 between Sterling Avenue and Highland
Avenue-Arden Avenue
Freeway 3MF 20.3 C 21.5 C
SR-210 Highland Avenue Off-ramp
Trap
Lane
2MF/
1L
Trap
N/A3
N/A3
N/A3
N/A3
SR-210 Arden Avenue On-ramp Merge
2MF/
1L
Ramp
28.4 D 30.1 D
SR-210 between Highland Avenue-Arden
Avenue and SR-330
Freeway 2MF 27.3 D 29.5 D
SR-210 SR-330 Connector Diverge
2MF/
1L
Decel
23.5 C 25.2 C
SR-210 between SR-330 and Base Line Weave
2MF/
1 Aux
20.7 C 20.6 C
SR-210 Base Line On-ramp Merge
2MF/
1L
Ramp
32.5 D 30.8 D
SR-210 between Base Line and 5th Street-
Greenspot Road
Freeway 2MF 33.4 D 30.5 D
SR-210 5th Street Off-ramp Diverge
2MF/
1L
Ramp
31.1 D 29.0 D
SR-210 5th Street On-ramp Merge
2MF/
1L
Ramp
--* F 33.9 D
SR-210 between 5th Street-Greenspot Road
and San Bernardino Avenue
Freeway 2MF 45.3 F 36.0 E
SR-210 San Bernardino Avenue Off-ramp Diverge
3MF/
1L
Ramp
30.0 D 27.7 C
SR-210 San Bernardino Avenue On-ramp Merge
4MF/
1L
Ramp
19.8 B 16.8 B
SR-210 between San Bernardino Avenue and
I-10 Freeway
Freeway 4MF 18.4 C 15.6 B
Notes: --* = Demand exceeds capacity.
1. “Highland Avenue-Arden Avenue” refers to SR-210 off-ramps to Highland Avenue and SR-210 on-ramps from
Arden Avenue (EB) and both Arden Avenue/Highland Avenue (WB).
2. “5th Street-Greenspot Road” refers to SR-210 off/on-ramps to 5th Street (EB) and SR-210 off/on-ramps to Greenspot
Road (WB).
3. Ramp junction analysis is not applicable for lane drop (trap) lane or lane addition connection to freeway.
08-SBD-210
PM R25.0/R33.2
EA 0C700, Project No. 0812000164
SR-210 Mixed Flow Lane Addition Project 24
Traffic Operations Analysis Revised: February 2014
Table 7:
Opening Year (2020) SR-210 - No Build Westbound Mainline and Ramp Operations LOS
Freeway Mainline Segment /
Ramp Connection
Freeway Mainline / Ramp Connection
Merge/Diverge Analyses
Opening Year (2020)
Facility Lanes
AM Peak PM Peak
Den. LOS Den. LOS
SR-210 between I-10 Freeway and
San Bernardino Avenue
Freeway 3MF 16.9 B 22.7 C
SR-210 San Bernardino Avenue Off-ramp Diverge
3MF/
1L
Ramp
22.6 C 29.2 D
SR-210 San Bernardino Avenue On-ramp Merge
2MF/
1L
Ramp
30.8 D 35.1 E
SR-210 between San Bernardino Avenue and
5th Street-Greenspot Road
Freeway 2MF 30.6 D 38.1 E
SR-210 Greenspot Road Off-ramp Diverge
2MF/
1L
Ramp
35.4 E 40.2 E
SR-210 Greenspot Road On-ramp Merge
2MF/
1L
Ramp
27.1 C 29.5 D
SR-210 between 5th
Street-Greenspot Road
and Base Line
Freeway 2MF 25.4 C 28.5 D
SR-210 Base Line Off-ramp Diverge
2MF/
1L
Ramp
24.7 C 27.4 C
SR-210 between Base Line and SR-330 Weave
2MF/
1 Aux
21.7 C 22.0 C
SR-210 SR-330 Connector Merge
2MF/
1L
Ramp
32.2 D 30.2 D
SR-210 between SR-330 and Highland
Avenue-Arden Avenue
Freeway 2MF 32.6 D 29.6 D
SR-210 Highland Avenue Off-ramp Diverge
2MF/
1L
Ramp
36.9 E 34.6 D
Notes:
1. “Highland Avenue-Arden Avenue” refers to SR-210 off-ramps to Highland Avenue and SR-210 on-ramps from
Arden Avenue (EB) and both Arden Avenue/Highland Avenue (WB).
2. “5th Street-Greenspot Road” refers to SR-210 off/on-ramps to 5th Street (EB) and SR-210 off/on-ramps to Greenspot
Road (WB).
3. Ramp junction analysis is not applicable for lane drop (trap) lane or lane addition connection to freeway.
08-SBD-210
PM R25.0/R33.2
EA 0C700, Project No. 0812000164
SR-210 Mixed Flow Lane Addition Project 25
Traffic Operations Analysis Revised: February 2014
Opening Year 2020 - Build Traffic Conditions
Figure 6 illustrates Opening Year (2020) – Build Freeway Mainline and Ramp Geometric
configurations. Figure 7 illustrates Opening Year (2020) – Build Freeway Mainline and Ramp
ADT and peak hour traffic volumes.
Similar to Opening Year (2020) – No Build conditions, an operational analysis was conducted
for Build Conditions of the SR-210 mainline, ramp merge and diverge areas within the project
study area and the results are summarized in Table 8 for the eastbound SR-210 direction and in
Table 9 for the westbound SR-210 direction.
SR-210 Mixed Flow Lane Addition
(PM R26.0/R33.2) - EA 0C700
K:2012SR-210
Mixed
Flow
Lane
AdditionFigures.ai
Governments
SANBAG
Working T
ogether
Governments
SANBAG
Working T
ogether
INTERSTATE
CALIFORNIA
10
INTERSTATE
CALIFORNIA
10
CALIFORNIA
210
CALIFORNIA
210
CALIFORNIA
330
FIFTH ST
BASE LINE
HIGHLAND AVE
PIONEER AVE
SAN BERNARDINO AVE
ARDEN
AVE
VICTORIA
AVE
ALABAMA
ST
SANTA ANA RIVER
GREENSPOT RD
NOT TO SCALE
Figure 6
Opening Year (2020) Build Freeway
Mainline and Ramp Geometrics
3
3
3
4 3
3
3
3
3
3
4
4
4
4
LEGEND
X Number of Lanes
SR-210 Mixed Flow Lane Addition
(PM R26.0/R33.2) - EA 0C700
K:2012SR-210
Mixed
Flow
Lane
AdditionFigures.ai
Governments
SANBAG
Working T
ogether
Governments
SANBAG
Working T
ogether
INTERSTATE
CALIFORNIA
10
INTERSTATE
CALIFORNIA
10
CALIFORNIA
210
CALIFORNIA
210
CALIFORNIA
330
FIFTH ST
BASE LINE
HIGHLAND AVE
PIONEER AVE
SAN BERNARDINO AVE
ARDEN
AVE
VICTORIA
AVE
ALABAMA
ST
SANTA ANA RIVER
GREENSPOT RD
NOT TO SCALE
49,200
3,830
4,230
47,700
4,250
4,570
13,200
740
690 5,600
560
460
41,600
4,070
4,340
6,600
610
540
5,500
210
450
40,500
3,670
4,250
10,400
580
630
44,900
3,460
4,390
5,500
270
450
14,200
760
1,170
53,600
3,950
5,110
13,300
800
1,090
7,800
270
870
48,100
3,420
4,890
6,000
790
490
13,200
1,150
1,160
6,600
410
390
5,500
440
320
40,500
3,400
3,730
6,000
340
510
10,400
900
630
5,500
430
560
14,200
1,120
930
53,600
4,650
4,220
13,300
650
680
7,800
680
480
48,100
4,680
4,020
44,900
3,960
3,850
41,600
3,370
3,800
5,600
690
730
Figure 7
Opening Year (2020) Build Freeway
Mainline and Ramp Volumes
LEGEND
XXXXX Average Daily Traffic
XXXX AM Peak Hour
XXXX PM Peak Hour
08-SBD-210
PM R25.0/R33.2
EA 0C700, Project No. 0812000164
SR-210 Mixed Flow Lane Addition Project 28
Traffic Operations Analysis Revised: February 2014
Table 8:
Opening Year (2020) SR-210 - Build Eastbound Mainline and Ramp Operations LOS
Freeway Mainline Segment /
Ramp Connection
Freeway Mainline / Ramp Connection
Merge/Diverge Analyses
Opening Year (2020)
Facility Lanes
AM Peak PM Peak
Den. LOS Den. LOS
SR-210 between Sterling Avenue and Highland
Avenue-Arden Avenue
Freeway 3MF 21.6 C 23.7 C
SR-210 Highland Avenue Off-ramp Diverge
3MF/
2L
Ramp
19.4 B 20.9 C
SR-210 Arden Avenue On-ramp Merge
3MF/
1L
Ramp
21.0 C 23.1 C
SR-210 between Highland Avenue-Arden
Avenue and SR-330
Freeway 3MF 19.0 C 21.2 C
SR-210 SR-330 Connector Diverge
3MF/
1L
Decel
15.7 B 17.7 B
SR-210 between SR-330 and Base Line Weave
3MF/
1 Aux
16.3 B 17.6 B
SR-210 Base Line On-ramp Merge
3MF/
1 Aux
N/A4
N/A4
N/A4
N/A4
SR-210 between Base Line and 5th Street-
Greenspot Road
Weave
3MF/
1 Aux
21.3 C 20.1 C
SR-210 5th Street Off-ramp Diverge
3MF/
1 Aux
N/A4
N/A4
N/A4
N/A4
SR-210 5th Street On-ramp Merge
3MF/
1L
Accel
28.7 D 25.6 C
SR-210 between 5th Street-Greenspot Road
and San Bernardino Avenue
Freeway 3MF 26.6 D 23.5 C
SR-210 San Bernardino Avenue Off-ramp Diverge
3MF/
1L
Ramp
31.7 D 29.5 D
SR-210 San Bernardino Avenue On-ramp Merge
4MF/
1L
Ramp
20.9 C 17.5 B
SR-210 between San Bernardino Avenue and
I-10 Freeway
Freeway 4MF 19.7 C 16.8 B
Notes:
1. “Highland Avenue-Arden Avenue” refers to SR-210 off-ramps to Highland Avenue and SR-210 on-ramps from
Arden Avenue (EB) and both Arden Avenue/Highland Avenue (WB).
2. “5th Street-Greenspot Road” refers to SR-210 off/on-ramps to 5th Street (EB) and SR-210 off/on-ramps to Greenspot
Road (WB).
3. Ramp junction analysis is not applicable for lane drop (trap) lane or lane addition connection to freeway.
4. Ramp junction analysis is not applicable for ramp connections in weave segments.
08-SBD-210
PM R25.0/R33.2
EA 0C700, Project No. 0812000164
SR-210 Mixed Flow Lane Addition Project 29
Traffic Operations Analysis Revised: February 2014
Table 9:
Opening Year (2020) SR-210 – Build Westbound Mainline and Ramp Operations LOS
Freeway Mainline Segment /
Ramp Connection
Freeway Mainline / Ramp Connection
Merge/Diverge Analyses
Opening Year (2020)
Facility Lanes
AM Peak PM Peak
Den. LOS Den. LOS
SR-210 between I-10 Freeway and
San Bernardino Avenue
Freeway 3MF 19.2 C 28.0 D
SR-210 San Bernardino Avenue Off-ramp Diverge
3MF/
1L
Ramp
24.9. C 33.0 D
SR-210 San Bernardino Avenue On-ramp Merge
3MF/
1L
Ramp
24.2 C 30.6 D
SR-210 between San Bernardino Avenue and
5th Street-Greenspot Road
Freeway 3MF 22.2 C 29.7 D
SR-210 Greenspot Road Off-ramp Diverge
3MF/
1L
Ramp
28.6 D 34.6 D
SR-210 Greenspot Road On-ramp Merge
3MF/
1 Aux
N/A4
N/A4
N/A4
N/A4
SR-210 between 5th Street-Greenspot Road
and Base Line
Weave
3MF/
1 Aux
17.5 B 23.0 C
SR-210 Base Line Off-ramp Diverge
3MF/
1 Aux
N/A4
N/A4
N/A4
N/A4
SR-210 between Base Line and SR-330 Weave
3MF/
1 Aux
18.5 B 20.6 C
SR-210 SR-330 Connector Merge
3MF/
1L
Ramp
24.4 C 25.3 C
SR-210 between SR-330 and Highland
Avenue-Arden Avenue
Freeway 3MF 23.0 C 24.4 C
SR-210 Highland Avenue Off-ramp Diverge
3MF/
1L
Ramp
28.7 D 29.8 D
Notes:
1. “Highland Avenue-Arden Avenue” refers to SR-210 off-ramps to Highland Avenue and SR-210 on-ramps from
Arden Avenue (EB) and both Arden Avenue/Highland Avenue (WB).
2. “5th Street-Greenspot Road” refers to SR-210 off/on-ramps to 5th Street (EB) and SR-210 off/on-ramps to Greenspot
Road (WB).
3. Ramp junction analysis is not applicable for lane drop (trap) lane or lane addition connection to freeway.
4. Ramp junction analysis is not applicable for ramp connections in weave segments.
08-SBD-210
PM R25.0/R33.2
EA 0C700, Project No. 0812000164
SR-210 Mixed Flow Lane Addition Project 30
Traffic Operations Analysis Revised: February 2014
6.0 HORIZON YEAR (2040) TRAFFIC CONDITIONS
The purpose of this chapter is to present and document the forecast future traffic conditions on
the anticipated Horizon Year (2040) of the proposed project. Future year traffic volumes were
developed for the Horizon Year (2040) No Build and Build conditions.
As part of the Horizon Year (2040) conditions, the proposed SR-210/Victoria Avenue
Interchange could be potentially in-place by year 2040. However, since the proposed Victoria
Avenue Interchange is currently under study and refinement, analysis of the interchange is not
included due to the lack of finalized geometric configuration assumptions for the interchange
itself and the adjacent interchange ramp systems. A Project Study Report/Project Development
Support (PSR/PDS) for the SR-210/Victoria Avenue Interchange was approved by Caltrans on
April 8, 2011 to evaluate the feasibility of constructing a new interchange within the city limits of
Highland and San Bernardino on SR-210 at Victoria Avenue. The purpose of the new
interchange would be to improve access to business and entertainment facilities in the Victoria
Avenue corridor, such as the San Bernardino International Airport (SBIA) and the San Manuel
Band of Mission Indians establishments.
Consistent with the previous analysis scenario assumptions, Horizon Year (2040) mainline and
ramp traffic count data were developed using annualized growth factors described previously in
Chapter 2 of this report. During Horizon Year (2040) traffic conditions, volume proportion/flow
conservation had been maintained in the development of future mainline traffic volume. The
truck percentage value for mainline were similarly assumed for ramp traffic and was used in the
weaving, merge and diverge analysis. The PCE factor of 1.5 had been similarly maintained for
use in the Horizon Year (2040) traffic operations analysis.
The following analysis provides the evaluation of 2040 No Build and Build project conditions.
Horizon Year (2040) - No Build Traffic Conditions
Figure 8 illustrates Horizon Year (2040) – No Build Freeway Mainline and Ramp Geometric
configurations. Figure 9 illustrates Horizon Year (2040) – No Build Freeway Mainline and
Ramp ADT and peak hour traffic volumes.
An operational analysis was conducted for the SR-210 mainline, ramp merge and diverge areas
within the project study area and the results are summarized in Table 10 for the eastbound SR-
210 direction and in Table 11 for the westbound SR-210 direction.
SR-210 Mixed Flow Lane Addition
(PM R26.0/R33.2) - EA 0C700
K:2012SR-210
Mixed
Flow
Lane
AdditionFigures.ai
Governments
SANBAG
Working T
ogether
Governments
SANBAG
Working T
ogether
INTERSTATE
CALIFORNIA
10
INTERSTATE
CALIFORNIA
10
CALIFORNIA
210
CALIFORNIA
210
CALIFORNIA
330
FIFTH ST
BASE LINE
HIGHLAND AVE
PIONEER AVE
SAN BERNARDINO AVE
ARDEN
AVE
VICTORIA
AVE
ALABAMA
ST
SANTA ANA RIVER
GREENSPOT RD
NOT TO SCALE
Figure 8
Horizon Year (2040) No Build Freeway Mainline
and Ramp Geometrics
3
3
3
2
2
2
2
2
2
2
2
3
3
2
2
4
LEGEND
X Number of Lanes
SR-210 Mixed Flow Lane Addition
(PM R26.0/R33.2) - EA 0C700
K:2012SR-210
Mixed
Flow
Lane
AdditionFigures.ai
Governments
SANBAG
Working T
ogether
Governments
SANBAG
Working T
ogether
INTERSTATE
CALIFORNIA
10
INTERSTATE
CALIFORNIA
10
CALIFORNIA
210
CALIFORNIA
210
CALIFORNIA
330
FIFTH ST
BASE LINE
HIGHLAND AVE
PIONEER AVE
SAN BERNARDINO AVE
ARDEN
AVE
VICTORIA
AVE
ALABAMA
ST
SANTA ANA RIVER
GREENSPOT RD
NOT TO SCALE
60,300
5,040
5,190
60,300
5,150
5,500
13,400
700
1,100 4,600
390
380
51,500
4,600
4,290
2,600
310
190
8,300
550
680
57,200
4,840
4,780 7,200
660
590
6,700
240
490
51,000
4,180
4,190
10,800
600
570
51,500
3,880
3,910
5,600
220
300
13,100
710
1,050
59,000
4,370
4,660
11,800
930
970
10,600
410
1,110
57,800
3,850
4,800
10,300
900
850
13,400
960
850
7,200
480
460
6,700
580
280
51,000
4,270
4,110
10,300
740
440
10,800
940
600
5,600
490
680
13,100
1,140
970
59,000
5,120
4,560
11,800
710
740
10,600
920
710
57,800
5,330
4,530
51,500
4,470
4,270
51,500
4,170
4,290
4,600
540
400
57,200
4,620
4,740
8,300
680
750
2,600
230
300
Figure 9
Horizon Year (2040) No Build Freeway
Mainline and Ramp Volumes
LEGEND
XXXXX Average Daily Traffic
XXXX AM Peak Hour
XXXX PM Peak Hour
08-SBD-210
PM R25.0/R33.2
EA 0C700, Project No. 0812000164
SR-210 Mixed Flow Lane Addition Project 33
Traffic Operations Analysis Revised: February 2014
Table 10:
Horizon Year (2040) SR-210 – No Build Eastbound Mainline and Ramp Operations LOS
Freeway Mainline Segment /
Ramp Connection
Freeway Mainline / Ramp Connection
Merge/Diverge Analyses
Horizon Year (2040)
Facility Lanes
AM Peak PM Peak
Den. LOS Den. LOS
SR-210 between Sterling Avenue and Highland
Avenue-Arden Avenue
Freeway 3MF 29.8 D 30.6 D
SR-210 Highland Avenue Off-ramp
Trap
Lane
2MF/
1L
Trap
N/A
3
N/A
3
N/A
3
N/A
3
SR-210 Arden Avenue On-ramp Merge
2MF/
1L
Ramp
--* F --* F
SR-210 between Highland Avenue-Arden Avenue
and Victoria Avenue
Freeway 2MF 54.7 F 57.1 F
SR-210 between Victoria Avenue and SR-330 Freeway 2MF 42.8 E 44.5 E
SR-210 SR-330 Connector Diverge
2MF/
1L
Decel
33.1 D 33.8 D
SR-210 between SR-330 and Base Line Weave
2MF/
1 Aux
29.0 D 26.6 C
SR-210 Base Line On-ramp Merge
2MF/
1L
Ramp
--* F 37.5 E
SR-210 between Base Line and 5th Street-
Greenspot Road
Freeway 2MF 49.6 F 43.6 E
SR-210 5th Street Off-ramp Diverge
2MF/
1L
Ramp
--* F 36.5 E
SR-210 5th Street On-ramp Merge
2MF/
1L
Ramp
--* F --* F
SR-210 between 5th Street-Greenspot Road and
San Bernardino Avenue
Freeway 2MF 75.8 F 50.8 F
SR-210 San Bernardino Avenue Off-ramp Diverge
3MF/
1L
Ramp
33.9 D 31.2 D
SR-210 San Bernardino Avenue On-ramp Merge
4MF/
1L
Ramp
24.2 C 20.3 C
SR-210 between San Bernardino Avenue and I-10
Freeway
Freeway 4MF 22.5 C 18.9 C
Notes: --* = Demand exceeds capacity.
1. “Highland Avenue-Arden Avenue” refers to SR-210 off-ramps to Highland Avenue and SR-210 on-ramps from
Arden Avenue (EB) and both Arden Avenue/Highland Avenue (WB).
2. “5th Street-Greenspot Road” refers to SR-210 off/on-ramps to 5th Street (EB) and SR-210 off/on-ramps to Greenspot
Road (WB).
3. Ramp junction analysis is not applicable for lane drop (trap) lane or lane addition connection to freeway.
4. Ramp junction analysis is not applicable for ramp connections in weave segments.
08-SBD-210
PM R25.0/R33.2
EA 0C700, Project No. 0812000164
SR-210 Mixed Flow Lane Addition Project 34
Traffic Operations Analysis Revised: February 2014
Table 11:
Horizon Year (2040) SR-210 – No Build Westbound Mainline and Ramp Operations LOS
Freeway Mainline Segment /
Ramp Connection
Freeway Mainline / Ramp Connection
Merge/Diverge Analyses
Horizon Year (2040)
Facility Lanes
AM Peak PM Peak
Den. LOS Den. LOS
SR-210 between I-10 Freeway and
San Bernardino Avenue
Freeway 3MF 21.6 C 27.4 D
SR-210 San Bernardino Avenue Off-ramp Diverge
3MF/
1L
Ramp
27.4 C 33.1 D
SR-210 San Bernardino Avenue On-ramp Merge
2MF/
1L
Ramp
--* F --* F
SR-210 between San Bernardino Avenue and 5th
Street-Greenspot Road
Freeway 2MF 47.0 F 53.7 F
SR-210 Greenspot Road Off-ramp Diverge
2MF/
1L
Ramp
--* F --* F
SR-210 Greenspot Road On-ramp Merge
2MF/
1L
Ramp
34.8 D 34.6 D
SR-210 between 5th Street-Greenspot Road and
Base Line
Freeway 2MF 36.9 E 36.8 E
SR-210 Base Line Off-ramp Diverge
2MF/
1L
Ramp
33.2 D 33.1 D
SR-210 between Base Line and SR-330 Weave
2MF/
1 Aux
29.6 D 28.9 D
SR-210 SR-330 Connector Merge
2MF/
1L
Ramp
--* F 37.9 E
SR-210 between SR-330 and Victoria Avenue Freeway 2MF 54.1 F 44.5 E
SR-210 between Victoria Avenue and Highland
Avenue-Arden Avenue
Freeway 2MF 63.0 F 58.6 F
SR-210 Highland Avenue Off-ramp Diverge
2MF/
1L
Ramp
--* F --* F
Notes: --* = Demand exceeds capacity.
1. “Highland Avenue-Arden Avenue” refers to SR-210 off-ramps to Highland Avenue and SR-210 on-ramps from
Arden Avenue (EB) and both Arden Avenue/Highland Avenue (WB).
2. “5th Street-Greenspot Road” refers to SR-210 off/on-ramps to 5th Street (EB) and SR-210 off/on-ramps to Greenspot
Road (WB).
3. Ramp junction analysis is not applicable for lane drop (trap) lane or lane addition connection to freeway.
4. Ramp junction analysis is not applicable for ramp connections in weave segments.
08-SBD-210
PM R25.0/R33.2
EA 0C700, Project No. 0812000164
SR-210 Mixed Flow Lane Addition Project 35
Traffic Operations Analysis Revised: February 2014
Horizon Year (2040) - Build Traffic Conditions
Figure 10 illustrates Horizon Year (2040) – Build Freeway Mainline and Ramp Geometric
configurations. Figure 11 illustrates Horizon Year (2040) – Build Freeway Mainline and Ramp
ADT and peak hour traffic volumes.
Similar to Horizon Year (2040) – No Build conditions, an operational analysis was conducted for
Build Conditions of the SR-210 mainline, ramp merge and diverge areas within the project study
area and the results are summarized in Table 12 for the eastbound SR-210 direction and in
Table 13 for the westbound SR-210 direction.
SR-210 Mixed Flow Lane Addition
(PM R26.0/R33.2) - EA 0C700
K:2012SR-210
Mixed
Flow
Lane
AdditionFigures.ai
Governments
SANBAG
Working T
ogether
Governments
SANBAG
Working T
ogether
INTERSTATE
CALIFORNIA
10
INTERSTATE
CALIFORNIA
10
CALIFORNIA
210
CALIFORNIA
210
CALIFORNIA
330
FIFTH ST
BASE LINE
HIGHLAND AVE
PIONEER AVE
SAN BERNARDINO AVE
ARDEN
AVE
VICTORIA
AVE
ALABAMA
ST
SANTA ANA RIVER
GREENSPOT RD
NOT TO SCALE
Figure 10
Horizon Year (2040) Build Freeway
Mainline and Ramp Geometrics
3
3
3
3 3
3
3
3
3
3
3
4
4
4
4
4
LEGEND
X Number of Lanes
SR-210 Mixed Flow Lane Addition
(PM R26.0/R33.2) - EA 0C700
K:2012SR-210
Mixed
Flow
Lane
AdditionFigures.ai
Governments
SANBAG
Working T
ogether
Governments
SANBAG
Working T
ogether
INTERSTATE
CALIFORNIA
10
INTERSTATE
CALIFORNIA
10
CALIFORNIA
210
CALIFORNIA
210
CALIFORNIA
330
FIFTH ST
BASE LINE
HIGHLAND AVE
PIONEER AVE
SAN BERNARDINO AVE
ARDEN
AVE
VICTORIA
AVE
ALABAMA
ST
SANTA ANA RIVER
GREENSPOT RD
NOT TO SCALE
59,200
5,270
5,580
59,200
5,530
6,050
10,300
460
710 4,100
310
340
53,000
5,090
5,250
58,300
5,380
5,680 8,300
690
680
6,700
250
510
51,400
4,650
5,080
11,400
620
670
53,700
4,360
5,000
5,900
280
470
15,200
800
1,250
63,000
4,880
5,780
15,500
1,030
1,270
10,600
420
1,110
58,100
4,270
5,620
9,100
910
750
10,300
890
740
8,300
490
510
6,700
580
360
51,400
4,480
4,570
9,100
690
580
11,400
990
660
5,900
510
770
15,200
1,200
1,040
63,000
5,470
4,920
15,500
750
770
10,600
920
660
58,100
5,640
4,810
53,700
4,780
4,650
53,000
4,390
4,720
4,100
550
390
58,300
4,930
5,230
Figure 11
Horizon Year (2040) Build Freeway
Mainline and Ramp Volumes
LEGEND
XXXXX Average Daily Traffic
XXXX AM Peak Hour
XXXX PM Peak Hour
4,000
430
330
9,300
720
760
9,300
810
1,000
4,000
270
490
08-SBD-210
PM R25.0/R33.2
EA 0C700, Project No. 0812000164
SR-210 Mixed Flow Lane Addition Project 38
Traffic Operations Analysis Revised: February 2014
Table 12:
Horizon Year (2040) SR-210 – Build Eastbound Mainline and Ramp Operations LOS
Freeway Mainline Segment /
Ramp Connection
Freeway Mainline / Ramp Connection
Merge/Diverge Analyses
Horizon Year (2040)
Facility Lanes
AM Peak PM Peak
Den. LOS Den. LOS
SR-210 between Sterling Avenue and Highland
Avenue-Arden Avenue
Freeway 3MF 31.7 D 34.1 D
SR-210 Highland Avenue Off-ramp Diverge
3MF/
2L
Ramp
25.6 C 26.9 C
SR-210 Arden Avenue On-ramp Merge
3MF/
1L
Ramp
28.5 D 29.3 D
SR-210 between Highland Avenue-Arden Avenue
and Victoria Avenue
Freeway 3MF 28.9 D 30.9 D
SR-210 between Victoria Avenue and SR-330 Freeway 3MF 25.0 C 27.0 D
SR-210 SR-330 Connector Diverge
3MF/
1L
Decel
21.0 C 22.3 C
SR-210 between SR-330 and Base Line Weave
3MF/
1 Aux
22.3 C 22.0 C
SR-210 Base Line On-ramp Merge
3MF/
1 Aux
N/A
4
N/A
4
N/A
4
N/A
4
SR-210 between Base Line and
5th Street-Greenspot Road
Weave
3MF/
1 Aux
26.8 C 25.5 C
SR-210 5th Street Off-ramp Diverge
3MF/
1 Aux
N/A
4
N/A
4
N/A
4
N/A
4
SR-210 5th Street On-ramp Merge
3MF/
1L
Accel
33.1 D 29.5 D
SR-210 between 5th Street-Greenspot Road and
San Bernardino Avenue
Freeway 3MF 33.3 D 28.2 D
SR-210 San Bernardino Avenue Off-ramp Diverge
3MF/
1L
Ramp
35.5 E 32.9 D
SR-210 San Bernardino Avenue On-ramp Merge
4MF/
1L
Ramp
25.2 C 21.0 C
SR-210 between San Bernardino Avenue and I-10
Freeway
Freeway 4MF 23.9 C 20.1 C
Notes:
1. “Highland Avenue-Arden Avenue” refers to SR-210 off-ramps to Highland Avenue and SR-210 on-ramps from
Arden Avenue (EB) and both Arden Avenue/Highland Avenue (WB).
2. “5th Street-Greenspot Road” refers to SR-210 off/on-ramps to 5th Street (EB) and SR-210 off/on-ramps to Greenspot
Road (WB).
3. Ramp junction analysis is not applicable for lane drop (trap) lane or lane addition connection to freeway.
4. Ramp junction analysis is not applicable for ramp connections in weave segments.
08-SBD-210
PM R25.0/R33.2
EA 0C700, Project No. 0812000164
SR-210 Mixed Flow Lane Addition Project 39
Traffic Operations Analysis Revised: February 2014
Table 13:
Horizon Year (2040) SR-210 – Build Westbound Mainline and Ramp Operations LOS
Freeway Mainline Segment /
Ramp Connection
Freeway Mainline / Ramp Connection
Merge/Diverge Analyses
Horizon Year (2040)
Facility Lanes
AM Peak PM Peak
Den. LOS Den. LOS
SR-210 between I-10 Freeway and
San Bernardino Avenue
Freeway 3MF 24.1 C 34.2 D
SR-210 San Bernardino Avenue Off-ramp Diverge
3MF/
1L
Ramp
29.5 D 36.6 E
SR-210 San Bernardino Avenue On-ramp Merge
3MF/
1L
Ramp
29.6 D 34.1 D
SR-210 between San Bernardino Avenue and
5th Street-Greenspot Road
Freeway 3MF 28.3 D 35.8 E
SR-210 Greenspot Road Off-ramp Diverge
3MF/
1L
Ramp
33.0 D 37.5 E
SR-210 Greenspot Road On-ramp Merge
3MF/
1 Aux
N/A4
N/A4
N/A4
N/A4
SR-210 between 5th Street-Greenspot Road
and Base Line
Weave
3MF/
1 Aux
22.7 C 26.8 C
SR-210 Base Line Off-ramp Diverge
3MF/
1 Aux
N/A4
N/A4
N/A4
N/A4
SR-210 between Base Line and SR-330 Weave
3MF/
1 Aux
24.3 C 25.9 C
SR-210 SR-330 Connector Merge
3MF/
1L
Ramp
29.9 D 30.3 D
SR-210 between SR-330 and Victoria Avenue Freeway 3MF 30.2 D 31.1 D
SR-210 between Victoria Avenue and Highland
Avenue-Arden Avenue
Freeway 3MF 32.7 D 35.1 E
SR-210 Highland Avenue Off-ramp Diverge
3MF/
1L
Ramp
34.5 D 35.6 E
Notes:
1. “Highland Avenue-Arden Avenue” refers to SR-210 off-ramps to Highland Avenue and SR-210 on-ramps from
Arden Avenue (EB) and both Arden Avenue/Highland Avenue (WB).
2. “5th Street-Greenspot Road” refers to SR-210 off/on-ramps to 5th Street (EB) and SR-210 off/on-ramps to Greenspot
Road (WB).
3. Ramp junction analysis is not applicable for lane drop (trap) lane or lane addition connection to freeway.
4. Ramp junction analysis is not applicable for ramp connections in weave segments.
08-SBD-210
PM R25.0/R33.2
EA 0C700, Project No. 0812000164
SR-210 Mixed Flow Lane Addition Project 40
Traffic Operations Analysis Revised: February 2014
7.0 SUMMARY AND CONCLUSION
This chapter provides a summary of the results of the operational analyses performed for the
proposed project. Existing (2012), Opening Year (2020) and Horizon Year (2040) results are
discussed in the following sections.
Existing (2012) Traffic Conditions
The existing mainline SR-210 freeway is generally operating at acceptable levels of service
(LOS D or better) based upon 2012 traffic volumes. The areas of heaviest congestion occur
between Fifth Street-Greenspot Road and San Bernardino Avenue. One freeway segment is
operating at LOS E during the morning peak hour (EB from Fifth Street-Greenspot Road to San
Bernardino Avenue) and two ramp junctions are operating at LOS E (EB Fifth Street on-ramp in
the morning peak hour and WB Greenspot Road off-ramp in the evening peak hour). The short
weaving segment between SR-330 and Base Line is operating at LOS B in both directions
during both the morning and evening peak hours. The existing freeway segments approaching
the I-10 freeway junction are operating at good levels of service (LOS B and LOS C).
Opening Year (2020) Traffic Conditions
The SR-210 mainline freeway will operate at LOS D or better in all segments and at all ramp
junctions under opening year with project conditions. The weaving segment between SR-330
and Base Line will operate acceptably as well (LOS B and LOS C) in 2020 in both directions
during morning and evening peak hours. The auxiliary lanes proposed between Base Line and
Fifth Street-Greenspot Road will provide this segment of freeway with good levels of service in
both directions (LOS B and LOS C) in the opening year. The freeway segments between San
Bernardino Avenue and I-10 degrade slightly from existing conditions, but still maintain
adequate levels of service of B, C and D in the morning and evening peak hours.
If the proposed project was not constructed by 2020, the operational conditions are anticipated
to be generally one level of service worse on each freeway segment and at each freeway ramp
junction when compared to the build condition. Several segments are forecast to reach LOS E
and LOS F conditions without the proposed improvements, particularly the areas between Fifth
Street-Greenspot Road and San Bernardino Avenue.
Horizon Year (2040) Traffic Conditions
In the Horizon Year (2040), nearly all mainline freeway segments on SR-210 within the project
limits will operate at LOS D or better after implementation of the proposed project
improvements. Only one segment (westbound SR-210 from San Bernardino Avenue to Fifth
Street-Greenspot Road) will operate at LOS E in the evening peak hour. In the No Build
condition this segment would operate a LOS F in both the morning and evening peak hours.
Because the density and level of service of this freeway segment only slightly exceeds the
criteria for LOS D, the proposed improvements meet the project’s Purpose and Need and
implementation of the future HOV lane addition project will improve this segment to an
acceptable level. The weaving segments between SR-330 and Base Line and between Base
Line and Fifth-Street-Greenspot Road will all operate at LOS C in both directions in both
morning and evening peak hour periods. The SR-210 freeway segment approaching the I-10
freeway junction will operate at LOS C in both morning and evening peak periods and the SR-
08-SBD-210
PM R25.0/R33.2
EA 0C700, Project No. 0812000164
SR-210 Mixed Flow Lane Addition Project 41
Traffic Operations Analysis Revised: February 2014
210 freeway segment leading away from the I-10 freeway will operate at LOS C and LOS D in
the morning and evening peak periods, respectively.
In the Horizon Year (2040), the levels of service at most of the ramp junctions are anticipated to
be LOS D or better. At the specific ramp junctions where the Horizon Year 2040 levels of
service are forecast to be LOS E, the Mixed Flow Lane project will incrementally improve these
ramp junctions compared to the No Build condition. Improvements at these ramp junctions are
not included in this project because ramp and interchange improvements are beyond the
Purpose and Need for the Mixed Flow Lane project. Furthermore, future interchange
improvement projects are anticipated to address the specific operational issues at these
locations. The projected evening peak hour LOS E conditions at the westbound off-ramp to San
Bernardino Avenue will be improved as part of the interchange reconstruction project proposed
in the SR-210 PSR/PDS approved in 2008. Similarly, the Greenspot Road westbound off-ramp
diverge LOS E in the evening peak hour will be addressed as part of the SR-210/Fifth Street-
Greenspot Road interchange improvement project under development by the City of Highland.
At each of these off-ramps, the addition of a deceleration lane in advance of the off-ramp
divergence point should improve the ramp junction level of service to acceptable levels.
Finally, the only other location of LOS E predicted in the Horizon Year 2040 within the project
limits is the westbound off-ramp to Highland Avenue and the approaching freeway segment.
Studies are currently underway for improvements at this existing interchange, which involve
development of a new interchange at Victoria Avenue. While the specific improvements in this
location within the SR-210 corridor are not known, it is reasonable to expect that the future year
level of service issues at the westbound Highland Avenue off-ramp will be addressed by the
proposed improvements considered in conjunction with the SR-210/Victoria Avenue interchange
project.
The Horizon Year (2040) No Build versus Build operational results clearly demonstrates the
traffic enhancement value of the proposed project improvements. Many freeway mainline
segments will operate at LOS E and LOS F without the addition of the third mixed flow lane in
each direction. The level of service between Base Line and Fifth Street-Greenspot Road will
degrade to LOS E and LOS F by 2040 if the auxiliary lanes between these two interchanges are
not constructed. The addition of the eastbound acceleration lane at the Fifth Street on-ramp
improves the level of service from LOS F in both the morning and evening peak hour periods to
LOS D in both peak periods under Horizon Year (2040) traffic conditions.
Conclusions
The SR-210 Mixed Flow Lane Addition project will address traffic operational issues within this
segment of the corridor in both the Opening Year (2020) and Horizon Year (2040) conditions
consistent with the project's Purpose and Need. The proposed improvements will maintain
levels of service of LOS D or better on all mainline freeway segments, all weave segments and
at all ramp junctions.
The only exceptions occur in locations where planned future interchange improvement projects
would necessarily address the ramp junction diverge operations. All of the interchange on-
ramps, including the freeway-to-freeway connectors at the SR-330 junction, are expected to
operate at LOS D or better under future year traffic conditions. Therefore, ramp metering
systems not already included in the proposed project improvements, should not be necessary to
mitigate ramp junction merge levels of service.
08-SBD-210
PM R25.0/R33.2
EA 0C700, Project No. 0812000164
SR-210 Mixed Flow Lane Addition Project 42
Traffic Operations Analysis Revised: February 2014
Finally, the level of service of the freeway segment approaching the I-10 freeway junction is
LOS C in both peak periods; therefore, the proposed improvements do not have a negative
impact on the I-10 freeway interchange. Similarly, the project does not have any detrimental
impacts on the westbound segment of the SR-210 freeway departing from the I-10 freeway
junction and the level of service in this area is forecasted to remain at LOS D or better through
2040 without any additional improvements.
The proposed mixed flow lane addition in each direction will not preclude other future
operational improvement projects that are planned within this corridor. In fact, the addition of
the third mixed flow lane will complement the future SR-210 HOV lane addition project and the
development of interchange improvement projects throughout the project study limits.
The proposed improvements meet the project’s Purpose and Need and improve future
operational conditions in comparison with No Build conditions. It is anticipated that after the
implementation of the proposed project and with the future addition of the HOV lane project,
mainline and ramp merge/diverge operating conditions will further improve in conjunction with
other planned interchange improvements within the project study area.
08-SBD-210
PM R25.0/R33.2
EA 0C700, Project No. 0812000164
SR-210 Mixed Flow Lane Addition Project 43
Traffic Operations Analysis Revised: February 2014
Appendix A – Traffic Model Projections
SR-210 Mixed Flow Lane Addition
Peak Hour Freeway Volume Summary
AM PM AM PM AM PM AM PM AM PM AM PM
Highland Ave Diverge
3MF/
1L Ramp
4 2 864 786 1,090 1,020 1,150 1,160 960 850 890 740
Highland Ave Merge
3MF/
1L Ramp
-2 -3 598 488 640 550 690 730 540 400 550 390
SR-210 between Arden Avenue and
Victoria Ave
Freeway 3MF 66 62 2,760 3,007 3,150 3,370 3,370 3,800 4,620 4,740 4,930 5,230
SR-210 between Victoria Ave and SR-
330
Freeway 3MF 50 46 2,760 3,007 3,150 3,370 3,370 3,800 4,170 4,290 4,390 4,720
SR-210 to SR-330 Connector Diverge
3MF/
1L Ramp
4 6 361 287 400 340 410 390 480 460 490 510
SR-210 between SR-330 and Base
Line
Weave 4MF 53 37 2,779 2,948 3,190 3,270 3,400 3,730 4,270 4,110 4,480 4,570
Sr-210 between Base Line and 5th
Street
Weave 4MF 4 2 819 554 850 570 900 630 940 600 990 660
SR-210 5th Street On-Ramp Merge
3MF/
1L Ramp
4 5 1,032 820 1,060 860 1,120 930 1,140 970 1,200 1,040
SR-210 between 5th Street and San
Bernardino Avenue
Freeway 3MF 39 28 4,003 3,594 4,300 3,860 4,650 4,220 5,120 4,560 5,470 4,920
SR-210 San Bernardino Avenue Off-
Ramp
Diverge
3MF/
1L Ramp
5 5 568 614 610 650 650 680 710 740 750 770
SR-210 San Bernardino Avenue On-
Ramp
Merge
4MF/
1L Ramp
12 9 590 466 680 530 680 480 920 710 920 660
SR-210 between San Bernardino
Avenue and I-10 Freeway
Freeway 4MF 34 28 4,025 3,446 4,370 3,740 4,680 4,020 5,330 4,530 5,640 4,810
(1) Existing to No Build (2040) Annual Growth = [No Build (2040) - Existing (2012)] ÷ (2040 - 2012). Equation provided to illustrate general linear annual growth trends.
Existing No Build
Eastbound/Southbound
Freeway Mainline Segment / Ramp
Connection
Facility
Existing to No Build
Annual Growth
(1)
2012 2020 2040
Lanes Build No Build Build
URS Corporation
Revised: 2/10/2014
Printed: 2/11/2014
SR-210 Mixed Flow Lane Addition
Peak Hour Freeway Volume Summary
AM PM AM PM AM PM AM PM AM PM AM PM
SR-210 between I-10 Freeway and
San Bernardino Avenue
Freeway 3MF 42 37 2,663 3,774 3,000 4,070 3,420 4,890 3,850 4,800 4,270 5,620
SR-210 San Bernardino Avenue Off-
Ramp
Diverge
3MF/
1L Ramp
8 12 194 778 260 870 270 870 410 1,110 420 1,110
SR-210 San Bernardino Avenue On-
Ramp
Merge
3MF/
1L Ramp
11 9 615 720 700 790 800 1,090 930 970 1,030 1,270
SR-210 between San Bernardino
Avenue and Greenspot Road
Freeway 3MF 46 34 3,083 3,716 3,440 3,990 3,950 5,110 4,370 4,660 4,880 5,780
SR-210 Greenspot Road
Off-Ramp
Diverge
3MF/
1L Ramp
2 4 652 944 670 970 760 1,170 710 1,050 800 1,250
SR-210 between Greenspot Road and
Base Line
Weave 4MF 44 35 2,640 3,038 2,980 3,300 3,460 4,390 3,880 3,910 4,360 5,000
SR-210 between Base Line and SR-
330
Weave 4MF 48 48 2,823 2,996 3,200 3,360 3,670 4,250 4,180 4,190 4,650 5,080
SR-210 SR-330 Connector Merge
3MF/
1L Ramp
4 7 544 398 580 450 610 540 660 590 690 680
SR-210 between SR-330 and Victoria
Avenue
Freeway 3MF 51 51 3,176 2,985 3,580 3,380 4,070 4,340 4,600 4,290 5,090 5,250
SR-210 between Victoria Avenue and
Highland Avenue-Arden Avenue
Freeway 3MF 59 69 3,176 2,985 3,580 3,380 4,070 4,340 4,840 4,780 5,380 5,680
SR-210 Highland Avenue
Off-Ramp
Diverge
3MF/
1L Ramp
-2 3 449 282 520 360 560 460 390 380 310 340
SR-210 Highland Avenue
On-Ramp
Merge
3MF/
1L Ramp
3 15 633 691 810 1,000 740 690 700 1,100 460 710
(1) Existing to No Build (2040) Annual Growth = [No Build (2040) - Existing (2012)] ÷ (2040 - 2012). Equation provided to illustrate general linear annual growth trends.
Westbound/Northbound
Freeway Mainline Segment / Ramp
Connection
Facility
Existing to No Build
Annual Growth
(1)
Build No Build Build
Lanes
2012 2020 2040
Existing No Build
URS Corporation
Revised: 2/10/2014
Printed: 2/11/2014
08-SBD-210
PM R25.0/R33.2
EA 0C700, Project No. 0812000164
SR-210 Mixed Flow Lane Addition Project 44
Traffic Operations Analysis Revised: February 2014
Appendix B – Traffic Analysis Worksheets
BASIC FREEWAY SEGMENTS WORKSHEET
General Information Site Information
Analyst KT Highway/Direction of Travel SR-210 EB
Agency or Company URS From/To West of Highland Ave Off
Date Performed 10/7/2013 Jurisdiction
Analysis Time Period AM Analysis Year Existing
Project Description SR-210 Widening PAED
Oper.(LOS)





 Des.(N)




 Planning Data





Flow Inputs
Volume, V 3026 veh/h Peak-Hour Factor, PHF 0.94
AADT veh/day %Trucks and Buses, PT 7
Peak-Hr Prop. of AADT, K %RVs, PR 0
Peak-Hr Direction Prop, D General Terrain: Level
DDHV = AADT x K x D veh/h Grade % Length mi
Up/Down %
Calculate Flow Adjustments
fp 1.00 ER 1.2
ET 1.5 fHV = 1/[1+PT(ET - 1) + PR(ER - 1)] 0.966
Speed Inputs Calc Speed Adj and FFS
Lane Width ft
Rt-Side Lat. Clearance ft
Number of Lanes, N 3
Total Ramp Density, TRD ramps/mi
FFS (measured) 65.0 mph
Base free-flow Speed,
BFFS
mph
fLW mph
fLC mph
TRD Adjustment mph
FFS 65.0 mph
LOS and Performance Measures Design (N)
Operational (LOS)
vp = (V or DDHV) / (PHF x N x fHV
x fp)
1111 pc/h/ln
S 65.0 mph
D = vp / S 17.1 pc/mi/ln
LOS B
Design (N)
Design LOS
vp = (V or DDHV) / (PHF x N x fHV
x fp)
pc/h/ln
S mph
D = vp / S pc/mi/ln
Required Number of Lanes, N
Glossary Factor Location
N - Number of lanes S - Speed
V - Hourly volume D - Density
vp - Flow rate FFS - Free-flow speed
LOS - Level of service BFFS - Base free-flow
speed
DDHV - Directional design hour volume
ER - Exhibits 11-10, 11-12 fLW - Exhibit 11-8
ET - Exhibits 11-10, 11-11, 11-13 fLC - Exhibit 11-9
fp - Page 11-18 TRD - Page 11-11
LOS, S, FFS, vp - Exhibits 11-2,
11-3
Copyright © 2012 University of Florida, All Rights Reserved HCS 2010TM Version 6.41 Generated: 10/7/2013 11:08 AM
Page 1 of 1
BASIC FREEWAY WORKSHEET
10/7/2013
file://C:Userskristin_tsoAppDataLocalTempf2k3546.tmp
BASIC FREEWAY SEGMENTS WORKSHEET
General Information Site Information
Analyst KT Highway/Direction of Travel SR-210 EB
Agency or Company URS From/To West of Highland Ave Off
Date Performed 10/7/2013 Jurisdiction
Analysis Time Period PM Analysis Year Existing
Project Description SR-210 Widening PAED
Oper.(LOS)





 Des.(N)




 Planning Data





Flow Inputs
Volume, V 3305 veh/h Peak-Hour Factor, PHF 0.95
AADT veh/day %Trucks and Buses, PT 7
Peak-Hr Prop. of AADT, K %RVs, PR 0
Peak-Hr Direction Prop, D General Terrain: Level
DDHV = AADT x K x D veh/h Grade % Length mi
Up/Down %
Calculate Flow Adjustments
fp 1.00 ER 1.2
ET 1.5 fHV = 1/[1+PT(ET - 1) + PR(ER - 1)] 0.966
Speed Inputs Calc Speed Adj and FFS
Lane Width ft
Rt-Side Lat. Clearance ft
Number of Lanes, N 3
Total Ramp Density, TRD ramps/mi
FFS (measured) 65.0 mph
Base free-flow Speed,
BFFS
mph
fLW mph
fLC mph
TRD Adjustment mph
FFS 65.0 mph
LOS and Performance Measures Design (N)
Operational (LOS)
vp = (V or DDHV) / (PHF x N x fHV
x fp)
1200 pc/h/ln
S 65.0 mph
D = vp / S 18.5 pc/mi/ln
LOS C
Design (N)
Design LOS
vp = (V or DDHV) / (PHF x N x fHV
x fp)
pc/h/ln
S mph
D = vp / S pc/mi/ln
Required Number of Lanes, N
Glossary Factor Location
N - Number of lanes S - Speed
V - Hourly volume D - Density
vp - Flow rate FFS - Free-flow speed
LOS - Level of service BFFS - Base free-flow
speed
DDHV - Directional design hour volume
ER - Exhibits 11-10, 11-12 fLW - Exhibit 11-8
ET - Exhibits 11-10, 11-11, 11-13 fLC - Exhibit 11-9
fp - Page 11-18 TRD - Page 11-11
LOS, S, FFS, vp - Exhibits 11-2,
11-3
Copyright © 2012 University of Florida, All Rights Reserved HCS 2010TM Version 6.41 Generated: 10/7/2013 2:10 PM
Page 1 of 1
BASIC FREEWAY WORKSHEET
10/7/2013
file://C:Documents and Settingskristin_tsoLocal SettingsTempf2k52.tmp
RAMPS AND RAMP JUNCTIONS WORKSHEET
General Information Site Information
Analyst KT Freeway/Dir of Travel SR-210 EB
Agency or Company URS Junction Arden On
Date Performed 12/18/2012 Jurisdiction
Analysis Time Period AM Analysis Year Existing
Project Description SR-210 Widening PAED
Inputs
Upstream Adj Ramp
Yes





 On





No




 Off






Lup = 3810 ft
Vu = 864 veh/h
Freeway Number of Lanes, N 2
Ramp Number of Lanes, N 1
Acceleration Lane Length, LA 600
Deceleration Lane Length LD
Freeway Volume, VF 2162
Ramp Volume, VR 598
Freeway Free-Flow Speed, SFF 65.0
Ramp Free-Flow Speed, SFR 50.0
Downstream Adj
Ramp
Yes




 On





No





 Off





Ldown = ft
VD = veh/h
Conversion to pc/h Under Base Conditions
(pc/h)
V
(Veh/hr)
PHF Terrain %Truck %Rv fHV fp v = V/PHF x fHV x fp
Freeway 2162 0.94 Level 7 0 0.966 1.00 2380
Ramp 598 0.94 Level 7 0 0.966 1.00 658
UpStream 864 0.94 Level 7 0 0.966 1.00 951
DownStream
Merge Areas Diverge Areas
Estimation of v12 Estimation of v12
V12 = VF ( PFM )
LEQ = (Equation 13-6 or 13-7)
PFM = 1.000 using Equation (Exhibit 13-6)
V12 = 2380 pc/h
V3 or Vav34 0 pc/h (Equation 13-14 or 13-17)
Is V3 or Vav34 > 2,700 pc/h? Yes No




 





Is V3 or Vav34 > 1.5 * V12/2 Yes No




 





If Yes,V12a = pc/h (Equation 13-16, 13-18, or
13-19)
V12 = VR + (VF - VR)PFD
LEQ = (Equation 13-12 or 13-13)
PFD = using Equation (Exhibit 13-7)
V12 = pc/h
V3 or Vav34 pc/h (Equation 13-14 or 13-17)
Is V3 or Vav34 > 2,700 pc/h? Yes No




 




Is V3 or Vav34 > 1.5 * V12/2 Yes No




 




If Yes,V12a = pc/h (Equation 13-16, 13-18, or
13-19)
Capacity Checks Capacity Checks
Actual Capacity LOS F? Actual Capacity LOS F?
VFO 3038 Exhibit 13-8 No
VF Exhibit 13-8
VFO = VF - VR Exhibit 13-8
VR
Exhibit 13-
10
Flow Entering Merge Influence Area Flow Entering Diverge Influence Area
Actual Max Desirable Violation? Actual Max Desirable Violation?
VR12 3038 Exhibit 13-8 4600:All No V12 Exhibit 13-8
Level of Service Determination (if not F) Level of Service Determination (if not F)
DR = 5.475 + 0.00734 v R + 0.0078 V12 - 0.00627 LA
DR = 25.1 (pc/mi/ln)
LOS = C (Exhibit 13-2)
DR = 4.252 + 0.0086 V12 - 0.009 LD
DR = (pc/mi/ln)
LOS = (Exhibit 13-2)
Speed Determination Speed Determination
MS = 0.342 (Exibit 13-11)
SR= 57.1 mph (Exhibit 13-11)
S0= N/A mph (Exhibit 13-11)
S = 57.1 mph (Exhibit 13-13)
Ds = (Exhibit 13-12)
SR= mph (Exhibit 13-12)
S0= mph (Exhibit 13-12)
S = mph (Exhibit 13-13)
Copyright © 2012 University of Florida, All Rights Reserved HCS2010TM Version 6.41 Generated: 10/11/2013 1:40 PM
Page 1 of 1
RAMPS AND RAMP JUNCTIONS WORKSHEET
10/11/2013
file://C:Documents and Settingskristin_tsoLocal SettingsTempr2kD.tmp
RAMPS AND RAMP JUNCTIONS WORKSHEET
General Information Site Information
Analyst KT Freeway/Dir of Travel SR-210 EB
Agency or Company URS Junction Arden On
Date Performed 12/18/2012 Jurisdiction
Analysis Time Period PM Analysis Year Existing
Project Description SR-210 Widening PAED
Inputs
Upstream Adj Ramp
Yes




 On





No





 Off





Lup = ft
Vu = veh/h
Freeway Number of Lanes, N 2
Ramp Number of Lanes, N 1
Acceleration Lane Length, LA 600
Deceleration Lane Length LD
Freeway Volume, VF 2519
Ramp Volume, VR 488
Freeway Free-Flow Speed, SFF 65.0
Ramp Free-Flow Speed, SFR 50.0
Downstream Adj
Ramp
Yes





 On






No




 Off





Ldown = 3810 ft
VD = 488 veh/h
Conversion to pc/h Under Base Conditions
(pc/h)
V
(Veh/hr)
PHF Terrain %Truck %Rv fHV fp v = V/PHF x fHV x fp
Freeway 2519 0.95 Level 7 0 0.966 1.00 2744
Ramp 488 0.95 Level 7 0 0.966 1.00 532
UpStream
DownStream 488 0.95 Level 7 0 0.966 1.00 532
Merge Areas Diverge Areas
Estimation of v12 Estimation of v12
V12 = VF ( PFM )
LEQ = (Equation 13-6 or 13-7)
PFM = 1.000 using Equation (Exhibit 13-6)
V12 = 2744 pc/h
V3 or Vav34 0 pc/h (Equation 13-14 or 13-17)
Is V3 or Vav34 > 2,700 pc/h? Yes No




 





Is V3 or Vav34 > 1.5 * V12/2 Yes No




 





If Yes,V12a = pc/h (Equation 13-16, 13-18, or
13-19)
V12 = VR + (VF - VR)PFD
LEQ = (Equation 13-12 or 13-13)
PFD = using Equation (Exhibit 13-7)
V12 = pc/h
V3 or Vav34 pc/h (Equation 13-14 or 13-17)
Is V3 or Vav34 > 2,700 pc/h? Yes No




 




Is V3 or Vav34 > 1.5 * V12/2 Yes No




 




If Yes,V12a = pc/h (Equation 13-16, 13-18, or
13-19)
Capacity Checks Capacity Checks
Actual Capacity LOS F? Actual Capacity LOS F?
VFO 3276 Exhibit 13-8 No
VF Exhibit 13-8
VFO = VF - VR Exhibit 13-8
VR
Exhibit 13-
10
Flow Entering Merge Influence Area Flow Entering Diverge Influence Area
Actual Max Desirable Violation? Actual Max Desirable Violation?
VR12 3276 Exhibit 13-8 4600:All No V12 Exhibit 13-8
Level of Service Determination (if not F) Level of Service Determination (if not F)
DR = 5.475 + 0.00734 v R + 0.0078 V12 - 0.00627 LA
DR = 27.0 (pc/mi/ln)
LOS = C (Exhibit 13-2)
DR = 4.252 + 0.0086 V12 - 0.009 LD
DR = (pc/mi/ln)
LOS = (Exhibit 13-2)
Speed Determination Speed Determination
MS = 0.364 (Exibit 13-11)
SR= 56.6 mph (Exhibit 13-11)
S0= N/A mph (Exhibit 13-11)
S = 56.6 mph (Exhibit 13-13)
Ds = (Exhibit 13-12)
SR= mph (Exhibit 13-12)
S0= mph (Exhibit 13-12)
S = mph (Exhibit 13-13)
Copyright © 2012 University of Florida, All Rights Reserved HCS2010TM Version 6.41 Generated: 10/11/2013 1:41 PM
Page 1 of 1
RAMPS AND RAMP JUNCTIONS WORKSHEET
10/11/2013
file://C:Documents and Settingskristin_tsoLocal SettingsTempr2k35.tmp
BASIC FREEWAY SEGMENTS WORKSHEET
General Information Site Information
Analyst KT Highway/Direction of Travel SR-210 EB
Agency or Company URS From/To
Date Performed 10/7/2013 Jurisdiction
Analysis Time Period AM Analysis Year Existing
Project Description SR-210 Widening PAED
Oper.(LOS)





 Des.(N)




 Planning Data





Flow Inputs
Volume, V 2760 veh/h Peak-Hour Factor, PHF 0.94
AADT veh/day %Trucks and Buses, PT 7
Peak-Hr Prop. of AADT, K %RVs, PR 0
Peak-Hr Direction Prop, D General Terrain: Level
DDHV = AADT x K x D veh/h Grade % Length mi
Up/Down %
Calculate Flow Adjustments
fp 1.00 ER 1.2
ET 1.5 fHV = 1/[1+PT(ET - 1) + PR(ER - 1)] 0.966
Speed Inputs Calc Speed Adj and FFS
Lane Width ft
Rt-Side Lat. Clearance ft
Number of Lanes, N 2
Total Ramp Density, TRD ramps/mi
FFS (measured) 65.0 mph
Base free-flow Speed,
BFFS
mph
fLW mph
fLC mph
TRD Adjustment mph
FFS 65.0 mph
LOS and Performance Measures Design (N)
Operational (LOS)
vp = (V or DDHV) / (PHF x N x fHV
x fp)
1519 pc/h/ln
S 64.8 mph
D = vp / S 23.4 pc/mi/ln
LOS C
Design (N)
Design LOS
vp = (V or DDHV) / (PHF x N x fHV
x fp)
pc/h/ln
S mph
D = vp / S pc/mi/ln
Required Number of Lanes, N
Glossary Factor Location
N - Number of lanes S - Speed
V - Hourly volume D - Density
vp - Flow rate FFS - Free-flow speed
LOS - Level of service BFFS - Base free-flow
speed
DDHV - Directional design hour volume
ER - Exhibits 11-10, 11-12 fLW - Exhibit 11-8
ET - Exhibits 11-10, 11-11, 11-13 fLC - Exhibit 11-9
fp - Page 11-18 TRD - Page 11-11
LOS, S, FFS, vp - Exhibits 11-2,
11-3
Copyright © 2012 University of Florida, All Rights Reserved HCS 2010TM Version 6.41 Generated: 10/8/2013 5:45 PM
Page 1 of 1
BASIC FREEWAY WORKSHEET
10/8/2013
file://C:Documents and Settingskristin_tsoLocal SettingsTempf2k1132.tmp
BASIC FREEWAY SEGMENTS WORKSHEET
General Information Site Information
Analyst KT Highway/Direction of Travel SR-210 EB
Agency or Company URS From/To Arden On / SR-330 Off
Date Performed 10/7/2013 Jurisdiction
Analysis Time Period PM Analysis Year Existing
Project Description SR-210 Widening PAED
Oper.(LOS)





 Des.(N)




 Planning Data





Flow Inputs
Volume, V 3007 veh/h Peak-Hour Factor, PHF 0.95
AADT veh/day %Trucks and Buses, PT 7
Peak-Hr Prop. of AADT, K %RVs, PR 0
Peak-Hr Direction Prop, D General Terrain: Level
DDHV = AADT x K x D veh/h Grade % Length mi
Up/Down %
Calculate Flow Adjustments
fp 1.00 ER 1.2
ET 1.5 fHV = 1/[1+PT(ET - 1) + PR(ER - 1)] 0.966
Speed Inputs Calc Speed Adj and FFS
Lane Width ft
Rt-Side Lat. Clearance ft
Number of Lanes, N 2
Total Ramp Density, TRD ramps/mi
FFS (measured) 65.0 mph
Base free-flow Speed,
BFFS
mph
fLW mph
fLC mph
TRD Adjustment mph
FFS 65.0 mph
LOS and Performance Measures Design (N)
Operational (LOS)
vp = (V or DDHV) / (PHF x N x fHV
x fp)
1638 pc/h/ln
S 64.2 mph
D = vp / S 25.5 pc/mi/ln
LOS C
Design (N)
Design LOS
vp = (V or DDHV) / (PHF x N x fHV
x fp)
pc/h/ln
S mph
D = vp / S pc/mi/ln
Required Number of Lanes, N
Glossary Factor Location
N - Number of lanes S - Speed
V - Hourly volume D - Density
vp - Flow rate FFS - Free-flow speed
LOS - Level of service BFFS - Base free-flow
speed
DDHV - Directional design hour volume
ER - Exhibits 11-10, 11-12 fLW - Exhibit 11-8
ET - Exhibits 11-10, 11-11, 11-13 fLC - Exhibit 11-9
fp - Page 11-18 TRD - Page 11-11
LOS, S, FFS, vp - Exhibits 11-2,
11-3
Copyright © 2012 University of Florida, All Rights Reserved HCS 2010TM Version 6.41 Generated: 10/8/2013 5:45 PM
Page 1 of 1
BASIC FREEWAY WORKSHEET
10/8/2013
file://C:Documents and Settingskristin_tsoLocal SettingsTempf2k112C.tmp
RAMPS AND RAMP JUNCTIONS WORKSHEET
General Information Site Information
Analyst KT Freeway/Dir of Travel SR-210 EB
Agency or Company URS Junction SR-330 Off
Date Performed 12/18/2012 Jurisdiction
Analysis Time Period AM Analysis Year 2012
Project Description SR-210 Widening PAED
Inputs
Upstream Adj Ramp
Yes




 On





No





 Off





Lup = ft
Vu = veh/h
Freeway Number of Lanes, N 2
Ramp Number of Lanes, N 1
Acceleration Lane Length, LA
Deceleration Lane Length LD 1180
Freeway Volume, VF 2760
Ramp Volume, VR 361
Freeway Free-Flow Speed, SFF 65.0
Ramp Free-Flow Speed, SFR 50.0
Downstream Adj
Ramp
Yes





 On






No




 Off





Ldown = 3260 ft
VD = 380 veh/h
Conversion to pc/h Under Base Conditions
(pc/h)
V
(Veh/hr)
PHF Terrain %Truck %Rv fHV fp v = V/PHF x fHV x fp
Freeway 2760 0.94 Level 7 0 0.966 1.00 3039
Ramp 361 0.94 Level 15 0 0.930 1.00 413
UpStream
DownStream 380 0.94 Level 6 0 0.971 1.00 416
Merge Areas Diverge Areas
Estimation of v12 Estimation of v12
V12 = VF ( PFM )
LEQ = (Equation 13-6 or 13-7)
PFM = using Equation (Exhibit 13-6)
V12 = pc/h
V3 or Vav34 pc/h (Equation 13-14 or 13-17)
Is V3 or Vav34 > 2,700 pc/h? Yes No




 




Is V3 or Vav34 > 1.5 * V12/2 Yes No




 




If Yes,V12a = pc/h (Equation 13-16, 13-18, or
13-19)
V12 = VR + (VF - VR)PFD
LEQ = (Equation 13-12 or 13-13)
PFD = 1.000 using Equation (Exhibit 13-7)
V12 = 3039 pc/h
V3 or Vav34 0 pc/h (Equation 13-14 or 13-17)
Is V3 or Vav34 > 2,700 pc/h? Yes No




 





Is V3 or Vav34 > 1.5 * V12/2 Yes No




 





If Yes,V12a = pc/h (Equation 13-16, 13-18, or 13-
19)
Capacity Checks Capacity Checks
Actual Capacity LOS F? Actual Capacity LOS F?
VFO Exhibit 13-8
VF 3039 Exhibit 13-8 4700 No
VFO = VF - VR 2626 Exhibit 13-8 4700 No
VR 413 Exhibit 13-10 2100 No
Flow Entering Merge Influence Area Flow Entering Diverge Influence Area
Actual Max Desirable Violation? Actual Max Desirable Violation?
VR12 Exhibit 13-8 V12 3039 Exhibit 13-8 4400:All No
Level of Service Determination (if not F) Level of Service Determination (if not F)
DR = 5.475 + 0.00734 v R + 0.0078 V12 - 0.00627 LA
DR = (pc/mi/ln)
LOS = (Exhibit 13-2)
DR = 4.252 + 0.0086 V12 - 0.009 LD
DR = 19.8 (pc/mi/ln)
LOS = B (Exhibit 13-2)
Speed Determination Speed Determination
MS = (Exibit 13-11)
SR= mph (Exhibit 13-11)
S0= mph (Exhibit 13-11)
S = mph (Exhibit 13-13)
Ds = 0.270 (Exhibit 13-12)
SR= 58.8 mph (Exhibit 13-12)
S0= N/A mph (Exhibit 13-12)
S = 58.8 mph (Exhibit 13-13)
Copyright © 2012 University of Florida, All Rights Reserved HCS2010TM Version 6.41 Generated: 10/11/2013 1:41 PM
Page 1 of 1
RAMPS AND RAMP JUNCTIONS WORKSHEET
10/11/2013
file://C:Documents and Settingskristin_tsoLocal SettingsTempr2k3B.tmp
210_MFLA_TS_TrafficReport-2.pdf

More Related Content

Similar to 210_MFLA_TS_TrafficReport-2.pdf

Dranesville District 2018 Paving and Restriping
Dranesville District 2018 Paving and RestripingDranesville District 2018 Paving and Restriping
Dranesville District 2018 Paving and RestripingFairfax County
 
DREAMManual2020.pdf
DREAMManual2020.pdfDREAMManual2020.pdf
DREAMManual2020.pdfPriankakar
 
FHWA Steel Bridge Design Handbook Volume 14
FHWA Steel Bridge Design Handbook Volume 14 FHWA Steel Bridge Design Handbook Volume 14
FHWA Steel Bridge Design Handbook Volume 14 Walid Alaywan
 
MPR OCT-22 PPT COMBINE.pptx
MPR OCT-22 PPT COMBINE.pptxMPR OCT-22 PPT COMBINE.pptx
MPR OCT-22 PPT COMBINE.pptxSuyogJungare
 
3426-360-K-RP-BNT-00001_REVD01 HSE PHILOSOPHY.pdf
3426-360-K-RP-BNT-00001_REVD01 HSE PHILOSOPHY.pdf3426-360-K-RP-BNT-00001_REVD01 HSE PHILOSOPHY.pdf
3426-360-K-RP-BNT-00001_REVD01 HSE PHILOSOPHY.pdfSamer61
 
Sample Global Busway_Bus Duct Market Report 2022
Sample Global Busway_Bus Duct Market Report 2022Sample Global Busway_Bus Duct Market Report 2022
Sample Global Busway_Bus Duct Market Report 2022Cognitive Market Research
 
I-15 Springville/Spanish Fork Interchange EA - Environmental assessment - Vol...
I-15 Springville/Spanish Fork Interchange EA - Environmental assessment - Vol...I-15 Springville/Spanish Fork Interchange EA - Environmental assessment - Vol...
I-15 Springville/Spanish Fork Interchange EA - Environmental assessment - Vol...Jay Dawkins
 
2012 Water & Wastewater Master Plan
2012 Water & Wastewater Master Plan2012 Water & Wastewater Master Plan
2012 Water & Wastewater Master PlanCityofKilleen
 
Iri machine international roughness index of asphalte surface
Iri machine international roughness index of asphalte surfaceIri machine international roughness index of asphalte surface
Iri machine international roughness index of asphalte surfaceDr Ezzat Mansour
 
Additional Road Investments Needed to Support Oil & Gas Production and Distri...
Additional Road Investments Needed to Support Oil & Gas Production and Distri...Additional Road Investments Needed to Support Oil & Gas Production and Distri...
Additional Road Investments Needed to Support Oil & Gas Production and Distri...UGPTI
 
World: Transmission Shafts And Cranks, Bearing Housings And Plain Shaft Beari...
World: Transmission Shafts And Cranks, Bearing Housings And Plain Shaft Beari...World: Transmission Shafts And Cranks, Bearing Housings And Plain Shaft Beari...
World: Transmission Shafts And Cranks, Bearing Housings And Plain Shaft Beari...IndexBox Marketing
 
Gf scp final_wmaps[1]why and scp2
Gf scp final_wmaps[1]why and scp2Gf scp final_wmaps[1]why and scp2
Gf scp final_wmaps[1]why and scp2carrieriddle
 
Gf scp final_wmaps[1]
Gf scp final_wmaps[1]Gf scp final_wmaps[1]
Gf scp final_wmaps[1]carrieriddle
 
Gf scp final_wmaps[1]
Gf scp final_wmaps[1]Gf scp final_wmaps[1]
Gf scp final_wmaps[1]carrieriddle
 
Gf scp final_wmaps[1]
Gf scp final_wmaps[1]Gf scp final_wmaps[1]
Gf scp final_wmaps[1]carrieriddle
 
Buildings so r 14 15
Buildings so r 14 15Buildings so r 14 15
Buildings so r 14 15Ptpg Stuc
 
Government Contracting - FAR Supplements - DTAR - Department of Treasury
Government Contracting - FAR Supplements - DTAR - Department of TreasuryGovernment Contracting - FAR Supplements - DTAR - Department of Treasury
Government Contracting - FAR Supplements - DTAR - Department of TreasuryJSchaus & Associates
 
scrubber-discharges-Apr2021.pdf
scrubber-discharges-Apr2021.pdfscrubber-discharges-Apr2021.pdf
scrubber-discharges-Apr2021.pdfAlbertStrating2
 

Similar to 210_MFLA_TS_TrafficReport-2.pdf (20)

Dranesville District 2018 Paving and Restriping
Dranesville District 2018 Paving and RestripingDranesville District 2018 Paving and Restriping
Dranesville District 2018 Paving and Restriping
 
DREAMManual2020.pdf
DREAMManual2020.pdfDREAMManual2020.pdf
DREAMManual2020.pdf
 
FHWA Steel Bridge Design Handbook Volume 14
FHWA Steel Bridge Design Handbook Volume 14 FHWA Steel Bridge Design Handbook Volume 14
FHWA Steel Bridge Design Handbook Volume 14
 
MPR OCT-22 PPT COMBINE.pptx
MPR OCT-22 PPT COMBINE.pptxMPR OCT-22 PPT COMBINE.pptx
MPR OCT-22 PPT COMBINE.pptx
 
3426-360-K-RP-BNT-00001_REVD01 HSE PHILOSOPHY.pdf
3426-360-K-RP-BNT-00001_REVD01 HSE PHILOSOPHY.pdf3426-360-K-RP-BNT-00001_REVD01 HSE PHILOSOPHY.pdf
3426-360-K-RP-BNT-00001_REVD01 HSE PHILOSOPHY.pdf
 
Task 3.a: Inventory of Key Eastern Neighborhood Priority Corridors
Task 3.a:  Inventory of Key Eastern Neighborhood Priority CorridorsTask 3.a:  Inventory of Key Eastern Neighborhood Priority Corridors
Task 3.a: Inventory of Key Eastern Neighborhood Priority Corridors
 
Sample Global Busway_Bus Duct Market Report 2022
Sample Global Busway_Bus Duct Market Report 2022Sample Global Busway_Bus Duct Market Report 2022
Sample Global Busway_Bus Duct Market Report 2022
 
I-15 Springville/Spanish Fork Interchange EA - Environmental assessment - Vol...
I-15 Springville/Spanish Fork Interchange EA - Environmental assessment - Vol...I-15 Springville/Spanish Fork Interchange EA - Environmental assessment - Vol...
I-15 Springville/Spanish Fork Interchange EA - Environmental assessment - Vol...
 
2012 Water & Wastewater Master Plan
2012 Water & Wastewater Master Plan2012 Water & Wastewater Master Plan
2012 Water & Wastewater Master Plan
 
Iri machine international roughness index of asphalte surface
Iri machine international roughness index of asphalte surfaceIri machine international roughness index of asphalte surface
Iri machine international roughness index of asphalte surface
 
Volume i executive summary
Volume i executive summaryVolume i executive summary
Volume i executive summary
 
Additional Road Investments Needed to Support Oil & Gas Production and Distri...
Additional Road Investments Needed to Support Oil & Gas Production and Distri...Additional Road Investments Needed to Support Oil & Gas Production and Distri...
Additional Road Investments Needed to Support Oil & Gas Production and Distri...
 
World: Transmission Shafts And Cranks, Bearing Housings And Plain Shaft Beari...
World: Transmission Shafts And Cranks, Bearing Housings And Plain Shaft Beari...World: Transmission Shafts And Cranks, Bearing Housings And Plain Shaft Beari...
World: Transmission Shafts And Cranks, Bearing Housings And Plain Shaft Beari...
 
Gf scp final_wmaps[1]why and scp2
Gf scp final_wmaps[1]why and scp2Gf scp final_wmaps[1]why and scp2
Gf scp final_wmaps[1]why and scp2
 
Gf scp final_wmaps[1]
Gf scp final_wmaps[1]Gf scp final_wmaps[1]
Gf scp final_wmaps[1]
 
Gf scp final_wmaps[1]
Gf scp final_wmaps[1]Gf scp final_wmaps[1]
Gf scp final_wmaps[1]
 
Gf scp final_wmaps[1]
Gf scp final_wmaps[1]Gf scp final_wmaps[1]
Gf scp final_wmaps[1]
 
Buildings so r 14 15
Buildings so r 14 15Buildings so r 14 15
Buildings so r 14 15
 
Government Contracting - FAR Supplements - DTAR - Department of Treasury
Government Contracting - FAR Supplements - DTAR - Department of TreasuryGovernment Contracting - FAR Supplements - DTAR - Department of Treasury
Government Contracting - FAR Supplements - DTAR - Department of Treasury
 
scrubber-discharges-Apr2021.pdf
scrubber-discharges-Apr2021.pdfscrubber-discharges-Apr2021.pdf
scrubber-discharges-Apr2021.pdf
 

Recently uploaded

ONLINE FOOD ORDER SYSTEM PROJECT REPORT.pdf
ONLINE FOOD ORDER SYSTEM PROJECT REPORT.pdfONLINE FOOD ORDER SYSTEM PROJECT REPORT.pdf
ONLINE FOOD ORDER SYSTEM PROJECT REPORT.pdfKamal Acharya
 
Sheet Pile Wall Design and Construction: A Practical Guide for Civil Engineer...
Sheet Pile Wall Design and Construction: A Practical Guide for Civil Engineer...Sheet Pile Wall Design and Construction: A Practical Guide for Civil Engineer...
Sheet Pile Wall Design and Construction: A Practical Guide for Civil Engineer...Dr.Costas Sachpazis
 
MANUFACTURING PROCESS-II UNIT-2 LATHE MACHINE
MANUFACTURING PROCESS-II UNIT-2 LATHE MACHINEMANUFACTURING PROCESS-II UNIT-2 LATHE MACHINE
MANUFACTURING PROCESS-II UNIT-2 LATHE MACHINESIVASHANKAR N
 
Call Girls Service Nagpur Tanvi Call 7001035870 Meet With Nagpur Escorts
Call Girls Service Nagpur Tanvi Call 7001035870 Meet With Nagpur EscortsCall Girls Service Nagpur Tanvi Call 7001035870 Meet With Nagpur Escorts
Call Girls Service Nagpur Tanvi Call 7001035870 Meet With Nagpur EscortsCall Girls in Nagpur High Profile
 
Processing & Properties of Floor and Wall Tiles.pptx
Processing & Properties of Floor and Wall Tiles.pptxProcessing & Properties of Floor and Wall Tiles.pptx
Processing & Properties of Floor and Wall Tiles.pptxpranjaldaimarysona
 
MANUFACTURING PROCESS-II UNIT-5 NC MACHINE TOOLS
MANUFACTURING PROCESS-II UNIT-5 NC MACHINE TOOLSMANUFACTURING PROCESS-II UNIT-5 NC MACHINE TOOLS
MANUFACTURING PROCESS-II UNIT-5 NC MACHINE TOOLSSIVASHANKAR N
 
UNIT-III FMM. DIMENSIONAL ANALYSIS
UNIT-III FMM.        DIMENSIONAL ANALYSISUNIT-III FMM.        DIMENSIONAL ANALYSIS
UNIT-III FMM. DIMENSIONAL ANALYSISrknatarajan
 
UNIT-II FMM-Flow Through Circular Conduits
UNIT-II FMM-Flow Through Circular ConduitsUNIT-II FMM-Flow Through Circular Conduits
UNIT-II FMM-Flow Through Circular Conduitsrknatarajan
 
Call Girls Service Nashik Vaishnavi 7001305949 Independent Escort Service Nashik
Call Girls Service Nashik Vaishnavi 7001305949 Independent Escort Service NashikCall Girls Service Nashik Vaishnavi 7001305949 Independent Escort Service Nashik
Call Girls Service Nashik Vaishnavi 7001305949 Independent Escort Service NashikCall Girls in Nagpur High Profile
 
Coefficient of Thermal Expansion and their Importance.pptx
Coefficient of Thermal Expansion and their Importance.pptxCoefficient of Thermal Expansion and their Importance.pptx
Coefficient of Thermal Expansion and their Importance.pptxAsutosh Ranjan
 
Introduction to IEEE STANDARDS and its different types.pptx
Introduction to IEEE STANDARDS and its different types.pptxIntroduction to IEEE STANDARDS and its different types.pptx
Introduction to IEEE STANDARDS and its different types.pptxupamatechverse
 
Call for Papers - African Journal of Biological Sciences, E-ISSN: 2663-2187, ...
Call for Papers - African Journal of Biological Sciences, E-ISSN: 2663-2187, ...Call for Papers - African Journal of Biological Sciences, E-ISSN: 2663-2187, ...
Call for Papers - African Journal of Biological Sciences, E-ISSN: 2663-2187, ...Christo Ananth
 
MANUFACTURING PROCESS-II UNIT-1 THEORY OF METAL CUTTING
MANUFACTURING PROCESS-II UNIT-1 THEORY OF METAL CUTTINGMANUFACTURING PROCESS-II UNIT-1 THEORY OF METAL CUTTING
MANUFACTURING PROCESS-II UNIT-1 THEORY OF METAL CUTTINGSIVASHANKAR N
 
result management system report for college project
result management system report for college projectresult management system report for college project
result management system report for college projectTonystark477637
 
VIP Call Girls Ankleshwar 7001035870 Whatsapp Number, 24/07 Booking
VIP Call Girls Ankleshwar 7001035870 Whatsapp Number, 24/07 BookingVIP Call Girls Ankleshwar 7001035870 Whatsapp Number, 24/07 Booking
VIP Call Girls Ankleshwar 7001035870 Whatsapp Number, 24/07 Bookingdharasingh5698
 
Porous Ceramics seminar and technical writing
Porous Ceramics seminar and technical writingPorous Ceramics seminar and technical writing
Porous Ceramics seminar and technical writingrakeshbaidya232001
 
Glass Ceramics: Processing and Properties
Glass Ceramics: Processing and PropertiesGlass Ceramics: Processing and Properties
Glass Ceramics: Processing and PropertiesPrabhanshu Chaturvedi
 
(ANVI) Koregaon Park Call Girls Just Call 7001035870 [ Cash on Delivery ] Pun...
(ANVI) Koregaon Park Call Girls Just Call 7001035870 [ Cash on Delivery ] Pun...(ANVI) Koregaon Park Call Girls Just Call 7001035870 [ Cash on Delivery ] Pun...
(ANVI) Koregaon Park Call Girls Just Call 7001035870 [ Cash on Delivery ] Pun...ranjana rawat
 
Call for Papers - Educational Administration: Theory and Practice, E-ISSN: 21...
Call for Papers - Educational Administration: Theory and Practice, E-ISSN: 21...Call for Papers - Educational Administration: Theory and Practice, E-ISSN: 21...
Call for Papers - Educational Administration: Theory and Practice, E-ISSN: 21...Christo Ananth
 

Recently uploaded (20)

ONLINE FOOD ORDER SYSTEM PROJECT REPORT.pdf
ONLINE FOOD ORDER SYSTEM PROJECT REPORT.pdfONLINE FOOD ORDER SYSTEM PROJECT REPORT.pdf
ONLINE FOOD ORDER SYSTEM PROJECT REPORT.pdf
 
Sheet Pile Wall Design and Construction: A Practical Guide for Civil Engineer...
Sheet Pile Wall Design and Construction: A Practical Guide for Civil Engineer...Sheet Pile Wall Design and Construction: A Practical Guide for Civil Engineer...
Sheet Pile Wall Design and Construction: A Practical Guide for Civil Engineer...
 
MANUFACTURING PROCESS-II UNIT-2 LATHE MACHINE
MANUFACTURING PROCESS-II UNIT-2 LATHE MACHINEMANUFACTURING PROCESS-II UNIT-2 LATHE MACHINE
MANUFACTURING PROCESS-II UNIT-2 LATHE MACHINE
 
Call Girls Service Nagpur Tanvi Call 7001035870 Meet With Nagpur Escorts
Call Girls Service Nagpur Tanvi Call 7001035870 Meet With Nagpur EscortsCall Girls Service Nagpur Tanvi Call 7001035870 Meet With Nagpur Escorts
Call Girls Service Nagpur Tanvi Call 7001035870 Meet With Nagpur Escorts
 
Processing & Properties of Floor and Wall Tiles.pptx
Processing & Properties of Floor and Wall Tiles.pptxProcessing & Properties of Floor and Wall Tiles.pptx
Processing & Properties of Floor and Wall Tiles.pptx
 
MANUFACTURING PROCESS-II UNIT-5 NC MACHINE TOOLS
MANUFACTURING PROCESS-II UNIT-5 NC MACHINE TOOLSMANUFACTURING PROCESS-II UNIT-5 NC MACHINE TOOLS
MANUFACTURING PROCESS-II UNIT-5 NC MACHINE TOOLS
 
UNIT-III FMM. DIMENSIONAL ANALYSIS
UNIT-III FMM.        DIMENSIONAL ANALYSISUNIT-III FMM.        DIMENSIONAL ANALYSIS
UNIT-III FMM. DIMENSIONAL ANALYSIS
 
UNIT-II FMM-Flow Through Circular Conduits
UNIT-II FMM-Flow Through Circular ConduitsUNIT-II FMM-Flow Through Circular Conduits
UNIT-II FMM-Flow Through Circular Conduits
 
Call Girls Service Nashik Vaishnavi 7001305949 Independent Escort Service Nashik
Call Girls Service Nashik Vaishnavi 7001305949 Independent Escort Service NashikCall Girls Service Nashik Vaishnavi 7001305949 Independent Escort Service Nashik
Call Girls Service Nashik Vaishnavi 7001305949 Independent Escort Service Nashik
 
Coefficient of Thermal Expansion and their Importance.pptx
Coefficient of Thermal Expansion and their Importance.pptxCoefficient of Thermal Expansion and their Importance.pptx
Coefficient of Thermal Expansion and their Importance.pptx
 
Introduction to IEEE STANDARDS and its different types.pptx
Introduction to IEEE STANDARDS and its different types.pptxIntroduction to IEEE STANDARDS and its different types.pptx
Introduction to IEEE STANDARDS and its different types.pptx
 
Call for Papers - African Journal of Biological Sciences, E-ISSN: 2663-2187, ...
Call for Papers - African Journal of Biological Sciences, E-ISSN: 2663-2187, ...Call for Papers - African Journal of Biological Sciences, E-ISSN: 2663-2187, ...
Call for Papers - African Journal of Biological Sciences, E-ISSN: 2663-2187, ...
 
MANUFACTURING PROCESS-II UNIT-1 THEORY OF METAL CUTTING
MANUFACTURING PROCESS-II UNIT-1 THEORY OF METAL CUTTINGMANUFACTURING PROCESS-II UNIT-1 THEORY OF METAL CUTTING
MANUFACTURING PROCESS-II UNIT-1 THEORY OF METAL CUTTING
 
result management system report for college project
result management system report for college projectresult management system report for college project
result management system report for college project
 
VIP Call Girls Ankleshwar 7001035870 Whatsapp Number, 24/07 Booking
VIP Call Girls Ankleshwar 7001035870 Whatsapp Number, 24/07 BookingVIP Call Girls Ankleshwar 7001035870 Whatsapp Number, 24/07 Booking
VIP Call Girls Ankleshwar 7001035870 Whatsapp Number, 24/07 Booking
 
Porous Ceramics seminar and technical writing
Porous Ceramics seminar and technical writingPorous Ceramics seminar and technical writing
Porous Ceramics seminar and technical writing
 
Glass Ceramics: Processing and Properties
Glass Ceramics: Processing and PropertiesGlass Ceramics: Processing and Properties
Glass Ceramics: Processing and Properties
 
(ANVI) Koregaon Park Call Girls Just Call 7001035870 [ Cash on Delivery ] Pun...
(ANVI) Koregaon Park Call Girls Just Call 7001035870 [ Cash on Delivery ] Pun...(ANVI) Koregaon Park Call Girls Just Call 7001035870 [ Cash on Delivery ] Pun...
(ANVI) Koregaon Park Call Girls Just Call 7001035870 [ Cash on Delivery ] Pun...
 
Call for Papers - Educational Administration: Theory and Practice, E-ISSN: 21...
Call for Papers - Educational Administration: Theory and Practice, E-ISSN: 21...Call for Papers - Educational Administration: Theory and Practice, E-ISSN: 21...
Call for Papers - Educational Administration: Theory and Practice, E-ISSN: 21...
 
(INDIRA) Call Girl Aurangabad Call Now 8617697112 Aurangabad Escorts 24x7
(INDIRA) Call Girl Aurangabad Call Now 8617697112 Aurangabad Escorts 24x7(INDIRA) Call Girl Aurangabad Call Now 8617697112 Aurangabad Escorts 24x7
(INDIRA) Call Girl Aurangabad Call Now 8617697112 Aurangabad Escorts 24x7
 

210_MFLA_TS_TrafficReport-2.pdf

  • 1. F I N A L R E P O R T TRAFFIC OPERATIONS ANALYSIS REPORT SR-210 MIXED FLOW LANE ADDITION FROM HIGHLAND AVENUE (PM R25.0) TO SAN BERNARDINO AVENUE (PM R33.2) IN THE COUNTY OF SAN BERNARDINO EA 0C700 Prepared for SAN BERNARDINO ASSOCIATED GOVERNMENTS In conjunction with Caltrans – District 8 February 2014 2020 East First Street, Suite 400 Santa Ana, California 92705
  • 2. 08-SBD-210 PM R25.0/R33.2 EA 0C700, Project No. 0812000164 SR-210 Mixed Flow Lane Addition Project i Traffic Operations Analysis Revised: February 2014 TABLE OF CONTENTS 1.0 INTRODUCTION...............................................................................................................................................3 Background .............................................................................................................................................. 3 2.0 TRAVEL DEMAND FORECAST MODEL ........................................................................................................6 SBTAM Model Background ..................................................................................................................... 6 SANBAG Traffic Modeling Data.............................................................................................................. 6 Project SBTAM Traffic Modeling Scenarios .......................................................................................... 6 Model Conversion and Post Processing Methodology........................................................................ 7 Traffic Model Projections for 2020 Project Opening and 2040 Future Year Project Conditions...... 7 3.0 ANALYSIS METHODOLOGY...........................................................................................................................8 Basic Freeway Segments ........................................................................................................................ 9 Weave Segments.................................................................................................................................... 10 Freeway Merge and Diverge Segments ............................................................................................... 11 4.0 EXISTING (2012) TRAFFIC CONDITIONS....................................................................................................13 Existing Volumes ................................................................................................................................... 13 Existing Truck Data................................................................................................................................ 14 Existing Traffic Conditions.................................................................................................................... 15 5.0 OPENING YEAR (2020) TRAFFIC CONDITIONS .........................................................................................20 Opening Year (2020) - No Build Traffic Conditions ............................................................................ 20 Opening Year 2020 - Build Traffic Conditions..................................................................................... 25 6.0 HORIZON YEAR (2040) TRAFFIC CONDITIONS .........................................................................................30 Horizon Year (2040) - No Build Traffic Conditions.............................................................................. 30 Horizon Year (2040) - Build Traffic Conditions.................................................................................... 35 7.0 SUMMARY AND CONCLUSION....................................................................................................................40 APPENDICES Appendix A – Traffic Model Projections Appendix B – Traffic Analysis Worksheets Appendix C – SR-210 Traffic Volume Summary, Traffic Counts and Volume Factors
  • 3. 08-SBD-210 PM R25.0/R33.2 EA 0C700, Project No. 0812000164 SR-210 Mixed Flow Lane Addition Project ii Traffic Operations Analysis Revised: February 2014 FIGURES AND TABLES List of Figures Figure 1: Project Location Map ............................................................................................................................... 5 Figure 2: Existing (2012) Freeway Mainline and Ramp Geometrics..................................................................... 16 Figure 3: Existing (2012) Freeway Mainline and Ramp Volumes......................................................................... 17 Figure 4: Opening Year (2020) - No Build Freeway Mainline and Ramp Geometrics.......................................... 21 Figure 5: Opening Year (2020) - No Build Freeway Mainline and Ramp Volumes .............................................. 22 Figure 6: Opening Year (2020) - Build Freeway Mainline and Ramp Geometrics................................................ 26 Figure 7: Opening Year (2020) - Build Freeway Mainline and Ramp Volumes.................................................... 27 Figure 8: Horizon Year (2040) - No Build Freeway Mainline and Ramp Geometrics ........................................... 31 Figure 9: Horizon Year (2040) - No Build Freeway Mainline and Ramp Volumes................................................ 32 Figure 10: Horizon Year (2040) - Build Freeway Mainline and Ramp Geometrics............................................... 36 Figure 11: Horizon Year (2040) - Build Freeway Mainline and Ramp Volumes ................................................... 37 List of Tables Table 1: LOS Criteria for Basic Freeway Segments ............................................................................................. 10 Table 2: LOS Criteria for Weaving Segments....................................................................................................... 11 Table 3: LOS Freeway Merge and Diverge Segments ......................................................................................... 12 Table 4: Existing (2012) - SR-210 Eastbound Mainline and Ramp Operations LOS ........................................... 18 Table 5: Existing (2012) - SR-210 Westbound Mainline and Ramp Operations LOS .......................................... 19 Table 6: Opening Year (2020) SR-210 - No Build Eastbound Mainline and Ramp Operations LOS................... 23 Table 7: Opening Year (2020) SR-210 - No Build Westbound Mainline and Ramp Operations LOS.................. 24 Table 8: Opening Year (2020) SR-210 - Build Eastbound Mainline and Ramp Operations LOS......................... 28 Table 9: Opening Year (2020) SR-210 – Build Westbound Mainline and Ramp Operations LOS....................... 29 Table 10: Horizon Year (2040) SR-210 – No Build Eastbound Mainline and Ramp Operations LOS ................. 33 Table 11: Horizon Year (2040) SR-210 – No Build Westbound Mainline and Ramp Operations LOS ................ 34 Table 12: Horizon Year (2040) SR-210 – Build Eastbound Mainline and Ramp Operations LOS....................... 38 Table 13: Horizon Year (2040) SR-210 – Build Westbound Mainline and Ramp Operations LOS...................... 39
  • 4. 08-SBD-210 PM R25.0/R33.2 EA 0C700, Project No. 0812000164 SR-210 Mixed Flow Lane Addition Project 3 Traffic Operations Analysis Revised: February 2014 TRAFFIC OPERATIONS ANALYSIS 1.0 INTRODUCTION This report presents the results of the traffic operations analysis conducted for the State Route 210 (SR-210) Mixed Flow Lane Addition Project (“Project’) in San Bernardino County. The proposed improvements are located within Caltrans District 8 jurisdiction, from post mile (PM) R25.0 to R33.2. The traffic study area includes the freeway mainline and ramp merge and diverge areas from west of Highland Avenue/Arden Avenue to east of San Bernardino Avenue. The scope and Purpose and Need of the project focuses primarily on the mainline segment lane addition and associated improvements only. The project proposes to add one mixed flow lane in each direction within the median of SR-210, create auxiliary lanes between the Base Line and Fifth Street interchanges and add an acceleration lane at the eastbound Fifth Street on-ramp. The auxiliary lanes between Base Line and 5th Street will be created by extending the existing deceleration lanes at the off-ramps back to the adjacent interchange’s on-ramps. Existing (2012), Opening Year (2020) and Horizon Year (2040) conditions were analyzed in this traffic operations analysis report. Existing (2012) used as baseline which is the year that environmental studies were initiated. Background A Project Study Report/Project Development Support (PSR/PDS) was approved in 2008. The PSR/PDS had originally called for providing one additional mixed flow lane in each direction from Highland Avenue to San Bernardino Avenue and one new HOV lane in each direction from I-215 to I-10. The current project is to provide one additional mixed flow lane in each direction from Highland Avenue to San Bernardino Avenue plus associated auxiliary lane and acceleration lane improvements. The SR-210 Mixed Flow Lane Addition Project is located within the Valley Region Planning Area as described in the San Bernardino County General Plan. The cities of Highland in the north and Redlands in the south surround much of the project study area. Adjacent jurisdictions include the City of San Bernardino and unincorporated areas of San Bernardino County. State Route 210 (SR-210) State Route 210 (SR-210), refers to the eastern segment and extension of Interstate 210 (I- 210). SR-210 comprises the segment starting at the east end of the I-210, in the City of San Dimas, and extends eastward for approximately 33.2 miles, reaching the terminus at Interstate 10 in the City of Redlands. Within the project limits, the SR-210 provides adjacent junctions onto Interstate 15, Interstate 215, State Route 259, State Route 18, State Route 330, Interstate 10 and, adjacent interchanges onto Highland Avenue, Base Line, 5th Street/Greenspot Road and San Bernardino Avenue. A new future service interchange is under consideration at Victoria Avenue, 0.6 miles east of the Highland Avenue interchange and 1.3 miles west of the SR-210 to SR-330 interchange, approximately at PM R27.8. SR-210 is included in the National Highway System, the California Freeway and Expressway System and the “12 foot Wide Arterial System”. The SR-210, within the project limit, is classified as a Principal Arterial highway.
  • 5. 08-SBD-210 PM R25.0/R33.2 EA 0C700, Project No. 0812000164 SR-210 Mixed Flow Lane Addition Project 4 Traffic Operations Analysis Revised: February 2014 West of the Project (west of Highland Avenue) SR-210 consists of three mixed flow lanes in each direction. East of the Project (east of San Bernardino Avenue) SR-210 consists of four mixed flow lanes in each direction. State Route 330 (SR-330) State Route 330 (SR-330) is a 15 mile freeway/conventional two-lane highway where the westerly segment begins at the junction of the SR-210 and extends northeasterly to SR-18. SR- 330 is mostly considered a conventional two-lane highway as only the initial 1-mile segment from the junction at SR-210 is constructed to freeway standards. SR-330 is located within San Bernardino County and is utilized as one of the main accesses into the cities of Big Bear and Lake Arrowhead. Access from east/westbound SR-210, onto northbound SR-330 is provided via connector ramps and access onto east/westbound SR-210 from southbound SR-330 is provided also via connector ramps. Interstate 10 (I-10) Interstate 10 (I-10), within the state of California, is a major east-west interstate highway that spans approximately 250 miles starting in the City of Santa Monica and ending in the City of Blythe. The segment of I-10 adjacent to the Project, where it serves as the terminus for the SR- 210, is located at post mile marker 77.3. Access between east/westbound SR-210 and east/westbound I-10 is provided via connector ramps.
  • 6. SR-210 Mixed Flow Lane Addition (PM R26.0/R33.2) - EA 0C700 K:2012SR-210 Mixed Flow Lane AdditionFigures.ai Governments SANBAG Working T ogether Governments SANBAG Working T ogether LOMA LINDA LOMA LINDA SAN BERNARDINO SAN BERNARDINO HIGHLAND 3RD ST ALMOND AV ORANGE ST E HIGHLAND AV HUGO ST X ST TEXAS ST SANTA ANA RIVER TR BRYN MAWR AV MILLAR ST W ST PERIMETER RD W LUGONIA AV ALABAMA ST PALMETTO AV Y ST MILL ST GUIDO AV 5TH ST CYPRESS ST ALT A ST VA LA RIA DR BELL CT BNSF RR CHURCH AV 14TH ST PALM AV T IA R A A V E PACIFIC ST VICTOR AV ARDEN AV PIONEER AV MEINES ST CALH OUN ST 6TH ST BUCKEYE ST B O U L D E R A V LASHEART DR DOMESTIC AV 7TH ST 9TH ST 11TH ST EUCALYPTUS DR WEBSTER ST N BOULDER AV TE NN ES SE E ST PLUM LN BASE LINE CIE NE GA DR FISHER ST W PALMETTO AV SA N FR AN CI SC O ST U ST COLE AV VICTORIA AV CITRUS PLAZA DR WARD ST I-10 E EXIT 75 S T R E A T E R A V GRAPE ST I-10 W EXIT 76 MESSINA ST BONITA DR SAN BERNARDINO AV NEVADA ST ELISE DR LYNWOOD WY ROGERS LN VILLA AV LASSEN ST HERALD ST E 17TH ST MIDWAY I-10 W EXIT 75 MAIN ST 13TH ST LUNT LN HARLAN LN MANSFIELD ST BALDWIN AV DUNKIRK AV E 21ST ST KARON ST MERRIDY AV RUBY AV ATLANTIC AV 107TH ST NEWCOMB ST SR-30 E EXIT 34 E SUNRISE LN BRA DFO RD AV SPARKS ST NONA AV N SEINE AV 10TH ST ARGYLE AV HARTZELL AV LIVE OAK RD INDIANA CT W PIONEER AV NEWCASTLE RD N W E S T F R O N T A E RAINBOW LN SAGUARO WY OAK RIDGE RD G R O V E A V RESEARCH DR BRUCE ST STERLING AV SEVILLE AV BROWNING RD 1 0 0 T H S T LAWTON ST ROCKFORD AV DR UM MO ND AV C A V E S T WESTERN AV NORWOOD ST BAN GOR AV ROGERS ST DUNDEE AV FLEMING ST C A R LS O N AV CLYD ESD ALE ST TROLLEY WY EAS TVI EW DR 7TH ST 14TH ST REDLANDS A ð A ³ SANTA ANA RIVER A ³ ! " $̀ C IT Y C R E E K SAND CREEK PLUNGE CREEK Figure 1 Project Location Map
  • 7. 08-SBD-210 PM R25.0/R33.2 EA 0C700, Project No. 0812000164 SR-210 Mixed Flow Lane Addition Project 6 Traffic Operations Analysis Revised: February 2014 2.0 TRAVEL DEMAND FORECAST MODEL This section discusses the traffic forecast model developed by SANBAG specifically for use within San Bernardino County. The current SANBAG model is a sub-regional (subset) of the regional Southern California Associated Governments (SCAG) Model and incorporates more refined local details otherwise not included in larger scale regional models. The SANBAG Model incorporates elements of the most recent Regional Transportation Plan (RTP) (2012- 2035) as compared to the earlier SCAG Model used in the preparation of the 2008 PSR/PDS document for this project. The development of the San Bernardino County Transportation Analysis Model (SBTAM) was completed in June 2012, in partnership with Southern California Association of Governments (SCAG). SBTAM Model Background According to SANBAG, the San Bernardino Transportation Analysis Model, (SBTAM) “replaces the former RIVSAN subregional travel demand model, which is no longer being supported by SCAG. The model is designed as the primary travel demand forecasting tool for use throughout San Bernardino County, including the Valley, Victor Valley, Morongo Basin, and other Mountain/Desert subareas. Some of the anticipated uses of SBTAM include: highway design and environmental studies, traffic impact analysis reports for development projects, general plans, land use policy analysis, and subregional transportation studies. SBTAM will also be used for development of the County Transportation Plan, being initiated in Fiscal Year 2012- 2013.” SANBAG Traffic Modeling Data SANBAG currently has the 2008 and 2035 San Bernardino Traffic Analysis Model (SBTAM) traffic model networks applicable for the proposed project and study area. The current SBTAM model had been modified to reflect the no build and build conditions of the proposed project for traffic forecasting needs. The applicable 2008 and 2035 SBTAM model forecast output volumes were provided by SANBAG. The provided model data, however, are mixed-flow traffic volume forecast only, and do not contain separate truck only model forecast volumes. Project SBTAM Traffic Modeling Scenarios The following traffic modeling data scenarios and detailed content description were used in the development of project opening year (2020) and project design year (2040) No Build and Build conditions. Future Year No Build Alternative (2035): ƒ Include all programmed improvements from the RTP, except: o Delete the SR-210 Mixed Flow Lane Addition Project and all of its associated improvements from Highland Avenue to San Bernardino Avenue (i.e. this segment should generally be modeled as 2 mixed flow lanes in each direction); o Delete the proposed auxiliary lanes between Base Line and 5th Street;
  • 8. 08-SBD-210 PM R25.0/R33.2 EA 0C700, Project No. 0812000164 SR-210 Mixed Flow Lane Addition Project 7 Traffic Operations Analysis Revised: February 2014 o Delete the proposed southbound acceleration lane at the 5th Street on-ramp. ƒ Include all of the SR-210/Base Line Interchange Improvement Project improvements (including widening Base Line from Church Avenue to Boulder Avenue and widening the ramps). Future Year Build Alternative (2035): ƒ Include all programmed improvements from the RTP with the exception of the SR-210 HOV lanes. ƒ Include all of the SR-210 Mixed Flow Lane Addition Project improvements. Model Conversion and Post Processing Methodology The traffic model post-processing methodology follows and is consistent with SANBAG’s future forecasting standards and requirements as outlined in Appendix H – Post Processed Traffic Volume Guidelines from the San Bernardino County CMP documentation. SANBAG’s traffic modeling output is expressed in terms of peak period traffic forecasts. In order to utilize the data, SANBAG has developed conversion factors to convert peak period volumes into usable peak hour volumes for use in the traffic analysis, which are summarized below. Model Conversion Factors The following conversion factors are applied to derive peak period traffic volume forecast from the traffic model peak period volume forecast. The intent is to develop usable peak hour AM/PM analysis volumes from the peak period AM/PM forecast. Passenger Car Model AM peak hour = 0.38 x AM peak period PM peak hour = 0.28 x PM peak period Traffic Model Projections for 2020 Project Opening and 2040 Future Year Project Conditions Based on the traffic modeling updates described above, SANBAG had developed Year 2008 and Year 2035 Model run forecasts which were subsequently post-processed to develop Opening Year 2020 and Horizon Year 2040 traffic volume projections. Consistent with the methodology used in similar projects in the area and as an acceptable method with SANBAG, the forecasted traffic volume differential between the 2008 and 2035 conditions was used to determine an annualized growth rate. Using Year 2012 as the pivot year, the annualized growth factors were used to develop Opening Year 2020 and Horizon Year 2040 projected traffic volumes. This straight-line extrapolation may over or under predict future volumes; however, it is considered an acceptable method of estimation for planning purposes given the overall accuracy level of the model’s future year forecasts. The results of the traffic model forecast post processing is summarized in Appendix A.
  • 9. 08-SBD-210 PM R25.0/R33.2 EA 0C700, Project No. 0812000164 SR-210 Mixed Flow Lane Addition Project 8 Traffic Operations Analysis Revised: February 2014 Related Projects in the Study Area In addition to the proposed SR-210 Mixed Flow Lane Addition project (the project) the following projects are planned within the limits of the project. These projects are included in the 2035 San Bernardino Traffic Analysis Model (SBTAM) and were reviewed in the development of the Mixed Flow Lane Addition project traffic analysis modeling. SR-210/Base Line Interchange Improvement Project This project is included as a Financially Constrained Project (RTP ID 4M07007) in the SCAG 2012-2035 RTP. This improvement includes widening of at the ramps and ramp terminal junctions and is included in both 2035 No Build and Build Model. SR-210/Victoria Avenue Interchange Project A Project Study Report/Project Development Support (PSR/PDS) for the SR-210/Victoria Avenue Interchange was approved by Caltrans on April 8, 2011 to evaluate the feasibility of constructing a new interchange within the city limits of Highland and San Bernardino on SR-210 at Victoria Avenue. This project is included as a Financially Constrained Project (RTP ID 4M0801) in the SCAG 2012-2035 RTP. This project is included in both the 2035 No Build and Build Models. SR-210 HOV Lane Addition Project This project calls for the addition of one HOV lane in each direction between I-215 and I-10. Based on the 2012-2035 RTP, the HOV project is also in the Financially Constrained Project list. In order to assess the environmental impacts of the Mixed Flow Lane Addition project, the HOV Lane Addition project was not included in the 2035 No Build model used in the analysis. Consistent with the No Build assumption, the HOV Lane Addition project was similarly not included in the 2035 Build model. This approach ensures consistency of assumptions used in the evaluation of the traffic impacts for the Mixed Flow Lane Addition project. 3.0 ANALYSIS METHODOLOGY This report documents the evaluation of the traffic operations of the SR-210 Mixed Flow Lane Addition Project (the “project”) which is generally defined as the segment of SR-210 between Highland Avenue/Arden Avenue and San Bernardino Avenue. The analysis evaluated Existing (2012) conditions, Opening Year (2020) conditions and Horizon Year (2040) conditions. In consultation with Caltrans District 8 staff, the project traffic operational analysis was conducted in accordance with the procedures outlined in the 2010 Edition of the Highway Capacity Manual which hereinafter will also be referred to as “HCM 2010” or “HCM”. The HCM 2010 offers a significant update to the analysis procedures outlined from the previous version, HCM 2000. As described in Volume 2 (“Uninterrupted Flow”) of the HCM 2010, and for purposes of evaluating the proposed project, SR-210 will be divided into various segments for analysis. Descriptions of the freeway facility components and the methodologies used to analyze them are described below.
  • 10. 08-SBD-210 PM R25.0/R33.2 EA 0C700, Project No. 0812000164 SR-210 Mixed Flow Lane Addition Project 9 Traffic Operations Analysis Revised: February 2014 Basic Freeway Segments A basic freeway segment is a section of the freeway mainline which is not within a ramp influence area (i.e., not within 1,500 feet of a ramp junction) or weaving segment. Adding or dropping a lane results in the termination of a basic freeway segment. Peak hour volumes on basic freeway segments are analyzed using the methodology described in the HCM Chapter 11 (“Basic Freeway Segments”) and Highway Capacity Software (HCS 2010, Version 6.4). The TOAR did not evaluate segments between off and on ramps (within the interchanges) since mainline freeway segment operations within these areas will always result in levels of service as good or better than the upstream mainline segments prior to the interchanges. The upgraded HCS 2010, Version 6.4 implements and automates the HCM 2010 procedures and includes modules to implement the new procedures for Basic Freeway Segments and will be used in the evaluation of the proposed project. Table 1 provides the LOS criteria for basic freeway segments characterized by three performance measures, namely: density in passenger cars per mile per lane (pc/mi/ln), space mean speed in miles per hour (mi/h), and ratio of demand flow rate (volume) to capacity (v/c). According to the HCM 2010, “speed is a constant through a broad range of flows and the v/c ratio is not directly discernible to road users (except at capacity), the service measure for basic freeway segments is density.”
  • 11. 08-SBD-210 PM R25.0/R33.2 EA 0C700, Project No. 0812000164 SR-210 Mixed Flow Lane Addition Project 10 Traffic Operations Analysis Revised: February 2014 Table 1: LOS Criteria for Basic Freeway Segments LOS Density (pc/mi/ln) A ≤11 B >11-18 C >18-26 D >26-35 E >35-45 Demand exceeds capacity F >45 Source: Exhibit 11-5 from Highway Capacity Manual 2010. Determining free-flow speed (FFS) According to the HCM, the freeway FFS is best measured in the field, however, sometimes it is not possible to make field measurements e.g. future design for future facilities. In this instance, the segment’s FFS may be estimated by using Equation 11-1 of the HCM, which is based on the physical characteristics of the segment under study and is illustrated below: FFS = 75.4 – fLW – fLC – 3.22TRD0.84 where FFS = FFS of basic freeway segment (mi/h) fLW = adjustment for lane width (mi/h) fLC = adjustment for right-side lateral clearance (mi/h), and TRD = total ramp density (ramps/mi) Weave Segments The HCM 2010 defines weaving as the crossing of two or more traffic streams traveling in the same direction along a significant length of highway without the aid of traffic control devices or guide signs. Weave segments occur when merge segments are closely followed by diverge segments. The “close” condition implies that there is not sufficient distance between the merge and diverge segments for them to operate independently from each other. Peak hour volumes within the freeway weaving sections are analyzed using the methodology contained in HCM Chapter 12 (“Freeway Weaving Segments”). A weaving segment’s performance is primarily influenced by three key geometric characteristics, namely: length, width and configuration. An eight-step HCM flowchart shown in Chapter 12, Exhibit 12-6 Weaving Methodology Flowchart describes the basic steps that define the methodology for analyzing freeway weaving segments. The upgraded HCS 2010, Version 6.4 implements and automates the HCM 2010 procedures and includes modules to implement the new procedures for Weave Segments and will be used in the evaluation of the proposed project. The LOS criteria for weaving segments are described in Table 2.
  • 12. 08-SBD-210 PM R25.0/R33.2 EA 0C700, Project No. 0812000164 SR-210 Mixed Flow Lane Addition Project 11 Traffic Operations Analysis Revised: February 2014 Table 2: LOS Criteria for Weaving Segments LOS Density (pc/mi/ln) A 0-10 B > 10-20 C > 20-28 D > 28-35 E > 35 F Demand exceeds capacity Source: Exhibit 12-10 from Highway Capacity Manual 2010. Determining weaving speeds According to the HCM, the heart of the weaving segment methodology is the estimation of average speeds of weaving and non-weaving vehicles in the weaving segment. These speeds are estimated separately because they are affected by various factors and can be significantly different from each other. The algorithm for predicting the average speed of weaving vehicles in a weaving segment is illustrated by Equation 12-17 of the HCM. In cases that require the FFS to be estimated, the methodology described in Chapter 11, Basic Freeway Segments is used. The average speed of weaving vehicles within the weaving segment is estimated by using Equations 12-8 and 12-9 of the HCM. Freeway Merge and Diverge Segments The following five-step HCM 2010 methodology is used to analyze ramp-freeway junctions calibrated specifically for one-lane, right-side ramp freeway junctions applicable for merge and diverge segments. Specific details of the computational steps and directions are provided in Chapter 13 (“Freeway Merge and Diverge Segments”) of the HCM. For all other cases such as two-lane ramp junctions, left side ramps and major merge and diverge configurations, the analyses are conducted according to the procedures outlined in the Special Cases Section. Step 1 – Specify Inputs and Convert Demand Volumes to Demand Flow. Step 2 – Estimate the Approaching Flow Rate in Lanes 1 and 2 of the Freeway Immediately Upstream of the Ramp Influence Area. Step 3 – Estimate the Capacity of the Ramp-Freeway Junction and Compare with Demand Flow Rates. Step 4 – Estimate Density in the Ramp Influence Area and Determine the Prevailing LOS. Step 5 – Estimate Speeds in the Vicinity of Ramp-Freeway Junctions. The above steps are illustrated in the HCM 2010, Exhibit 13-4 Flowchart for Analysis of Ramp- Freeway Junctions. According to the HCM, other freeway lanes may be affected by merging or diverging maneuvers, but the defined area within 1,500 feet of the ramp junction generally experiences the greatest impacts across all Level of Service. Based on Figures 504.2A and 504.2B in the Highway Design Manual (HDM), as per California design standards, the default
  • 13. 08-SBD-210 PM R25.0/R33.2 EA 0C700, Project No. 0812000164 SR-210 Mixed Flow Lane Addition Project 12 Traffic Operations Analysis Revised: February 2014 acceleration and deceleration lengths employed in the evaluation of ramp merge and diverge areas are 600 feet and 141 feet, respectively. The upgraded HCS 2010, Version 6.4 implements and automates the HCM 2010 procedures described above and includes modules to implement the new procedures for Freeway Merge and Diverge Segments and will be used in the evaluation of the proposed project. The LOS criteria for merge and diverge segments are described in Table 3 below. Table 3: LOS Freeway Merge and Diverge Segments LOS Density (pc/mi/ln) Comments A 0-10 Unrestricted operations B > 10-20 Merging and diverging maneuvers noticeable to drivers C > 20-28 Influence area speeds begin to decline D > 28-35 Influence area turbulence becomes intrusive E > 35 Turbulence felt by virtually all drivers F Demand exceeds capacity Ramp and freeway queues form Source: Exhibit 13-2 from Highway Capacity Manual 2010. Determining free-flow speed (FFS) The HCM 2010 recommends that the freeway FFS is best measured in the field. However, if field measurements are not available, FFS for Freeway Merge and Diverge Segments may be estimated using the methodology used to determine the FFS for basic freeway segments presented in Chapter 11, Basic Freeway Segments.
  • 14. 08-SBD-210 PM R25.0/R33.2 EA 0C700, Project No. 0812000164 SR-210 Mixed Flow Lane Addition Project 13 Traffic Operations Analysis Revised: February 2014 4.0 EXISTING (2012) TRAFFIC CONDITIONS The existing SR-210 mainline within the project limits is generally a four-lane freeway facility. Freeway ramps are provided at Highland Avenue and Arden Avenue, freeway connectors are provided at the SR-330 Junction, and interchanges currently exist at Base Line, 5th Street and San Bernardino Avenue. This section of the report presents the existing freeway operations analysis results. Existing Volumes Existing mainline counts were developed based on weekday (Tuesday, Wednesday, and Thursday) data from Caltrans’ Traffic Data Report (15 Minute Loop Data) for the period between October 16 and October 25, 2012. The 15 minute loop counts are provided for five locations for AM and PM peak hours, 6-9 AM and 3-7 PM respectively. The five locations along SR-210 mainline are located at Post Miles (PM) 26.25, 28.7, 30.1, 31.4 and 32.6. For each location, the maximum hourly flow within the peak period is selected and an average is taken for all the days that data is available. The Existing 2012 freeway mainline traffic count data sheets are provided in Appendix C. Additionally, the SR-210 Traffic Volume summary is provided in Appendix C that shows the development of the traffic volume data from Existing 2012 to Year 2020 and Year 2040 conditions. The 2012 ramp volume development methodology was conducted following the development and finalization of the existing SR-210 mainline flow along the freeway study segments. A combination of resources (including the SR-210 2008 PSR/PDS and 2008 SBTAM baseline forecast) were consulted to develop the ramp volumes along the study corridor. Since no existing ramp counts are available at the study corridor ramps, the SR-210 2008 PSR/PDS ramp and freeway flow data were utilized to establish the ramp-to-freeway volume split at each interchange. The Existing 2012 ramp volumes developed for this report were calculated based on either the SR-210 2008 PSR/PDS split or by applying flow conservation along the freeway. Truck percentages were derived from the Caltrans Traffic Data Branch 2010 database and a passenger car equivalent (PCE) factor of 1.5 was applied to trucks in the Highway Capacity Software (HCS) analysis. Since ramp truck percentage values were not available, the mainline truck percentage assumptions were similarly used in the weaving, merge and diverge analysis. Existing mainline ADT data were developed based on the existing peak hour directional volumes described above and using peak hour and ADT relationship using published Caltrans Traffic Database K and D factors table provided in Appendix C. Key steps and factors in the ADT volume development include the following: AADT = PHV/KxD
  • 15. 08-SBD-210 PM R25.0/R33.2 EA 0C700, Project No. 0812000164 SR-210 Mixed Flow Lane Addition Project 14 Traffic Operations Analysis Revised: February 2014 where K = The percentage of the AADT in both directions during the peak hour. Values in the Caltrans table are derived by dividing the measured 2-way PHV by the AADT. D = D factor. The percentage of traffic in the peak direction during the peak hour. Values in the traffic count book are derived by dividing the measured PHV by the sum of both directions of travel during the peak hour. KxD = The product of K and D. The percentage of AADT in the peak direction during the peak hour. Values in the Caltrans table are derived by dividing the measured 1-way PHV by the AADT. PHV = Peak Hour Volume in the peak direction. A one way volume in vehicles per hour (vph) as used here. The PHV is analogous to the DDHV as used for design purposes. AADT = Annual Average Daily Traffic in vehicles per day. (Derived here in this TOAR as ADT) • Identify applicable K and D factors within the study area – Existing 2011 SR-210 K & D Factor at PM 31.72 between the San Bernardino Avenue and 5th Street-Greenspot Road. These are the only available published K and D factors for the project study segments. The source table for the K and D factors are provided in Appendix C. • Apply K and D factors to the previously developed peak hour ramp volumes and compare ADT results between corresponding movements in the eastbound and westbound direction. For analysis purposes, it was conservaltively assumed that the higher calculated directional ADT was selected and applied to both directions. Theoretically, opposing directional ADT’s are anticipated to be equal by direction on a daily basis. • Using the mainline segment between San Bernardino Avenue and 5th Street-Greenspot Road as the starting point, the mainline ADT at this location was developed using the aforementioned K and D factors. The resulting mainline ADT was propagated through the study segments using the principles of flow conservation and taking into consideration the derived ramp ADTs. Existing Truck Data Based on the review of the latest 2011 and 2010 truck volume data from Caltrans Traffic Data Branch, the review indicated no usable 2011 data for the SR-210 freeway study segments within the project limits. However, the 2010 truck count data showed a combination of verified and estimated truck counts within the project limits. Additional research yielded no further information beyond those presented in the Caltrans Traffic Data Branch 2010 truck count data. Using the 2010 truck data, we have used existing and future year truck percentage of 7 percent between Highland Avenue and SR-330 and 6 percent between SR-330 and San Bernardino
  • 16. 08-SBD-210 PM R25.0/R33.2 EA 0C700, Project No. 0812000164 SR-210 Mixed Flow Lane Addition Project 15 Traffic Operations Analysis Revised: February 2014 Avenue for both mainline and ramp area analysis. The aforementioned truck percentages were similarly adopted and used in the TI Analysis. Existing Traffic Conditions Figure 2 illustrates the roadway lane geometrics for existing conditions. Figure 3 illustrates the SR-210 mainline and ramp ADT and peak hour volumes from Caltrans District 8. The existing 2012 count data are utilized as the starting point in the development of Opening Year 2020 and Horizon Year 2040 traffic forecast. HCM 2010 operational analysis was conducted for existing conditions for the SR-210 study mainline, weaving, ramp merge and diverge areas within the project study limits. Tables 4 and 5 summarize the density and level of service results of the analysis performed at the project study locations. The traffic analysis worksheets are provided in Appendix B.
  • 17. SR-210 Mixed Flow Lane Addition (PM R26.0/R33.2) - EA 0C700 K:2012SR-210 Mixed Flow Lane AdditionFigures.ai Governments SANBAG Working T ogether Governments SANBAG Working T ogether INTERSTATE CALIFORNIA 10 INTERSTATE CALIFORNIA 10 CALIFORNIA 210 CALIFORNIA 210 CALIFORNIA 330 FIFTH ST BASE LINE HIGHLAND AVE PIONEER AVE SAN BERNARDINO AVE ARDEN AVE VICTORIA AVE ALABAMA ST SANTA ANA RIVER GREENSPOT RD NOT TO SCALE Figure 2 Existing (2012) Freeway Mainline and Ramp Geometrics 3 3 3 4 2 2 2 2 2 2 3 3 2 2 LEGEND X Number of Lanes
  • 18. SR-210 Mixed Flow Lane Addition (PM R26.0/R33.2) - EA 0C700 K:2012SR-210 Mixed Flow Lane AdditionFigures.ai Governments SANBAG Working T ogether Governments SANBAG Working T ogether INTERSTATE CALIFORNIA 10 INTERSTATE CALIFORNIA 10 CALIFORNIA 210 CALIFORNIA 210 CALIFORNIA 330 FIFTH ST BASE LINE HIGHLAND AVE PIONEER AVE SAN BERNARDINO AVE ARDEN AVE VICTORIA AVE ALABAMA ST SANTA ANA RIVER GREENSPOT RD NOT TO SCALE 41,300 3,026 3,305 41,300 3,359 3,394 10,000 633 691 3,400 449 282 34,700 3,176 2,985 4,800 544 398 5,000 190 409 34,900 2,823 2,996 9,400 552 522 38,500 2,640 3,038 4,300 209 266 11,900 652 944 46,100 3,083 3,716 8,800 615 720 6,800 194 778 44,100 2,663 3,774 5,800 735 480 10,000 864 786 4,800 361 287 5,000 380 228 34,900 2,779 2,948 5,800 252 347 9,400 819 554 4,300 375 381 11,900 1,032 820 46,100 4,003 3,594 8,800 568 614 6,800 590 466 44,100 4,025 3,446 38,500 3,346 3,155 34,700 2,760 3,007 3,400 598 488 Figure 3 Existing (2012) Freeway Mainline and Ramp Volumes LEGEND XXXXX Average Daily Traffic XXXX AM Peak Hour XXXX PM Peak Hour
  • 19. 08-SBD-210 PM R25.0/R33.2 EA 0C700, Project No. 0812000164 SR-210 Mixed Flow Lane Addition Project 18 Traffic Operations Analysis Revised: February 2014 Table 4: Existing (2012) - SR-210 Eastbound Mainline and Ramp Operations LOS Freeway Mainline Segment / Ramp Connection Freeway Mainline / Ramp Connection Merge/Diverge Analyses Existing (2012) Facility Lanes AM Peak PM Peak Den. LOS Den. LOS SR-210 between Sterling Avenue and Highland Avenue-Arden Avenue Freeway 3MF 17.1 B 18.5 C SR-210 Highland Avenue Off-ramp Trap Lane 2MF/ 1L Trap N/A3 N/A3 N/A3 N/A3 SR-210 Arden Avenue On-ramp Merge 2MF/ 1L Ramp 25.1 C 27.0 C SR-210 between Highland Avenue-Arden Avenue and SR-330 Freeway 2MF 23.4 C 25.5 C SR-210 SR-330 Connector Diverge 2MF/ 1L Decel 19.8 B 21.8 C SR-210 between SR-330 and Base Line Weave 2MF/ 1 Aux 17.8 B 18.4 B SR-210 Base Line On-ramp Merge 2MF/ 1L Ramp 29.9 D 28.1 D SR-210 between Base Line and 5th Street- Greenspot Road Freeway 2MF 29.4 D 26.9 D SR-210 5th Street Off-ramp Diverge 2MF/ 1L Ramp 28.2 D 26.1 C SR-210 5th Street On-ramp Merge 2MF/ 1L Ramp 35.4 E 31.7 D SR-210 between 5th Street-Greenspot Road and San Bernardino Avenue Freeway 2MF 39.1 E 32.1 D SR-210 San Bernardino Avenue Off-ramp Diverge 3MF/ 1L Ramp 28.5 D 26.3 C SR-210 San Bernardino Avenue On-ramp Merge 4MF/ 1L Ramp 18.2 B 15.5 B SR-210 between San Bernardino Avenue and I-10 Freeway Freeway 4MF 17.0 B 14.4 B Notes: 1. “Highland Avenue-Arden Avenue” refers to SR-210 off-ramps to Highland Avenue and SR-210 on-ramps from Arden Avenue (EB) and both Arden Avenue/Highland Avenue (WB). 2. “5th Street-Greenspot Road” refers to SR-210 off/on-ramps to 5th Street (EB) and SR-210 off/on-ramps to Greenspot Road (WB). 3. Ramp junction analysis is not applicable for lane drop (trap) lane or lane addition connection to freeway.
  • 20. 08-SBD-210 PM R25.0/R33.2 EA 0C700, Project No. 0812000164 SR-210 Mixed Flow Lane Addition Project 19 Traffic Operations Analysis Revised: February 2014 Table 5: Existing (2012) - SR-210 Westbound Mainline and Ramp Operations LOS Freeway Mainline Segment / Ramp Connection Freeway Mainline / Ramp Connection Merge/Diverge Analyses Existing (2012) Facility Lanes AM Peak PM Peak Den. LOS Den. LOS SR-210 between I-10 Freeway and San Bernardino Avenue Freeway 3MF 15.0 B 21.0 C SR-210 San Bernardino Avenue Off-ramp Diverge 3MF/ 1L Ramp 20.6 C 27.5 C SR-210 San Bernardino Avenue On-ramp Merge 2MF/ 1L Ramp 27.8 C 32.8 D SR-210 between San Bernardino Avenue and 5th Street-Greenspot Road Freeway 2MF 26.5 D 33.8 D SR-210 Greenspot Road Off-ramp Diverge 2MF/ 1L Ramp 32.0 D 37.6 E SR-210 Greenspot Road On-ramp Merge 2MF/ 1L Ramp 24.2 C 27.3 C SR-210 between 5th Street-Greenspot Road and Base Line Freeway 2MF 22.3 C 25.7 C SR-210 Base Line Off-ramp Diverge 2MF/ 1L Ramp 21.5 C 24.9 C SR-210 between Base Line and SR-330 Weave 2MF/ 1 Aux 18.8 B 19.2 B SR-210 SR-330 Connector Merge 2MF/ 1L Ramp 28.8 D 26.9 C SR-210 between SR-330 and Highland Avenue-Arden Avenue Freeway 2MF 27.6 D 25.3 C SR-210 Highland Avenue Off-ramp Diverge 2MF/ 1L Ramp 33.1 D 31.0 D Notes: 1. “Highland Avenue-Arden Avenue” refers to SR-210 off-ramps to Highland Avenue and SR-210 on-ramps from Arden Avenue (EB) and both Arden Avenue/Highland Avenue (WB). 2. “5th Street-Greenspot Road” refers to SR-210 off/on-ramps to 5th Street (EB) and SR-210 off/on-ramps to Greenspot Road (WB). 3. Ramp junction analysis is not applicable for lane drop (trap) lane or lane addition connection to freeway.
  • 21. 08-SBD-210 PM R25.0/R33.2 EA 0C700, Project No. 0812000164 SR-210 Mixed Flow Lane Addition Project 20 Traffic Operations Analysis Revised: February 2014 5.0 OPENING YEAR (2020) TRAFFIC CONDITIONS The purpose of this chapter is to present and document the forecast future traffic conditions on the anticipated Opening Year (2020) of the proposed project. Opening year traffic volumes were developed for Opening Year (2020) No Build and Build conditions. Under Opening Year (2020) No Build Traffic Conditions, it was assumed that SR-210 would be geometrically identical to existing conditions and the other related SR-210 projects are assumed to be unconstructed and not implemented. Opening Year (2020) mainline and ramp traffic count data has been developed using annualized growth factors described previously in Chapter 2 of this report. During Opening year (2020) traffic conditions, volume proportion/flow conservation has been maintained during the development of future mainline traffic count data and the truck percentage values for the mainline were also assumed for ramp traffic and was used in the weaving, merge and diverge analysis. In addition, the previously discussed truck percentages and the 1.5 PCE factor for trucks had been maintained for use in the Opening Year (2020) traffic operations analysis. Opening Year (2020) - No Build Traffic Conditions Figure 4 illustrates Opening Year (2020) - No Build Freeway Mainline and Ramp Geometric configurations. Figure 5 illustrates Opening Year (2020) – No Build Freeway Mainline and Ramp ADT and peak hour traffic volumes. An operational analysis was conducted for the SR-210 mainline, ramp merge and diverge areas within the project study area and the results are summarized in Table 6 for the eastbound SR- 210 direction and in Table 7 for the westbound SR-210 direction.
  • 22. SR-210 Mixed Flow Lane Addition (PM R26.0/R33.2) - EA 0C700 K:2012SR-210 Mixed Flow Lane AdditionFigures.ai Governments SANBAG Working T ogether Governments SANBAG Working T ogether INTERSTATE CALIFORNIA 10 INTERSTATE CALIFORNIA 10 CALIFORNIA 210 CALIFORNIA 210 CALIFORNIA 330 FIFTH ST BASE LINE HIGHLAND AVE PIONEER AVE SAN BERNARDINO AVE ARDEN AVE VICTORIA AVE ALABAMA ST SANTA ANA RIVER GREENSPOT RD NOT TO SCALE Figure 4 Opening Year (2020) No Build Freeway Mainline and Ramps Geometrics 3 3 3 4 2 2 2 2 3 3 2 2 2 2 LEGEND X Number of Lanes
  • 23. SR-210 Mixed Flow Lane Addition (PM R26.0/R33.2) - EA 0C700 K:2012SR-210 Mixed Flow Lane AdditionFigures.ai Governments SANBAG Working T ogether Governments SANBAG Working T ogether INTERSTATE CALIFORNIA 10 INTERSTATE CALIFORNIA 10 CALIFORNIA 210 CALIFORNIA 210 CALIFORNIA 330 FIFTH ST BASE LINE HIGHLAND AVE PIONEER AVE SAN BERNARDINO AVE ARDEN AVE VICTORIA AVE ALABAMA ST SANTA ANA RIVER GREENSPOT RD NOT TO SCALE 47,900 3,600 3,840 47,900 3,870 4,020 12,600 810 1,000 4,400 520 360 39,700 3,580 3,380 5,500 580 450 5,200 200 430 39,400 3,200 3,360 9,800 560 530 42,000 2,980 3,300 4,700 210 280 12,200 670 970 49,500 3,440 3,990 9,600 700 790 7,800 260 870 47,700 3,000 4,070 7,200 780 590 12,600 1,090 1,020 5,500 400 340 5,200 440 240 39,400 3,190 3,270 7,200 390 370 9,800 850 570 4,700 410 470 12,200 1,060 860 49,500 4,300 3,860 9,600 610 650 7,800 680 530 47,700 4,370 3,740 42,000 3,650 3,470 39,700 3,150 3,370 4,400 640 550 Figure 5 Opening Year (2020) No Build Freeway Mainline and Ramp Volumes LEGEND XXXXX Average Daily Traffic XXXX AM Peak Hour XXXX PM Peak Hour
  • 24. 08-SBD-210 PM R25.0/R33.2 EA 0C700, Project No. 0812000164 SR-210 Mixed Flow Lane Addition Project 23 Traffic Operations Analysis Revised: February 2014 Table 6: Opening Year (2020) SR-210 - No Build Eastbound Mainline and Ramp Operations LOS Freeway Mainline Segment / Ramp Connection Freeway Mainline / Ramp Connection Merge/Diverge Analyses Opening Year (2020) Facility Lanes AM Peak PM Peak Den. LOS Den. LOS SR-210 between Sterling Avenue and Highland Avenue-Arden Avenue Freeway 3MF 20.3 C 21.5 C SR-210 Highland Avenue Off-ramp Trap Lane 2MF/ 1L Trap N/A3 N/A3 N/A3 N/A3 SR-210 Arden Avenue On-ramp Merge 2MF/ 1L Ramp 28.4 D 30.1 D SR-210 between Highland Avenue-Arden Avenue and SR-330 Freeway 2MF 27.3 D 29.5 D SR-210 SR-330 Connector Diverge 2MF/ 1L Decel 23.5 C 25.2 C SR-210 between SR-330 and Base Line Weave 2MF/ 1 Aux 20.7 C 20.6 C SR-210 Base Line On-ramp Merge 2MF/ 1L Ramp 32.5 D 30.8 D SR-210 between Base Line and 5th Street- Greenspot Road Freeway 2MF 33.4 D 30.5 D SR-210 5th Street Off-ramp Diverge 2MF/ 1L Ramp 31.1 D 29.0 D SR-210 5th Street On-ramp Merge 2MF/ 1L Ramp --* F 33.9 D SR-210 between 5th Street-Greenspot Road and San Bernardino Avenue Freeway 2MF 45.3 F 36.0 E SR-210 San Bernardino Avenue Off-ramp Diverge 3MF/ 1L Ramp 30.0 D 27.7 C SR-210 San Bernardino Avenue On-ramp Merge 4MF/ 1L Ramp 19.8 B 16.8 B SR-210 between San Bernardino Avenue and I-10 Freeway Freeway 4MF 18.4 C 15.6 B Notes: --* = Demand exceeds capacity. 1. “Highland Avenue-Arden Avenue” refers to SR-210 off-ramps to Highland Avenue and SR-210 on-ramps from Arden Avenue (EB) and both Arden Avenue/Highland Avenue (WB). 2. “5th Street-Greenspot Road” refers to SR-210 off/on-ramps to 5th Street (EB) and SR-210 off/on-ramps to Greenspot Road (WB). 3. Ramp junction analysis is not applicable for lane drop (trap) lane or lane addition connection to freeway.
  • 25. 08-SBD-210 PM R25.0/R33.2 EA 0C700, Project No. 0812000164 SR-210 Mixed Flow Lane Addition Project 24 Traffic Operations Analysis Revised: February 2014 Table 7: Opening Year (2020) SR-210 - No Build Westbound Mainline and Ramp Operations LOS Freeway Mainline Segment / Ramp Connection Freeway Mainline / Ramp Connection Merge/Diverge Analyses Opening Year (2020) Facility Lanes AM Peak PM Peak Den. LOS Den. LOS SR-210 between I-10 Freeway and San Bernardino Avenue Freeway 3MF 16.9 B 22.7 C SR-210 San Bernardino Avenue Off-ramp Diverge 3MF/ 1L Ramp 22.6 C 29.2 D SR-210 San Bernardino Avenue On-ramp Merge 2MF/ 1L Ramp 30.8 D 35.1 E SR-210 between San Bernardino Avenue and 5th Street-Greenspot Road Freeway 2MF 30.6 D 38.1 E SR-210 Greenspot Road Off-ramp Diverge 2MF/ 1L Ramp 35.4 E 40.2 E SR-210 Greenspot Road On-ramp Merge 2MF/ 1L Ramp 27.1 C 29.5 D SR-210 between 5th Street-Greenspot Road and Base Line Freeway 2MF 25.4 C 28.5 D SR-210 Base Line Off-ramp Diverge 2MF/ 1L Ramp 24.7 C 27.4 C SR-210 between Base Line and SR-330 Weave 2MF/ 1 Aux 21.7 C 22.0 C SR-210 SR-330 Connector Merge 2MF/ 1L Ramp 32.2 D 30.2 D SR-210 between SR-330 and Highland Avenue-Arden Avenue Freeway 2MF 32.6 D 29.6 D SR-210 Highland Avenue Off-ramp Diverge 2MF/ 1L Ramp 36.9 E 34.6 D Notes: 1. “Highland Avenue-Arden Avenue” refers to SR-210 off-ramps to Highland Avenue and SR-210 on-ramps from Arden Avenue (EB) and both Arden Avenue/Highland Avenue (WB). 2. “5th Street-Greenspot Road” refers to SR-210 off/on-ramps to 5th Street (EB) and SR-210 off/on-ramps to Greenspot Road (WB). 3. Ramp junction analysis is not applicable for lane drop (trap) lane or lane addition connection to freeway.
  • 26. 08-SBD-210 PM R25.0/R33.2 EA 0C700, Project No. 0812000164 SR-210 Mixed Flow Lane Addition Project 25 Traffic Operations Analysis Revised: February 2014 Opening Year 2020 - Build Traffic Conditions Figure 6 illustrates Opening Year (2020) – Build Freeway Mainline and Ramp Geometric configurations. Figure 7 illustrates Opening Year (2020) – Build Freeway Mainline and Ramp ADT and peak hour traffic volumes. Similar to Opening Year (2020) – No Build conditions, an operational analysis was conducted for Build Conditions of the SR-210 mainline, ramp merge and diverge areas within the project study area and the results are summarized in Table 8 for the eastbound SR-210 direction and in Table 9 for the westbound SR-210 direction.
  • 27. SR-210 Mixed Flow Lane Addition (PM R26.0/R33.2) - EA 0C700 K:2012SR-210 Mixed Flow Lane AdditionFigures.ai Governments SANBAG Working T ogether Governments SANBAG Working T ogether INTERSTATE CALIFORNIA 10 INTERSTATE CALIFORNIA 10 CALIFORNIA 210 CALIFORNIA 210 CALIFORNIA 330 FIFTH ST BASE LINE HIGHLAND AVE PIONEER AVE SAN BERNARDINO AVE ARDEN AVE VICTORIA AVE ALABAMA ST SANTA ANA RIVER GREENSPOT RD NOT TO SCALE Figure 6 Opening Year (2020) Build Freeway Mainline and Ramp Geometrics 3 3 3 4 3 3 3 3 3 3 4 4 4 4 LEGEND X Number of Lanes
  • 28. SR-210 Mixed Flow Lane Addition (PM R26.0/R33.2) - EA 0C700 K:2012SR-210 Mixed Flow Lane AdditionFigures.ai Governments SANBAG Working T ogether Governments SANBAG Working T ogether INTERSTATE CALIFORNIA 10 INTERSTATE CALIFORNIA 10 CALIFORNIA 210 CALIFORNIA 210 CALIFORNIA 330 FIFTH ST BASE LINE HIGHLAND AVE PIONEER AVE SAN BERNARDINO AVE ARDEN AVE VICTORIA AVE ALABAMA ST SANTA ANA RIVER GREENSPOT RD NOT TO SCALE 49,200 3,830 4,230 47,700 4,250 4,570 13,200 740 690 5,600 560 460 41,600 4,070 4,340 6,600 610 540 5,500 210 450 40,500 3,670 4,250 10,400 580 630 44,900 3,460 4,390 5,500 270 450 14,200 760 1,170 53,600 3,950 5,110 13,300 800 1,090 7,800 270 870 48,100 3,420 4,890 6,000 790 490 13,200 1,150 1,160 6,600 410 390 5,500 440 320 40,500 3,400 3,730 6,000 340 510 10,400 900 630 5,500 430 560 14,200 1,120 930 53,600 4,650 4,220 13,300 650 680 7,800 680 480 48,100 4,680 4,020 44,900 3,960 3,850 41,600 3,370 3,800 5,600 690 730 Figure 7 Opening Year (2020) Build Freeway Mainline and Ramp Volumes LEGEND XXXXX Average Daily Traffic XXXX AM Peak Hour XXXX PM Peak Hour
  • 29. 08-SBD-210 PM R25.0/R33.2 EA 0C700, Project No. 0812000164 SR-210 Mixed Flow Lane Addition Project 28 Traffic Operations Analysis Revised: February 2014 Table 8: Opening Year (2020) SR-210 - Build Eastbound Mainline and Ramp Operations LOS Freeway Mainline Segment / Ramp Connection Freeway Mainline / Ramp Connection Merge/Diverge Analyses Opening Year (2020) Facility Lanes AM Peak PM Peak Den. LOS Den. LOS SR-210 between Sterling Avenue and Highland Avenue-Arden Avenue Freeway 3MF 21.6 C 23.7 C SR-210 Highland Avenue Off-ramp Diverge 3MF/ 2L Ramp 19.4 B 20.9 C SR-210 Arden Avenue On-ramp Merge 3MF/ 1L Ramp 21.0 C 23.1 C SR-210 between Highland Avenue-Arden Avenue and SR-330 Freeway 3MF 19.0 C 21.2 C SR-210 SR-330 Connector Diverge 3MF/ 1L Decel 15.7 B 17.7 B SR-210 between SR-330 and Base Line Weave 3MF/ 1 Aux 16.3 B 17.6 B SR-210 Base Line On-ramp Merge 3MF/ 1 Aux N/A4 N/A4 N/A4 N/A4 SR-210 between Base Line and 5th Street- Greenspot Road Weave 3MF/ 1 Aux 21.3 C 20.1 C SR-210 5th Street Off-ramp Diverge 3MF/ 1 Aux N/A4 N/A4 N/A4 N/A4 SR-210 5th Street On-ramp Merge 3MF/ 1L Accel 28.7 D 25.6 C SR-210 between 5th Street-Greenspot Road and San Bernardino Avenue Freeway 3MF 26.6 D 23.5 C SR-210 San Bernardino Avenue Off-ramp Diverge 3MF/ 1L Ramp 31.7 D 29.5 D SR-210 San Bernardino Avenue On-ramp Merge 4MF/ 1L Ramp 20.9 C 17.5 B SR-210 between San Bernardino Avenue and I-10 Freeway Freeway 4MF 19.7 C 16.8 B Notes: 1. “Highland Avenue-Arden Avenue” refers to SR-210 off-ramps to Highland Avenue and SR-210 on-ramps from Arden Avenue (EB) and both Arden Avenue/Highland Avenue (WB). 2. “5th Street-Greenspot Road” refers to SR-210 off/on-ramps to 5th Street (EB) and SR-210 off/on-ramps to Greenspot Road (WB). 3. Ramp junction analysis is not applicable for lane drop (trap) lane or lane addition connection to freeway. 4. Ramp junction analysis is not applicable for ramp connections in weave segments.
  • 30. 08-SBD-210 PM R25.0/R33.2 EA 0C700, Project No. 0812000164 SR-210 Mixed Flow Lane Addition Project 29 Traffic Operations Analysis Revised: February 2014 Table 9: Opening Year (2020) SR-210 – Build Westbound Mainline and Ramp Operations LOS Freeway Mainline Segment / Ramp Connection Freeway Mainline / Ramp Connection Merge/Diverge Analyses Opening Year (2020) Facility Lanes AM Peak PM Peak Den. LOS Den. LOS SR-210 between I-10 Freeway and San Bernardino Avenue Freeway 3MF 19.2 C 28.0 D SR-210 San Bernardino Avenue Off-ramp Diverge 3MF/ 1L Ramp 24.9. C 33.0 D SR-210 San Bernardino Avenue On-ramp Merge 3MF/ 1L Ramp 24.2 C 30.6 D SR-210 between San Bernardino Avenue and 5th Street-Greenspot Road Freeway 3MF 22.2 C 29.7 D SR-210 Greenspot Road Off-ramp Diverge 3MF/ 1L Ramp 28.6 D 34.6 D SR-210 Greenspot Road On-ramp Merge 3MF/ 1 Aux N/A4 N/A4 N/A4 N/A4 SR-210 between 5th Street-Greenspot Road and Base Line Weave 3MF/ 1 Aux 17.5 B 23.0 C SR-210 Base Line Off-ramp Diverge 3MF/ 1 Aux N/A4 N/A4 N/A4 N/A4 SR-210 between Base Line and SR-330 Weave 3MF/ 1 Aux 18.5 B 20.6 C SR-210 SR-330 Connector Merge 3MF/ 1L Ramp 24.4 C 25.3 C SR-210 between SR-330 and Highland Avenue-Arden Avenue Freeway 3MF 23.0 C 24.4 C SR-210 Highland Avenue Off-ramp Diverge 3MF/ 1L Ramp 28.7 D 29.8 D Notes: 1. “Highland Avenue-Arden Avenue” refers to SR-210 off-ramps to Highland Avenue and SR-210 on-ramps from Arden Avenue (EB) and both Arden Avenue/Highland Avenue (WB). 2. “5th Street-Greenspot Road” refers to SR-210 off/on-ramps to 5th Street (EB) and SR-210 off/on-ramps to Greenspot Road (WB). 3. Ramp junction analysis is not applicable for lane drop (trap) lane or lane addition connection to freeway. 4. Ramp junction analysis is not applicable for ramp connections in weave segments.
  • 31. 08-SBD-210 PM R25.0/R33.2 EA 0C700, Project No. 0812000164 SR-210 Mixed Flow Lane Addition Project 30 Traffic Operations Analysis Revised: February 2014 6.0 HORIZON YEAR (2040) TRAFFIC CONDITIONS The purpose of this chapter is to present and document the forecast future traffic conditions on the anticipated Horizon Year (2040) of the proposed project. Future year traffic volumes were developed for the Horizon Year (2040) No Build and Build conditions. As part of the Horizon Year (2040) conditions, the proposed SR-210/Victoria Avenue Interchange could be potentially in-place by year 2040. However, since the proposed Victoria Avenue Interchange is currently under study and refinement, analysis of the interchange is not included due to the lack of finalized geometric configuration assumptions for the interchange itself and the adjacent interchange ramp systems. A Project Study Report/Project Development Support (PSR/PDS) for the SR-210/Victoria Avenue Interchange was approved by Caltrans on April 8, 2011 to evaluate the feasibility of constructing a new interchange within the city limits of Highland and San Bernardino on SR-210 at Victoria Avenue. The purpose of the new interchange would be to improve access to business and entertainment facilities in the Victoria Avenue corridor, such as the San Bernardino International Airport (SBIA) and the San Manuel Band of Mission Indians establishments. Consistent with the previous analysis scenario assumptions, Horizon Year (2040) mainline and ramp traffic count data were developed using annualized growth factors described previously in Chapter 2 of this report. During Horizon Year (2040) traffic conditions, volume proportion/flow conservation had been maintained in the development of future mainline traffic volume. The truck percentage value for mainline were similarly assumed for ramp traffic and was used in the weaving, merge and diverge analysis. The PCE factor of 1.5 had been similarly maintained for use in the Horizon Year (2040) traffic operations analysis. The following analysis provides the evaluation of 2040 No Build and Build project conditions. Horizon Year (2040) - No Build Traffic Conditions Figure 8 illustrates Horizon Year (2040) – No Build Freeway Mainline and Ramp Geometric configurations. Figure 9 illustrates Horizon Year (2040) – No Build Freeway Mainline and Ramp ADT and peak hour traffic volumes. An operational analysis was conducted for the SR-210 mainline, ramp merge and diverge areas within the project study area and the results are summarized in Table 10 for the eastbound SR- 210 direction and in Table 11 for the westbound SR-210 direction.
  • 32. SR-210 Mixed Flow Lane Addition (PM R26.0/R33.2) - EA 0C700 K:2012SR-210 Mixed Flow Lane AdditionFigures.ai Governments SANBAG Working T ogether Governments SANBAG Working T ogether INTERSTATE CALIFORNIA 10 INTERSTATE CALIFORNIA 10 CALIFORNIA 210 CALIFORNIA 210 CALIFORNIA 330 FIFTH ST BASE LINE HIGHLAND AVE PIONEER AVE SAN BERNARDINO AVE ARDEN AVE VICTORIA AVE ALABAMA ST SANTA ANA RIVER GREENSPOT RD NOT TO SCALE Figure 8 Horizon Year (2040) No Build Freeway Mainline and Ramp Geometrics 3 3 3 2 2 2 2 2 2 2 2 3 3 2 2 4 LEGEND X Number of Lanes
  • 33. SR-210 Mixed Flow Lane Addition (PM R26.0/R33.2) - EA 0C700 K:2012SR-210 Mixed Flow Lane AdditionFigures.ai Governments SANBAG Working T ogether Governments SANBAG Working T ogether INTERSTATE CALIFORNIA 10 INTERSTATE CALIFORNIA 10 CALIFORNIA 210 CALIFORNIA 210 CALIFORNIA 330 FIFTH ST BASE LINE HIGHLAND AVE PIONEER AVE SAN BERNARDINO AVE ARDEN AVE VICTORIA AVE ALABAMA ST SANTA ANA RIVER GREENSPOT RD NOT TO SCALE 60,300 5,040 5,190 60,300 5,150 5,500 13,400 700 1,100 4,600 390 380 51,500 4,600 4,290 2,600 310 190 8,300 550 680 57,200 4,840 4,780 7,200 660 590 6,700 240 490 51,000 4,180 4,190 10,800 600 570 51,500 3,880 3,910 5,600 220 300 13,100 710 1,050 59,000 4,370 4,660 11,800 930 970 10,600 410 1,110 57,800 3,850 4,800 10,300 900 850 13,400 960 850 7,200 480 460 6,700 580 280 51,000 4,270 4,110 10,300 740 440 10,800 940 600 5,600 490 680 13,100 1,140 970 59,000 5,120 4,560 11,800 710 740 10,600 920 710 57,800 5,330 4,530 51,500 4,470 4,270 51,500 4,170 4,290 4,600 540 400 57,200 4,620 4,740 8,300 680 750 2,600 230 300 Figure 9 Horizon Year (2040) No Build Freeway Mainline and Ramp Volumes LEGEND XXXXX Average Daily Traffic XXXX AM Peak Hour XXXX PM Peak Hour
  • 34. 08-SBD-210 PM R25.0/R33.2 EA 0C700, Project No. 0812000164 SR-210 Mixed Flow Lane Addition Project 33 Traffic Operations Analysis Revised: February 2014 Table 10: Horizon Year (2040) SR-210 – No Build Eastbound Mainline and Ramp Operations LOS Freeway Mainline Segment / Ramp Connection Freeway Mainline / Ramp Connection Merge/Diverge Analyses Horizon Year (2040) Facility Lanes AM Peak PM Peak Den. LOS Den. LOS SR-210 between Sterling Avenue and Highland Avenue-Arden Avenue Freeway 3MF 29.8 D 30.6 D SR-210 Highland Avenue Off-ramp Trap Lane 2MF/ 1L Trap N/A 3 N/A 3 N/A 3 N/A 3 SR-210 Arden Avenue On-ramp Merge 2MF/ 1L Ramp --* F --* F SR-210 between Highland Avenue-Arden Avenue and Victoria Avenue Freeway 2MF 54.7 F 57.1 F SR-210 between Victoria Avenue and SR-330 Freeway 2MF 42.8 E 44.5 E SR-210 SR-330 Connector Diverge 2MF/ 1L Decel 33.1 D 33.8 D SR-210 between SR-330 and Base Line Weave 2MF/ 1 Aux 29.0 D 26.6 C SR-210 Base Line On-ramp Merge 2MF/ 1L Ramp --* F 37.5 E SR-210 between Base Line and 5th Street- Greenspot Road Freeway 2MF 49.6 F 43.6 E SR-210 5th Street Off-ramp Diverge 2MF/ 1L Ramp --* F 36.5 E SR-210 5th Street On-ramp Merge 2MF/ 1L Ramp --* F --* F SR-210 between 5th Street-Greenspot Road and San Bernardino Avenue Freeway 2MF 75.8 F 50.8 F SR-210 San Bernardino Avenue Off-ramp Diverge 3MF/ 1L Ramp 33.9 D 31.2 D SR-210 San Bernardino Avenue On-ramp Merge 4MF/ 1L Ramp 24.2 C 20.3 C SR-210 between San Bernardino Avenue and I-10 Freeway Freeway 4MF 22.5 C 18.9 C Notes: --* = Demand exceeds capacity. 1. “Highland Avenue-Arden Avenue” refers to SR-210 off-ramps to Highland Avenue and SR-210 on-ramps from Arden Avenue (EB) and both Arden Avenue/Highland Avenue (WB). 2. “5th Street-Greenspot Road” refers to SR-210 off/on-ramps to 5th Street (EB) and SR-210 off/on-ramps to Greenspot Road (WB). 3. Ramp junction analysis is not applicable for lane drop (trap) lane or lane addition connection to freeway. 4. Ramp junction analysis is not applicable for ramp connections in weave segments.
  • 35. 08-SBD-210 PM R25.0/R33.2 EA 0C700, Project No. 0812000164 SR-210 Mixed Flow Lane Addition Project 34 Traffic Operations Analysis Revised: February 2014 Table 11: Horizon Year (2040) SR-210 – No Build Westbound Mainline and Ramp Operations LOS Freeway Mainline Segment / Ramp Connection Freeway Mainline / Ramp Connection Merge/Diverge Analyses Horizon Year (2040) Facility Lanes AM Peak PM Peak Den. LOS Den. LOS SR-210 between I-10 Freeway and San Bernardino Avenue Freeway 3MF 21.6 C 27.4 D SR-210 San Bernardino Avenue Off-ramp Diverge 3MF/ 1L Ramp 27.4 C 33.1 D SR-210 San Bernardino Avenue On-ramp Merge 2MF/ 1L Ramp --* F --* F SR-210 between San Bernardino Avenue and 5th Street-Greenspot Road Freeway 2MF 47.0 F 53.7 F SR-210 Greenspot Road Off-ramp Diverge 2MF/ 1L Ramp --* F --* F SR-210 Greenspot Road On-ramp Merge 2MF/ 1L Ramp 34.8 D 34.6 D SR-210 between 5th Street-Greenspot Road and Base Line Freeway 2MF 36.9 E 36.8 E SR-210 Base Line Off-ramp Diverge 2MF/ 1L Ramp 33.2 D 33.1 D SR-210 between Base Line and SR-330 Weave 2MF/ 1 Aux 29.6 D 28.9 D SR-210 SR-330 Connector Merge 2MF/ 1L Ramp --* F 37.9 E SR-210 between SR-330 and Victoria Avenue Freeway 2MF 54.1 F 44.5 E SR-210 between Victoria Avenue and Highland Avenue-Arden Avenue Freeway 2MF 63.0 F 58.6 F SR-210 Highland Avenue Off-ramp Diverge 2MF/ 1L Ramp --* F --* F Notes: --* = Demand exceeds capacity. 1. “Highland Avenue-Arden Avenue” refers to SR-210 off-ramps to Highland Avenue and SR-210 on-ramps from Arden Avenue (EB) and both Arden Avenue/Highland Avenue (WB). 2. “5th Street-Greenspot Road” refers to SR-210 off/on-ramps to 5th Street (EB) and SR-210 off/on-ramps to Greenspot Road (WB). 3. Ramp junction analysis is not applicable for lane drop (trap) lane or lane addition connection to freeway. 4. Ramp junction analysis is not applicable for ramp connections in weave segments.
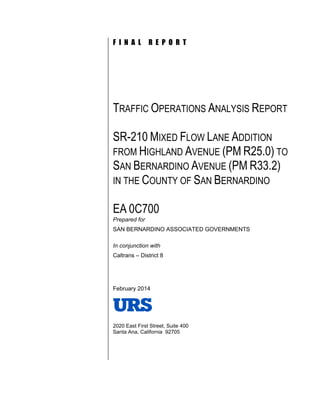
  • 36. 08-SBD-210 PM R25.0/R33.2 EA 0C700, Project No. 0812000164 SR-210 Mixed Flow Lane Addition Project 35 Traffic Operations Analysis Revised: February 2014 Horizon Year (2040) - Build Traffic Conditions Figure 10 illustrates Horizon Year (2040) – Build Freeway Mainline and Ramp Geometric configurations. Figure 11 illustrates Horizon Year (2040) – Build Freeway Mainline and Ramp ADT and peak hour traffic volumes. Similar to Horizon Year (2040) – No Build conditions, an operational analysis was conducted for Build Conditions of the SR-210 mainline, ramp merge and diverge areas within the project study area and the results are summarized in Table 12 for the eastbound SR-210 direction and in Table 13 for the westbound SR-210 direction.
  • 37. SR-210 Mixed Flow Lane Addition (PM R26.0/R33.2) - EA 0C700 K:2012SR-210 Mixed Flow Lane AdditionFigures.ai Governments SANBAG Working T ogether Governments SANBAG Working T ogether INTERSTATE CALIFORNIA 10 INTERSTATE CALIFORNIA 10 CALIFORNIA 210 CALIFORNIA 210 CALIFORNIA 330 FIFTH ST BASE LINE HIGHLAND AVE PIONEER AVE SAN BERNARDINO AVE ARDEN AVE VICTORIA AVE ALABAMA ST SANTA ANA RIVER GREENSPOT RD NOT TO SCALE Figure 10 Horizon Year (2040) Build Freeway Mainline and Ramp Geometrics 3 3 3 3 3 3 3 3 3 3 3 4 4 4 4 4 LEGEND X Number of Lanes
  • 38. SR-210 Mixed Flow Lane Addition (PM R26.0/R33.2) - EA 0C700 K:2012SR-210 Mixed Flow Lane AdditionFigures.ai Governments SANBAG Working T ogether Governments SANBAG Working T ogether INTERSTATE CALIFORNIA 10 INTERSTATE CALIFORNIA 10 CALIFORNIA 210 CALIFORNIA 210 CALIFORNIA 330 FIFTH ST BASE LINE HIGHLAND AVE PIONEER AVE SAN BERNARDINO AVE ARDEN AVE VICTORIA AVE ALABAMA ST SANTA ANA RIVER GREENSPOT RD NOT TO SCALE 59,200 5,270 5,580 59,200 5,530 6,050 10,300 460 710 4,100 310 340 53,000 5,090 5,250 58,300 5,380 5,680 8,300 690 680 6,700 250 510 51,400 4,650 5,080 11,400 620 670 53,700 4,360 5,000 5,900 280 470 15,200 800 1,250 63,000 4,880 5,780 15,500 1,030 1,270 10,600 420 1,110 58,100 4,270 5,620 9,100 910 750 10,300 890 740 8,300 490 510 6,700 580 360 51,400 4,480 4,570 9,100 690 580 11,400 990 660 5,900 510 770 15,200 1,200 1,040 63,000 5,470 4,920 15,500 750 770 10,600 920 660 58,100 5,640 4,810 53,700 4,780 4,650 53,000 4,390 4,720 4,100 550 390 58,300 4,930 5,230 Figure 11 Horizon Year (2040) Build Freeway Mainline and Ramp Volumes LEGEND XXXXX Average Daily Traffic XXXX AM Peak Hour XXXX PM Peak Hour 4,000 430 330 9,300 720 760 9,300 810 1,000 4,000 270 490
  • 39. 08-SBD-210 PM R25.0/R33.2 EA 0C700, Project No. 0812000164 SR-210 Mixed Flow Lane Addition Project 38 Traffic Operations Analysis Revised: February 2014 Table 12: Horizon Year (2040) SR-210 – Build Eastbound Mainline and Ramp Operations LOS Freeway Mainline Segment / Ramp Connection Freeway Mainline / Ramp Connection Merge/Diverge Analyses Horizon Year (2040) Facility Lanes AM Peak PM Peak Den. LOS Den. LOS SR-210 between Sterling Avenue and Highland Avenue-Arden Avenue Freeway 3MF 31.7 D 34.1 D SR-210 Highland Avenue Off-ramp Diverge 3MF/ 2L Ramp 25.6 C 26.9 C SR-210 Arden Avenue On-ramp Merge 3MF/ 1L Ramp 28.5 D 29.3 D SR-210 between Highland Avenue-Arden Avenue and Victoria Avenue Freeway 3MF 28.9 D 30.9 D SR-210 between Victoria Avenue and SR-330 Freeway 3MF 25.0 C 27.0 D SR-210 SR-330 Connector Diverge 3MF/ 1L Decel 21.0 C 22.3 C SR-210 between SR-330 and Base Line Weave 3MF/ 1 Aux 22.3 C 22.0 C SR-210 Base Line On-ramp Merge 3MF/ 1 Aux N/A 4 N/A 4 N/A 4 N/A 4 SR-210 between Base Line and 5th Street-Greenspot Road Weave 3MF/ 1 Aux 26.8 C 25.5 C SR-210 5th Street Off-ramp Diverge 3MF/ 1 Aux N/A 4 N/A 4 N/A 4 N/A 4 SR-210 5th Street On-ramp Merge 3MF/ 1L Accel 33.1 D 29.5 D SR-210 between 5th Street-Greenspot Road and San Bernardino Avenue Freeway 3MF 33.3 D 28.2 D SR-210 San Bernardino Avenue Off-ramp Diverge 3MF/ 1L Ramp 35.5 E 32.9 D SR-210 San Bernardino Avenue On-ramp Merge 4MF/ 1L Ramp 25.2 C 21.0 C SR-210 between San Bernardino Avenue and I-10 Freeway Freeway 4MF 23.9 C 20.1 C Notes: 1. “Highland Avenue-Arden Avenue” refers to SR-210 off-ramps to Highland Avenue and SR-210 on-ramps from Arden Avenue (EB) and both Arden Avenue/Highland Avenue (WB). 2. “5th Street-Greenspot Road” refers to SR-210 off/on-ramps to 5th Street (EB) and SR-210 off/on-ramps to Greenspot Road (WB). 3. Ramp junction analysis is not applicable for lane drop (trap) lane or lane addition connection to freeway. 4. Ramp junction analysis is not applicable for ramp connections in weave segments.
  • 40. 08-SBD-210 PM R25.0/R33.2 EA 0C700, Project No. 0812000164 SR-210 Mixed Flow Lane Addition Project 39 Traffic Operations Analysis Revised: February 2014 Table 13: Horizon Year (2040) SR-210 – Build Westbound Mainline and Ramp Operations LOS Freeway Mainline Segment / Ramp Connection Freeway Mainline / Ramp Connection Merge/Diverge Analyses Horizon Year (2040) Facility Lanes AM Peak PM Peak Den. LOS Den. LOS SR-210 between I-10 Freeway and San Bernardino Avenue Freeway 3MF 24.1 C 34.2 D SR-210 San Bernardino Avenue Off-ramp Diverge 3MF/ 1L Ramp 29.5 D 36.6 E SR-210 San Bernardino Avenue On-ramp Merge 3MF/ 1L Ramp 29.6 D 34.1 D SR-210 between San Bernardino Avenue and 5th Street-Greenspot Road Freeway 3MF 28.3 D 35.8 E SR-210 Greenspot Road Off-ramp Diverge 3MF/ 1L Ramp 33.0 D 37.5 E SR-210 Greenspot Road On-ramp Merge 3MF/ 1 Aux N/A4 N/A4 N/A4 N/A4 SR-210 between 5th Street-Greenspot Road and Base Line Weave 3MF/ 1 Aux 22.7 C 26.8 C SR-210 Base Line Off-ramp Diverge 3MF/ 1 Aux N/A4 N/A4 N/A4 N/A4 SR-210 between Base Line and SR-330 Weave 3MF/ 1 Aux 24.3 C 25.9 C SR-210 SR-330 Connector Merge 3MF/ 1L Ramp 29.9 D 30.3 D SR-210 between SR-330 and Victoria Avenue Freeway 3MF 30.2 D 31.1 D SR-210 between Victoria Avenue and Highland Avenue-Arden Avenue Freeway 3MF 32.7 D 35.1 E SR-210 Highland Avenue Off-ramp Diverge 3MF/ 1L Ramp 34.5 D 35.6 E Notes: 1. “Highland Avenue-Arden Avenue” refers to SR-210 off-ramps to Highland Avenue and SR-210 on-ramps from Arden Avenue (EB) and both Arden Avenue/Highland Avenue (WB). 2. “5th Street-Greenspot Road” refers to SR-210 off/on-ramps to 5th Street (EB) and SR-210 off/on-ramps to Greenspot Road (WB). 3. Ramp junction analysis is not applicable for lane drop (trap) lane or lane addition connection to freeway. 4. Ramp junction analysis is not applicable for ramp connections in weave segments.
  • 41. 08-SBD-210 PM R25.0/R33.2 EA 0C700, Project No. 0812000164 SR-210 Mixed Flow Lane Addition Project 40 Traffic Operations Analysis Revised: February 2014 7.0 SUMMARY AND CONCLUSION This chapter provides a summary of the results of the operational analyses performed for the proposed project. Existing (2012), Opening Year (2020) and Horizon Year (2040) results are discussed in the following sections. Existing (2012) Traffic Conditions The existing mainline SR-210 freeway is generally operating at acceptable levels of service (LOS D or better) based upon 2012 traffic volumes. The areas of heaviest congestion occur between Fifth Street-Greenspot Road and San Bernardino Avenue. One freeway segment is operating at LOS E during the morning peak hour (EB from Fifth Street-Greenspot Road to San Bernardino Avenue) and two ramp junctions are operating at LOS E (EB Fifth Street on-ramp in the morning peak hour and WB Greenspot Road off-ramp in the evening peak hour). The short weaving segment between SR-330 and Base Line is operating at LOS B in both directions during both the morning and evening peak hours. The existing freeway segments approaching the I-10 freeway junction are operating at good levels of service (LOS B and LOS C). Opening Year (2020) Traffic Conditions The SR-210 mainline freeway will operate at LOS D or better in all segments and at all ramp junctions under opening year with project conditions. The weaving segment between SR-330 and Base Line will operate acceptably as well (LOS B and LOS C) in 2020 in both directions during morning and evening peak hours. The auxiliary lanes proposed between Base Line and Fifth Street-Greenspot Road will provide this segment of freeway with good levels of service in both directions (LOS B and LOS C) in the opening year. The freeway segments between San Bernardino Avenue and I-10 degrade slightly from existing conditions, but still maintain adequate levels of service of B, C and D in the morning and evening peak hours. If the proposed project was not constructed by 2020, the operational conditions are anticipated to be generally one level of service worse on each freeway segment and at each freeway ramp junction when compared to the build condition. Several segments are forecast to reach LOS E and LOS F conditions without the proposed improvements, particularly the areas between Fifth Street-Greenspot Road and San Bernardino Avenue. Horizon Year (2040) Traffic Conditions In the Horizon Year (2040), nearly all mainline freeway segments on SR-210 within the project limits will operate at LOS D or better after implementation of the proposed project improvements. Only one segment (westbound SR-210 from San Bernardino Avenue to Fifth Street-Greenspot Road) will operate at LOS E in the evening peak hour. In the No Build condition this segment would operate a LOS F in both the morning and evening peak hours. Because the density and level of service of this freeway segment only slightly exceeds the criteria for LOS D, the proposed improvements meet the project’s Purpose and Need and implementation of the future HOV lane addition project will improve this segment to an acceptable level. The weaving segments between SR-330 and Base Line and between Base Line and Fifth-Street-Greenspot Road will all operate at LOS C in both directions in both morning and evening peak hour periods. The SR-210 freeway segment approaching the I-10 freeway junction will operate at LOS C in both morning and evening peak periods and the SR-
  • 42. 08-SBD-210 PM R25.0/R33.2 EA 0C700, Project No. 0812000164 SR-210 Mixed Flow Lane Addition Project 41 Traffic Operations Analysis Revised: February 2014 210 freeway segment leading away from the I-10 freeway will operate at LOS C and LOS D in the morning and evening peak periods, respectively. In the Horizon Year (2040), the levels of service at most of the ramp junctions are anticipated to be LOS D or better. At the specific ramp junctions where the Horizon Year 2040 levels of service are forecast to be LOS E, the Mixed Flow Lane project will incrementally improve these ramp junctions compared to the No Build condition. Improvements at these ramp junctions are not included in this project because ramp and interchange improvements are beyond the Purpose and Need for the Mixed Flow Lane project. Furthermore, future interchange improvement projects are anticipated to address the specific operational issues at these locations. The projected evening peak hour LOS E conditions at the westbound off-ramp to San Bernardino Avenue will be improved as part of the interchange reconstruction project proposed in the SR-210 PSR/PDS approved in 2008. Similarly, the Greenspot Road westbound off-ramp diverge LOS E in the evening peak hour will be addressed as part of the SR-210/Fifth Street- Greenspot Road interchange improvement project under development by the City of Highland. At each of these off-ramps, the addition of a deceleration lane in advance of the off-ramp divergence point should improve the ramp junction level of service to acceptable levels. Finally, the only other location of LOS E predicted in the Horizon Year 2040 within the project limits is the westbound off-ramp to Highland Avenue and the approaching freeway segment. Studies are currently underway for improvements at this existing interchange, which involve development of a new interchange at Victoria Avenue. While the specific improvements in this location within the SR-210 corridor are not known, it is reasonable to expect that the future year level of service issues at the westbound Highland Avenue off-ramp will be addressed by the proposed improvements considered in conjunction with the SR-210/Victoria Avenue interchange project. The Horizon Year (2040) No Build versus Build operational results clearly demonstrates the traffic enhancement value of the proposed project improvements. Many freeway mainline segments will operate at LOS E and LOS F without the addition of the third mixed flow lane in each direction. The level of service between Base Line and Fifth Street-Greenspot Road will degrade to LOS E and LOS F by 2040 if the auxiliary lanes between these two interchanges are not constructed. The addition of the eastbound acceleration lane at the Fifth Street on-ramp improves the level of service from LOS F in both the morning and evening peak hour periods to LOS D in both peak periods under Horizon Year (2040) traffic conditions. Conclusions The SR-210 Mixed Flow Lane Addition project will address traffic operational issues within this segment of the corridor in both the Opening Year (2020) and Horizon Year (2040) conditions consistent with the project's Purpose and Need. The proposed improvements will maintain levels of service of LOS D or better on all mainline freeway segments, all weave segments and at all ramp junctions. The only exceptions occur in locations where planned future interchange improvement projects would necessarily address the ramp junction diverge operations. All of the interchange on- ramps, including the freeway-to-freeway connectors at the SR-330 junction, are expected to operate at LOS D or better under future year traffic conditions. Therefore, ramp metering systems not already included in the proposed project improvements, should not be necessary to mitigate ramp junction merge levels of service.
  • 43. 08-SBD-210 PM R25.0/R33.2 EA 0C700, Project No. 0812000164 SR-210 Mixed Flow Lane Addition Project 42 Traffic Operations Analysis Revised: February 2014 Finally, the level of service of the freeway segment approaching the I-10 freeway junction is LOS C in both peak periods; therefore, the proposed improvements do not have a negative impact on the I-10 freeway interchange. Similarly, the project does not have any detrimental impacts on the westbound segment of the SR-210 freeway departing from the I-10 freeway junction and the level of service in this area is forecasted to remain at LOS D or better through 2040 without any additional improvements. The proposed mixed flow lane addition in each direction will not preclude other future operational improvement projects that are planned within this corridor. In fact, the addition of the third mixed flow lane will complement the future SR-210 HOV lane addition project and the development of interchange improvement projects throughout the project study limits. The proposed improvements meet the project’s Purpose and Need and improve future operational conditions in comparison with No Build conditions. It is anticipated that after the implementation of the proposed project and with the future addition of the HOV lane project, mainline and ramp merge/diverge operating conditions will further improve in conjunction with other planned interchange improvements within the project study area.
  • 44. 08-SBD-210 PM R25.0/R33.2 EA 0C700, Project No. 0812000164 SR-210 Mixed Flow Lane Addition Project 43 Traffic Operations Analysis Revised: February 2014 Appendix A – Traffic Model Projections
  • 45. SR-210 Mixed Flow Lane Addition Peak Hour Freeway Volume Summary AM PM AM PM AM PM AM PM AM PM AM PM Highland Ave Diverge 3MF/ 1L Ramp 4 2 864 786 1,090 1,020 1,150 1,160 960 850 890 740 Highland Ave Merge 3MF/ 1L Ramp -2 -3 598 488 640 550 690 730 540 400 550 390 SR-210 between Arden Avenue and Victoria Ave Freeway 3MF 66 62 2,760 3,007 3,150 3,370 3,370 3,800 4,620 4,740 4,930 5,230 SR-210 between Victoria Ave and SR- 330 Freeway 3MF 50 46 2,760 3,007 3,150 3,370 3,370 3,800 4,170 4,290 4,390 4,720 SR-210 to SR-330 Connector Diverge 3MF/ 1L Ramp 4 6 361 287 400 340 410 390 480 460 490 510 SR-210 between SR-330 and Base Line Weave 4MF 53 37 2,779 2,948 3,190 3,270 3,400 3,730 4,270 4,110 4,480 4,570 Sr-210 between Base Line and 5th Street Weave 4MF 4 2 819 554 850 570 900 630 940 600 990 660 SR-210 5th Street On-Ramp Merge 3MF/ 1L Ramp 4 5 1,032 820 1,060 860 1,120 930 1,140 970 1,200 1,040 SR-210 between 5th Street and San Bernardino Avenue Freeway 3MF 39 28 4,003 3,594 4,300 3,860 4,650 4,220 5,120 4,560 5,470 4,920 SR-210 San Bernardino Avenue Off- Ramp Diverge 3MF/ 1L Ramp 5 5 568 614 610 650 650 680 710 740 750 770 SR-210 San Bernardino Avenue On- Ramp Merge 4MF/ 1L Ramp 12 9 590 466 680 530 680 480 920 710 920 660 SR-210 between San Bernardino Avenue and I-10 Freeway Freeway 4MF 34 28 4,025 3,446 4,370 3,740 4,680 4,020 5,330 4,530 5,640 4,810 (1) Existing to No Build (2040) Annual Growth = [No Build (2040) - Existing (2012)] ÷ (2040 - 2012). Equation provided to illustrate general linear annual growth trends. Existing No Build Eastbound/Southbound Freeway Mainline Segment / Ramp Connection Facility Existing to No Build Annual Growth (1) 2012 2020 2040 Lanes Build No Build Build URS Corporation Revised: 2/10/2014 Printed: 2/11/2014
  • 46. SR-210 Mixed Flow Lane Addition Peak Hour Freeway Volume Summary AM PM AM PM AM PM AM PM AM PM AM PM SR-210 between I-10 Freeway and San Bernardino Avenue Freeway 3MF 42 37 2,663 3,774 3,000 4,070 3,420 4,890 3,850 4,800 4,270 5,620 SR-210 San Bernardino Avenue Off- Ramp Diverge 3MF/ 1L Ramp 8 12 194 778 260 870 270 870 410 1,110 420 1,110 SR-210 San Bernardino Avenue On- Ramp Merge 3MF/ 1L Ramp 11 9 615 720 700 790 800 1,090 930 970 1,030 1,270 SR-210 between San Bernardino Avenue and Greenspot Road Freeway 3MF 46 34 3,083 3,716 3,440 3,990 3,950 5,110 4,370 4,660 4,880 5,780 SR-210 Greenspot Road Off-Ramp Diverge 3MF/ 1L Ramp 2 4 652 944 670 970 760 1,170 710 1,050 800 1,250 SR-210 between Greenspot Road and Base Line Weave 4MF 44 35 2,640 3,038 2,980 3,300 3,460 4,390 3,880 3,910 4,360 5,000 SR-210 between Base Line and SR- 330 Weave 4MF 48 48 2,823 2,996 3,200 3,360 3,670 4,250 4,180 4,190 4,650 5,080 SR-210 SR-330 Connector Merge 3MF/ 1L Ramp 4 7 544 398 580 450 610 540 660 590 690 680 SR-210 between SR-330 and Victoria Avenue Freeway 3MF 51 51 3,176 2,985 3,580 3,380 4,070 4,340 4,600 4,290 5,090 5,250 SR-210 between Victoria Avenue and Highland Avenue-Arden Avenue Freeway 3MF 59 69 3,176 2,985 3,580 3,380 4,070 4,340 4,840 4,780 5,380 5,680 SR-210 Highland Avenue Off-Ramp Diverge 3MF/ 1L Ramp -2 3 449 282 520 360 560 460 390 380 310 340 SR-210 Highland Avenue On-Ramp Merge 3MF/ 1L Ramp 3 15 633 691 810 1,000 740 690 700 1,100 460 710 (1) Existing to No Build (2040) Annual Growth = [No Build (2040) - Existing (2012)] ÷ (2040 - 2012). Equation provided to illustrate general linear annual growth trends. Westbound/Northbound Freeway Mainline Segment / Ramp Connection Facility Existing to No Build Annual Growth (1) Build No Build Build Lanes 2012 2020 2040 Existing No Build URS Corporation Revised: 2/10/2014 Printed: 2/11/2014
  • 47. 08-SBD-210 PM R25.0/R33.2 EA 0C700, Project No. 0812000164 SR-210 Mixed Flow Lane Addition Project 44 Traffic Operations Analysis Revised: February 2014 Appendix B – Traffic Analysis Worksheets
  • 48. BASIC FREEWAY SEGMENTS WORKSHEET General Information Site Information Analyst KT Highway/Direction of Travel SR-210 EB Agency or Company URS From/To West of Highland Ave Off Date Performed 10/7/2013 Jurisdiction Analysis Time Period AM Analysis Year Existing Project Description SR-210 Widening PAED Oper.(LOS)       Des.(N)      Planning Data      Flow Inputs Volume, V 3026 veh/h Peak-Hour Factor, PHF 0.94 AADT veh/day %Trucks and Buses, PT 7 Peak-Hr Prop. of AADT, K %RVs, PR 0 Peak-Hr Direction Prop, D General Terrain: Level DDHV = AADT x K x D veh/h Grade % Length mi Up/Down % Calculate Flow Adjustments fp 1.00 ER 1.2 ET 1.5 fHV = 1/[1+PT(ET - 1) + PR(ER - 1)] 0.966 Speed Inputs Calc Speed Adj and FFS Lane Width ft Rt-Side Lat. Clearance ft Number of Lanes, N 3 Total Ramp Density, TRD ramps/mi FFS (measured) 65.0 mph Base free-flow Speed, BFFS mph fLW mph fLC mph TRD Adjustment mph FFS 65.0 mph LOS and Performance Measures Design (N) Operational (LOS) vp = (V or DDHV) / (PHF x N x fHV x fp) 1111 pc/h/ln S 65.0 mph D = vp / S 17.1 pc/mi/ln LOS B Design (N) Design LOS vp = (V or DDHV) / (PHF x N x fHV x fp) pc/h/ln S mph D = vp / S pc/mi/ln Required Number of Lanes, N Glossary Factor Location N - Number of lanes S - Speed V - Hourly volume D - Density vp - Flow rate FFS - Free-flow speed LOS - Level of service BFFS - Base free-flow speed DDHV - Directional design hour volume ER - Exhibits 11-10, 11-12 fLW - Exhibit 11-8 ET - Exhibits 11-10, 11-11, 11-13 fLC - Exhibit 11-9 fp - Page 11-18 TRD - Page 11-11 LOS, S, FFS, vp - Exhibits 11-2, 11-3 Copyright © 2012 University of Florida, All Rights Reserved HCS 2010TM Version 6.41 Generated: 10/7/2013 11:08 AM Page 1 of 1 BASIC FREEWAY WORKSHEET 10/7/2013 file://C:Userskristin_tsoAppDataLocalTempf2k3546.tmp
  • 49. BASIC FREEWAY SEGMENTS WORKSHEET General Information Site Information Analyst KT Highway/Direction of Travel SR-210 EB Agency or Company URS From/To West of Highland Ave Off Date Performed 10/7/2013 Jurisdiction Analysis Time Period PM Analysis Year Existing Project Description SR-210 Widening PAED Oper.(LOS)       Des.(N)      Planning Data      Flow Inputs Volume, V 3305 veh/h Peak-Hour Factor, PHF 0.95 AADT veh/day %Trucks and Buses, PT 7 Peak-Hr Prop. of AADT, K %RVs, PR 0 Peak-Hr Direction Prop, D General Terrain: Level DDHV = AADT x K x D veh/h Grade % Length mi Up/Down % Calculate Flow Adjustments fp 1.00 ER 1.2 ET 1.5 fHV = 1/[1+PT(ET - 1) + PR(ER - 1)] 0.966 Speed Inputs Calc Speed Adj and FFS Lane Width ft Rt-Side Lat. Clearance ft Number of Lanes, N 3 Total Ramp Density, TRD ramps/mi FFS (measured) 65.0 mph Base free-flow Speed, BFFS mph fLW mph fLC mph TRD Adjustment mph FFS 65.0 mph LOS and Performance Measures Design (N) Operational (LOS) vp = (V or DDHV) / (PHF x N x fHV x fp) 1200 pc/h/ln S 65.0 mph D = vp / S 18.5 pc/mi/ln LOS C Design (N) Design LOS vp = (V or DDHV) / (PHF x N x fHV x fp) pc/h/ln S mph D = vp / S pc/mi/ln Required Number of Lanes, N Glossary Factor Location N - Number of lanes S - Speed V - Hourly volume D - Density vp - Flow rate FFS - Free-flow speed LOS - Level of service BFFS - Base free-flow speed DDHV - Directional design hour volume ER - Exhibits 11-10, 11-12 fLW - Exhibit 11-8 ET - Exhibits 11-10, 11-11, 11-13 fLC - Exhibit 11-9 fp - Page 11-18 TRD - Page 11-11 LOS, S, FFS, vp - Exhibits 11-2, 11-3 Copyright © 2012 University of Florida, All Rights Reserved HCS 2010TM Version 6.41 Generated: 10/7/2013 2:10 PM Page 1 of 1 BASIC FREEWAY WORKSHEET 10/7/2013 file://C:Documents and Settingskristin_tsoLocal SettingsTempf2k52.tmp
  • 50. RAMPS AND RAMP JUNCTIONS WORKSHEET General Information Site Information Analyst KT Freeway/Dir of Travel SR-210 EB Agency or Company URS Junction Arden On Date Performed 12/18/2012 Jurisdiction Analysis Time Period AM Analysis Year Existing Project Description SR-210 Widening PAED Inputs Upstream Adj Ramp Yes       On      No      Off       Lup = 3810 ft Vu = 864 veh/h Freeway Number of Lanes, N 2 Ramp Number of Lanes, N 1 Acceleration Lane Length, LA 600 Deceleration Lane Length LD Freeway Volume, VF 2162 Ramp Volume, VR 598 Freeway Free-Flow Speed, SFF 65.0 Ramp Free-Flow Speed, SFR 50.0 Downstream Adj Ramp Yes      On      No       Off      Ldown = ft VD = veh/h Conversion to pc/h Under Base Conditions (pc/h) V (Veh/hr) PHF Terrain %Truck %Rv fHV fp v = V/PHF x fHV x fp Freeway 2162 0.94 Level 7 0 0.966 1.00 2380 Ramp 598 0.94 Level 7 0 0.966 1.00 658 UpStream 864 0.94 Level 7 0 0.966 1.00 951 DownStream Merge Areas Diverge Areas Estimation of v12 Estimation of v12 V12 = VF ( PFM ) LEQ = (Equation 13-6 or 13-7) PFM = 1.000 using Equation (Exhibit 13-6) V12 = 2380 pc/h V3 or Vav34 0 pc/h (Equation 13-14 or 13-17) Is V3 or Vav34 > 2,700 pc/h? Yes No            Is V3 or Vav34 > 1.5 * V12/2 Yes No            If Yes,V12a = pc/h (Equation 13-16, 13-18, or 13-19) V12 = VR + (VF - VR)PFD LEQ = (Equation 13-12 or 13-13) PFD = using Equation (Exhibit 13-7) V12 = pc/h V3 or Vav34 pc/h (Equation 13-14 or 13-17) Is V3 or Vav34 > 2,700 pc/h? Yes No           Is V3 or Vav34 > 1.5 * V12/2 Yes No           If Yes,V12a = pc/h (Equation 13-16, 13-18, or 13-19) Capacity Checks Capacity Checks Actual Capacity LOS F? Actual Capacity LOS F? VFO 3038 Exhibit 13-8 No VF Exhibit 13-8 VFO = VF - VR Exhibit 13-8 VR Exhibit 13- 10 Flow Entering Merge Influence Area Flow Entering Diverge Influence Area Actual Max Desirable Violation? Actual Max Desirable Violation? VR12 3038 Exhibit 13-8 4600:All No V12 Exhibit 13-8 Level of Service Determination (if not F) Level of Service Determination (if not F) DR = 5.475 + 0.00734 v R + 0.0078 V12 - 0.00627 LA DR = 25.1 (pc/mi/ln) LOS = C (Exhibit 13-2) DR = 4.252 + 0.0086 V12 - 0.009 LD DR = (pc/mi/ln) LOS = (Exhibit 13-2) Speed Determination Speed Determination MS = 0.342 (Exibit 13-11) SR= 57.1 mph (Exhibit 13-11) S0= N/A mph (Exhibit 13-11) S = 57.1 mph (Exhibit 13-13) Ds = (Exhibit 13-12) SR= mph (Exhibit 13-12) S0= mph (Exhibit 13-12) S = mph (Exhibit 13-13) Copyright © 2012 University of Florida, All Rights Reserved HCS2010TM Version 6.41 Generated: 10/11/2013 1:40 PM Page 1 of 1 RAMPS AND RAMP JUNCTIONS WORKSHEET 10/11/2013 file://C:Documents and Settingskristin_tsoLocal SettingsTempr2kD.tmp
  • 51. RAMPS AND RAMP JUNCTIONS WORKSHEET General Information Site Information Analyst KT Freeway/Dir of Travel SR-210 EB Agency or Company URS Junction Arden On Date Performed 12/18/2012 Jurisdiction Analysis Time Period PM Analysis Year Existing Project Description SR-210 Widening PAED Inputs Upstream Adj Ramp Yes      On      No       Off      Lup = ft Vu = veh/h Freeway Number of Lanes, N 2 Ramp Number of Lanes, N 1 Acceleration Lane Length, LA 600 Deceleration Lane Length LD Freeway Volume, VF 2519 Ramp Volume, VR 488 Freeway Free-Flow Speed, SFF 65.0 Ramp Free-Flow Speed, SFR 50.0 Downstream Adj Ramp Yes       On       No      Off      Ldown = 3810 ft VD = 488 veh/h Conversion to pc/h Under Base Conditions (pc/h) V (Veh/hr) PHF Terrain %Truck %Rv fHV fp v = V/PHF x fHV x fp Freeway 2519 0.95 Level 7 0 0.966 1.00 2744 Ramp 488 0.95 Level 7 0 0.966 1.00 532 UpStream DownStream 488 0.95 Level 7 0 0.966 1.00 532 Merge Areas Diverge Areas Estimation of v12 Estimation of v12 V12 = VF ( PFM ) LEQ = (Equation 13-6 or 13-7) PFM = 1.000 using Equation (Exhibit 13-6) V12 = 2744 pc/h V3 or Vav34 0 pc/h (Equation 13-14 or 13-17) Is V3 or Vav34 > 2,700 pc/h? Yes No            Is V3 or Vav34 > 1.5 * V12/2 Yes No            If Yes,V12a = pc/h (Equation 13-16, 13-18, or 13-19) V12 = VR + (VF - VR)PFD LEQ = (Equation 13-12 or 13-13) PFD = using Equation (Exhibit 13-7) V12 = pc/h V3 or Vav34 pc/h (Equation 13-14 or 13-17) Is V3 or Vav34 > 2,700 pc/h? Yes No           Is V3 or Vav34 > 1.5 * V12/2 Yes No           If Yes,V12a = pc/h (Equation 13-16, 13-18, or 13-19) Capacity Checks Capacity Checks Actual Capacity LOS F? Actual Capacity LOS F? VFO 3276 Exhibit 13-8 No VF Exhibit 13-8 VFO = VF - VR Exhibit 13-8 VR Exhibit 13- 10 Flow Entering Merge Influence Area Flow Entering Diverge Influence Area Actual Max Desirable Violation? Actual Max Desirable Violation? VR12 3276 Exhibit 13-8 4600:All No V12 Exhibit 13-8 Level of Service Determination (if not F) Level of Service Determination (if not F) DR = 5.475 + 0.00734 v R + 0.0078 V12 - 0.00627 LA DR = 27.0 (pc/mi/ln) LOS = C (Exhibit 13-2) DR = 4.252 + 0.0086 V12 - 0.009 LD DR = (pc/mi/ln) LOS = (Exhibit 13-2) Speed Determination Speed Determination MS = 0.364 (Exibit 13-11) SR= 56.6 mph (Exhibit 13-11) S0= N/A mph (Exhibit 13-11) S = 56.6 mph (Exhibit 13-13) Ds = (Exhibit 13-12) SR= mph (Exhibit 13-12) S0= mph (Exhibit 13-12) S = mph (Exhibit 13-13) Copyright © 2012 University of Florida, All Rights Reserved HCS2010TM Version 6.41 Generated: 10/11/2013 1:41 PM Page 1 of 1 RAMPS AND RAMP JUNCTIONS WORKSHEET 10/11/2013 file://C:Documents and Settingskristin_tsoLocal SettingsTempr2k35.tmp
  • 52. BASIC FREEWAY SEGMENTS WORKSHEET General Information Site Information Analyst KT Highway/Direction of Travel SR-210 EB Agency or Company URS From/To Date Performed 10/7/2013 Jurisdiction Analysis Time Period AM Analysis Year Existing Project Description SR-210 Widening PAED Oper.(LOS)       Des.(N)      Planning Data      Flow Inputs Volume, V 2760 veh/h Peak-Hour Factor, PHF 0.94 AADT veh/day %Trucks and Buses, PT 7 Peak-Hr Prop. of AADT, K %RVs, PR 0 Peak-Hr Direction Prop, D General Terrain: Level DDHV = AADT x K x D veh/h Grade % Length mi Up/Down % Calculate Flow Adjustments fp 1.00 ER 1.2 ET 1.5 fHV = 1/[1+PT(ET - 1) + PR(ER - 1)] 0.966 Speed Inputs Calc Speed Adj and FFS Lane Width ft Rt-Side Lat. Clearance ft Number of Lanes, N 2 Total Ramp Density, TRD ramps/mi FFS (measured) 65.0 mph Base free-flow Speed, BFFS mph fLW mph fLC mph TRD Adjustment mph FFS 65.0 mph LOS and Performance Measures Design (N) Operational (LOS) vp = (V or DDHV) / (PHF x N x fHV x fp) 1519 pc/h/ln S 64.8 mph D = vp / S 23.4 pc/mi/ln LOS C Design (N) Design LOS vp = (V or DDHV) / (PHF x N x fHV x fp) pc/h/ln S mph D = vp / S pc/mi/ln Required Number of Lanes, N Glossary Factor Location N - Number of lanes S - Speed V - Hourly volume D - Density vp - Flow rate FFS - Free-flow speed LOS - Level of service BFFS - Base free-flow speed DDHV - Directional design hour volume ER - Exhibits 11-10, 11-12 fLW - Exhibit 11-8 ET - Exhibits 11-10, 11-11, 11-13 fLC - Exhibit 11-9 fp - Page 11-18 TRD - Page 11-11 LOS, S, FFS, vp - Exhibits 11-2, 11-3 Copyright © 2012 University of Florida, All Rights Reserved HCS 2010TM Version 6.41 Generated: 10/8/2013 5:45 PM Page 1 of 1 BASIC FREEWAY WORKSHEET 10/8/2013 file://C:Documents and Settingskristin_tsoLocal SettingsTempf2k1132.tmp
  • 53. BASIC FREEWAY SEGMENTS WORKSHEET General Information Site Information Analyst KT Highway/Direction of Travel SR-210 EB Agency or Company URS From/To Arden On / SR-330 Off Date Performed 10/7/2013 Jurisdiction Analysis Time Period PM Analysis Year Existing Project Description SR-210 Widening PAED Oper.(LOS)       Des.(N)      Planning Data      Flow Inputs Volume, V 3007 veh/h Peak-Hour Factor, PHF 0.95 AADT veh/day %Trucks and Buses, PT 7 Peak-Hr Prop. of AADT, K %RVs, PR 0 Peak-Hr Direction Prop, D General Terrain: Level DDHV = AADT x K x D veh/h Grade % Length mi Up/Down % Calculate Flow Adjustments fp 1.00 ER 1.2 ET 1.5 fHV = 1/[1+PT(ET - 1) + PR(ER - 1)] 0.966 Speed Inputs Calc Speed Adj and FFS Lane Width ft Rt-Side Lat. Clearance ft Number of Lanes, N 2 Total Ramp Density, TRD ramps/mi FFS (measured) 65.0 mph Base free-flow Speed, BFFS mph fLW mph fLC mph TRD Adjustment mph FFS 65.0 mph LOS and Performance Measures Design (N) Operational (LOS) vp = (V or DDHV) / (PHF x N x fHV x fp) 1638 pc/h/ln S 64.2 mph D = vp / S 25.5 pc/mi/ln LOS C Design (N) Design LOS vp = (V or DDHV) / (PHF x N x fHV x fp) pc/h/ln S mph D = vp / S pc/mi/ln Required Number of Lanes, N Glossary Factor Location N - Number of lanes S - Speed V - Hourly volume D - Density vp - Flow rate FFS - Free-flow speed LOS - Level of service BFFS - Base free-flow speed DDHV - Directional design hour volume ER - Exhibits 11-10, 11-12 fLW - Exhibit 11-8 ET - Exhibits 11-10, 11-11, 11-13 fLC - Exhibit 11-9 fp - Page 11-18 TRD - Page 11-11 LOS, S, FFS, vp - Exhibits 11-2, 11-3 Copyright © 2012 University of Florida, All Rights Reserved HCS 2010TM Version 6.41 Generated: 10/8/2013 5:45 PM Page 1 of 1 BASIC FREEWAY WORKSHEET 10/8/2013 file://C:Documents and Settingskristin_tsoLocal SettingsTempf2k112C.tmp
  • 54. RAMPS AND RAMP JUNCTIONS WORKSHEET General Information Site Information Analyst KT Freeway/Dir of Travel SR-210 EB Agency or Company URS Junction SR-330 Off Date Performed 12/18/2012 Jurisdiction Analysis Time Period AM Analysis Year 2012 Project Description SR-210 Widening PAED Inputs Upstream Adj Ramp Yes      On      No       Off      Lup = ft Vu = veh/h Freeway Number of Lanes, N 2 Ramp Number of Lanes, N 1 Acceleration Lane Length, LA Deceleration Lane Length LD 1180 Freeway Volume, VF 2760 Ramp Volume, VR 361 Freeway Free-Flow Speed, SFF 65.0 Ramp Free-Flow Speed, SFR 50.0 Downstream Adj Ramp Yes       On       No      Off      Ldown = 3260 ft VD = 380 veh/h Conversion to pc/h Under Base Conditions (pc/h) V (Veh/hr) PHF Terrain %Truck %Rv fHV fp v = V/PHF x fHV x fp Freeway 2760 0.94 Level 7 0 0.966 1.00 3039 Ramp 361 0.94 Level 15 0 0.930 1.00 413 UpStream DownStream 380 0.94 Level 6 0 0.971 1.00 416 Merge Areas Diverge Areas Estimation of v12 Estimation of v12 V12 = VF ( PFM ) LEQ = (Equation 13-6 or 13-7) PFM = using Equation (Exhibit 13-6) V12 = pc/h V3 or Vav34 pc/h (Equation 13-14 or 13-17) Is V3 or Vav34 > 2,700 pc/h? Yes No           Is V3 or Vav34 > 1.5 * V12/2 Yes No           If Yes,V12a = pc/h (Equation 13-16, 13-18, or 13-19) V12 = VR + (VF - VR)PFD LEQ = (Equation 13-12 or 13-13) PFD = 1.000 using Equation (Exhibit 13-7) V12 = 3039 pc/h V3 or Vav34 0 pc/h (Equation 13-14 or 13-17) Is V3 or Vav34 > 2,700 pc/h? Yes No            Is V3 or Vav34 > 1.5 * V12/2 Yes No            If Yes,V12a = pc/h (Equation 13-16, 13-18, or 13- 19) Capacity Checks Capacity Checks Actual Capacity LOS F? Actual Capacity LOS F? VFO Exhibit 13-8 VF 3039 Exhibit 13-8 4700 No VFO = VF - VR 2626 Exhibit 13-8 4700 No VR 413 Exhibit 13-10 2100 No Flow Entering Merge Influence Area Flow Entering Diverge Influence Area Actual Max Desirable Violation? Actual Max Desirable Violation? VR12 Exhibit 13-8 V12 3039 Exhibit 13-8 4400:All No Level of Service Determination (if not F) Level of Service Determination (if not F) DR = 5.475 + 0.00734 v R + 0.0078 V12 - 0.00627 LA DR = (pc/mi/ln) LOS = (Exhibit 13-2) DR = 4.252 + 0.0086 V12 - 0.009 LD DR = 19.8 (pc/mi/ln) LOS = B (Exhibit 13-2) Speed Determination Speed Determination MS = (Exibit 13-11) SR= mph (Exhibit 13-11) S0= mph (Exhibit 13-11) S = mph (Exhibit 13-13) Ds = 0.270 (Exhibit 13-12) SR= 58.8 mph (Exhibit 13-12) S0= N/A mph (Exhibit 13-12) S = 58.8 mph (Exhibit 13-13) Copyright © 2012 University of Florida, All Rights Reserved HCS2010TM Version 6.41 Generated: 10/11/2013 1:41 PM Page 1 of 1 RAMPS AND RAMP JUNCTIONS WORKSHEET 10/11/2013 file://C:Documents and Settingskristin_tsoLocal SettingsTempr2k3B.tmp