SlideShare a Scribd company logo
1 of 66
Download to read offline
The following presentation has been created in its entirety by Ian Wave.
This presentation has been based on a conceptual Land Development Design for an existing local
residential property and the drawings and modeling of which are to replicate the existing conditions of
the land and its final completed phase. During the design process it has been my intention to follow the
common local development design and construction procedures and regulations closely to create the
preliminary design for this project so it will be feasible to prepare a detailed construction cost estimate.
This somewhat steep property is little over 6 acres and currently wooded and located in R 9600 Zoning
but there is no sign of any wet lands and the pre-development modeling displays a cleared land. A two
lane road and a small creek run at the bottom of the property and there is no limitations as far as Sight
Distances.
The Water, Sanitary Sewer, Natural Gas and Power Services are available at the bottom of the property
along the City Road but it is planed to bring water and gas services to the subdivision from the top and
underground Power, Telephone and Cable Services to be used.
This is a completely scaled and dimensioned design and all of the detailed and printed plans are
available for review and permitting process.
PERSPECTIVE PRE-DEVELOPMENT VIEW OF THE PROPERTY.
This property will be accessed by a bridge over an environmentally protected creek, so the design would
include a short span arched reinforced concrete bridge design, it is also planned to subdivide this property
into 20 single family lots (Minimum 9600 SF. per lot) plus a Tennis Court and a Storm Drain Infiltration
area.
PROPERTY PRE-DEVELOPMENT CONTOUR LINES.
The plan view displaying the whole subdivision layout which includes a private one way and a two way
roads throughout the property for total accessibility.
PROPOSED 20 LOTS SUBDIVISION LAYOUT.
To provide an access onto the property the City Main Road must be studied and evaluated.
By viewing the following existing road plan and its profile, it seems an access at station 3+00 by way of
a Bridge over the creek would be a proper location to consider.
THE CITY ROAD SUPER ELEVATED PLAN AND PROFILE VIEWS.
The cross section view of the City Road Alignment at station 3+00 , where there will be an access road
designed and built onto the subdivision from the North.
CROSS SECTION VIEW OF THE CITY ROAD AT STATION 3+00.
CROSS SECTION VIEWS OF THE CITY ROAD AT VARIOUS STATIONS.
The private road alignments for desired accessibility and their transitions to the city road are established
and considering the existing land contours and profiles the roads are designed.
MAIN ROAD HORIZONTAL ALIGNMENT ABOUT 1200 LINEAR FEET.
The following page will display the Vertical Curve of the above alignment.
Also there will be another two way road T ing off the main road and coming south to serve the culdesac
As the following graph displays its Vertical Curve Design.
After designing the vertical curves the Cross Sections information are available and using the designed Templates
the amount of necessary soil cut and fill could be calculated, please review the following samples.
The following graphs show placement of the retaining walls by Rockery or Reinforced Concrete.
CROSS SECTION VIEW OF 16 FEET WIDE PRIVATE ROAD AT STATION 1+50.
CROSS SECTION VIEW OF 16 FEET WIDE PRIVATE ROAD AT STATION 2+15.
We now can calculate the amount of soil cut and fill volumes by having the cross section information at
relatively close stations, in this case every foot as is indicated in the table bellow.
THE MAIN ROAD SOIL CUT AND FILL CALCULATION.
The figure bellow displays the complete subdivision layout with detail information of the lots’ corner
point positions, lot lines’ orientations and also corners and special points elevations with respect to our
referenced survey Monument in the following page.
To construct the roads, The Horizontal Curves information are also necessary as is shown in the
table bellow for the main road.
Horizontal Alignment Station and Curve Report.
Alignment: A-2
Desc: Private RD.
Desc. Station Spiral/Curve Data Northing Easting
-------------------------------------------------------------------------------
-------------------------------------------------------------------------------
PI 0+00 17.33 320.17
Length: 148.90 Course: N 75-00-00 E
-------------------------------------------------------------------------------
PI 1+48.90 55.87 464.00
Length: 268.62 Course: N 00-00-00 E
Delta: 75-00-00
-------------------------------------------------------------------------------
Tangent Data
0+00 17.33 320.17
1+32.02 51.50 447.69
Length: 132.02 Course: N 75-00-00 E
-------------------------------------------------------------------------------
Circular Curve Data
PC 1+32.02 51.50 447.69
RP 72.75 442.00
PT 1+60.82 72.75 464.00
Delta: 75-00-00 Type: LEFT
Radius: 22.00 DOC: 260-26-07
Length: 28.80 Tangent: 16.88
Mid-Ord: 4.55 External: 5.73
Chord: 26.79 Course: N 37-30-00 E
Es: 5.73
-------------------------------------------------------------------------------
PI 4+12.56 324.48 464.00
Length: 328.00 Course: N 90-00-00 W
Delta: 90-00-00
-------------------------------------------------------------------------------
Tangent Data
1+60.82 72.75 464.00
3+90.56 302.48 464.00
Length: 229.74 Course: N 00-00-00 E
-------------------------------------------------------------------------------
Circular Curve Data
PC 3+90.56 302.48 464.00
RP 302.48 442.00
PT 4+25.12 324.48 442.00
Delta: 90-00-00 Type: LEFT
Radius: 22.00 DOC: 260-26-07
Length: 34.56 Tangent: 22.00
Mid-Ord: 6.44 External: 9.11
Chord: 31.11 Course: N 45-00-00 W
Es: 9.11
-------------------------------------------------------------------------------
PI 7+31.12 324.48 136.00
Length: 257.81 Course: S 00-00-00 W
Delta: 90-00-00
-------------------------------------------------------------------------------
Tangent Data
4+25.12 324.48 442.00
7+09.12 324.48 158.00
Length: 284.00 Course: N 90-00-00 W
-------------------------------------------------------------------------------
Circular Curve Data
PC 7+09.12 324.48 158.00
RP 302.48 158.00
PT 7+43.67 302.48 136.00
Delta: 90-00-00 Type: LEFT
Radius: 22.00 DOC: 260-26-07
Length: 34.56 Tangent: 22.00
Mid-Ord: 6.44 External: 9.11
Chord: 31.11 Course: S 45-00-00 W
Es: 9.11
-------------------------------------------------------------------------------
PI 9+79.48 66.67 136.00
Length: 190.67 Course: S 75-00-00 E
Delta: 75-00-00
-------------------------------------------------------------------------------
Tangent Data
7+43.67 302.48 136.00
9+62.60 83.56 136.00
Length: 218.93 Course: S 00-00-00 W
-------------------------------------------------------------------------------
Circular Curve Data
PC 9+62.60 83.56 136.00
RP 83.56 158.00
PT 9+91.40 62.30 152.31
Delta: 75-00-00 Type: LEFT
Radius: 22.00 DOC: 260-26-07
Length: 28.80 Tangent: 16.88
Mid-Ord: 4.55 External: 5.73
Chord: 26.79 Course: S 37-30-00 E
Es: 5.73
-------------------------------------------------------------------------------
PI 11+65.18 17.33 320.17
-------------------------------------------------------------------------------
Tangent Data
9+91.40 62.30 152.31
11+65.18 17.33 320.17
Length: 173.78 Course: S 75-00-00 E
______________________________________________________
As the rough roads are established and constructed, the lots’ rough surfaces based on the designed information could
also be built. The individual lots and total soil cut and fill volumes are shown in the figure bellow. This soil will be
reserved for future use when the actual construction of homes will begin based on the Landscaping Designs and or the
home owner’s desire for more level ground.
SOIL CUT AND FILL VOLUME CALCULATION FOR THE SUBDIVISION.
At this stage of the development The Utility Pipes and Cables could be installed , my personal
preference is to first start laying down the Sanitary Sewer Pipes based on the approved plans.
The following figures represent the proposed Sanitary Sewer System for this subdivision.
There will be 3 Main lines called S. Sewer East, S. Sewer North and S. Sewer West which will join
together at bottom of the property before connecting to the City Sewer Line.
The Main Water Supply lines will be installed and connected to The City Main next. The following graphs represent design of the water supply system for the
subdivision. There will be three main branches called Main North, Main East and Main West.
The Storm Drain Pipes will be installed and connected to the Storage & Infiltration Basin at the bottom of the property next.
The storage structure and pipe design will be based on the following information and methods.
Graphical Peak Discharge method
Given Input Data:
Description ..................... East Right Side
Tennis Court & Road
Rainfall distribution ........... Type I
Frequency ....................... 2 years
Rainfall, P (24-hours) .......... 3.0000 in
Drainage area ................... 0.6474 ac
Runoff curve number, CN ......... 98
Time of concentration, Tc ....... 360.0000 sec
Pond and Swamp Areas ............ 0.0000 %
of Area
Computed Results:
Initial abstraction, Ia ......... 0.0408 in
Ia/P ............................ 0.1000
Unit peak discharge, qu ......... 503.8369
csm/in
Runoff, Q ....................... 2.7683 in
Pond and swamp adjustment, Fp ... 1.0000
Peak discharge, qp .............. 1.4109 cfs
Manning Pipe Calculator
Given Input Data:
Shape ........................... Circular
Solving for ..................... Depth of Flow
Diameter ........................ 0.4829 ft
Flowrate ........................ 3.3039 cfs
Slope ........................... 0.2000 ft/ft
Manning's n ..................... 0.0090
Computed Results:
Depth ........................... 0.3958 ft
Area ............................ 0.1832 ft2
Wetted Area ..................... 0.1607 ft2
Wetted Perimeter ................ 1.0935 ft
Perimeter ....................... 1.5172 ft
Velocity ........................ 20.5616 fps
Hydraulic Radius ................ 0.1469 ft
Percent Full .................... 81.9629 %
Full flow Flowrate .............. 3.3039 cfs
Full flow velocity .............. 18.0373 fps
The above Flowrate is based on Peak
discharge of the East 6 lots of
0.3155 x 6 = 1.8930 cfs Plus The road and
Tennis court of 1.4109 cfs.
Graphical Peak Discharge method
Given Input Data:
Description ..................... Total Impervious Area
(Tennis Court & Roads)
Rainfall distribution ........... Type I
Frequency ....................... 2 years
Rainfall, P (24-hours) .......... 3.0000 in
Drainage area ................... 1.2673 ac
Runoff curve number, CN ......... 98
Time of concentration, Tc ....... 360.0000 sec
Pond and Swamp Areas ............ 0.0000 % of
Area
Computed Results:
Initial abstraction, Ia ......... 0.0408 in
Ia/P ............................ 0.1000
Unit peak discharge, qu ......... 503.8369 csm/in
Runoff, Q ....................... 2.7683 in
Pond and swamp adjustment, Fp ... 1.0000
Peak discharge, qp .............. 2.7618 cfs
Predevelopment Runoff:
Graphical Peak Discharge method
Given Input Data:
Description ..................... Predevelopment
Rainfall distribution ........... Type I
Frequency ....................... 2 years
Rainfall, P (24-hours) .......... 3.0000 in
Drainage area ................... 6.3200 ac
Runoff curve number, CN ......... 72
Time of concentration, Tc ....... 360.0000 sec
Pond and Swamp Areas ............ 0.0000 % of Area
Computed Results:
Initial abstraction, Ia ......... 0.7778 in
Ia/P ............................ 0.2593
Unit peak discharge, qu ......... 388.7183 csm/in
Runoff, Q ....................... 0.8081 in
Pond and swamp adjustment, Fp ... 1.0000
Peak discharge, qp .............. 3.1019 cfs
Postdevelopment Runoff:
Graphical Peak Discharge method
Given Input Data:
Description ..................... Lot Runoff
(9600 SF)
Rainfall distribution ........... Type I
Frequency ....................... 2 years
Rainfall, P (24-hours) .......... 3.0000 in
Drainage area ................... 0.2204 ac
Runoff curve number, CN ......... 88
Time of concentration, Tc ....... 360.0000
sec
Pond and Swamp Areas ............ 0.0000 %
of Area
Computed Results:
Initial abstraction, Ia ......... 0.2727 in
Ia/P ............................ 0.1000
Unit peak discharge, qu ......... 503.8369
csm/in
Runoff, Q ....................... 1.8182 in
Pond and swamp adjustment, Fp ...
1.0000
Peak discharge, qp .............. 0.3155 cfs
Graphical Peak Discharge method
Given Input Data:
Description ..................... Tennis Court &
Road
Rainfall distribution ........... Type I
Frequency ....................... 2 years
Rainfall, P (24-hours) .......... 3.0000 in
Drainage area ................... 1.2673 ac
Runoff curve number, CN ......... 98
Time of concentration, Tc ....... 360.0000
sec
Pond and Swamp Areas ............ 0.0000 %
of Area
Computed Results:
Initial abstraction, Ia ......... 0.0408 in
Ia/P ............................ 0.1000
Unit peak discharge, qu ......... 503.8369
csm/in
Runoff, Q ....................... 2.7683 in
Pond and swamp adjustment, Fp ...
1.0000
Peak discharge, qp .............. 2.7618 cfs
Total Runoff Volume Calculation
V1 (Predevelopment) = Q x A = 0.81 in (275,275 SF)(1/12) = 18,580 CFT
V2 (Postdevelopment) = Q1 ( A1) + Q2 (A2 )
A1 = 197,426.75SF ( Total Lot Area )
A2 = 55,203.45SF ( Private Road + Tennis Court Areas)
V2 = 1.82 in ( 197,426.75 SF )(1/12) +
2.77in ( 46,203.45SF + 9,000SF )(1/12) = 42,685CFT
The Design Infiltration Basin Size to store the increased storm runoff :
Increased Volume = V2 - V1 (qu1/qu2)
= 42,685 CFT - 18,580 Cft (388.72/503.84) =28,350 CFT=212,100 GAL.
The following graphs display the Storm Drain Pipe Design. There will be 6 branches, 1 through 6, one on each side of the roads serving the Roads and individual lots.
At this time rest of the Utility Lines must be installed as the following graph displays a Cross Section view of the Main Road and the utility lines at station 3+25.00.
While the Utility lines are being installed the Retaining Walls for both the roads and individual lots should be built as well which requires good
scheduling, organizing and management with different trades contractors just so they can accomplish their part of the assignments collectively
without any interference to advance the project as planned which is very critical in Land Development Projects.
After all the utility lines have been installed and extended to the individual lots and approved with respective Districts and County Officials, the
trenches and retaining walls could be back filled and compacted where necessary to a required density or soil bearing capacity and rough grades
could be once again reestablished. The next step is to build the Curbs, Private Roads, Sidewalks, stairways and Accesses to the individual lots
and install the Utility Fixtures & Meters, Safety Elements and Hydro-Seed the entire bare land to prevent any potential erosion progressively as
designed, and after the project as a whole has been fully inspected, approved and singed off , The Development is pretty much complete and
The Plat could be Recorded and ready for further development which is building the Homes and Public Facilities.
I like to mention that this design does not include Landscaping Design which is essential to any development and must be professionally designed
and implemented but its total footage has been considered and dedicated.
Based on these design criteria and information I have created 3D Modeling of the development to virtually observe the finished product and
also to make it realistic for a more precise construction estimates preparation. Various Perspective Views are presented in th following pages.
POST DEVELOPMENT SW. ISO. VIEW
SW. LOWER SEC. CLOSE-UP VIEW
SW UPPER SEC. CLOSE-UP VIEW
SE. LOWER SEC. CLOSE-UP VIEW
SE. MID. SEC. CLOSE-UP VIEW
NE. MID. SEC. CLOSE-UP VIEW
NS. MID. SEC. CLOSE-UP VIEW
NW. CLOSE-UP VIEW
SE. LOWER SEC. CLOSE-UP VIEW
SE. LOWER SEC. WITH STORM BASIN CAPPED OFF, CLOSE-UP VIEW
SE. UPPER SEC. CLOSE-UP VIEW
TENNIS COURT CLOSE-UP VIEW
ENTRANCE TO THE SUBDIVISION CLOSE-UP VIEW
SW. ENTRANCE CLOSE-UP VIEW
SE. ENTRANCE CLOSE-UP VIEW
TENNIS COURT CLOSE-UP VIEW
SW. ENTRANCE CLOSE-UP VIEW
CLOSE-UP VIEW
RETAINING WALL CLOSE-UP VIEW
MAPLE LN. SW. CLOSE-UP VIEW
CULDESAC RETAINING WALL CLOSE-UP VIEW
CORNER STAIRWAY CLOSE-UP VIEW
SW. CORNER STAIRWAY CLOSE-UP VIEW
To take a step further in this project I designed a sample Single Family Home of about 4,000 SF. With 3 door Garage and a Pool for lot 18 of this subdivision.
The following graphs display the details of this design and also the built house in various views.
FLOOR PLAN VIEWS
FOUNDATION PERSPECTIVE VIEW
SW. PERSPECTIVE VIEW
SE. PERSPECTIVE VIEW
NE. PERSPECTIVE VIEW
NW. PERSPECTIVE VIEW
HOUSE BACKYARD VIEW
HOUSE BUILT ON LOT 18 VIEW
HOUSE ON LOT 18 SW. VIEW
HOUSE ON LOT 18 SE. VIEW
HOUSE ON LOT 18 NE. VIEW
HOUSE ON LOT 18 NW. VIEW
WELCOME TO THE PANORAMA
This Development Design is complete and all the Engineering & Architectural Details are available for further review and discussion.
For more information please contact me at ianstructures@yahoo.com.

More Related Content

Viewers also liked

what-do-we-know-perry-chapter
what-do-we-know-perry-chapterwhat-do-we-know-perry-chapter
what-do-we-know-perry-chapterVarun Vig
 
Comenzando el recorrido
Comenzando el recorridoComenzando el recorrido
Comenzando el recorridoAxel Quiroz
 
Investigacion U-2 lectura y redaccion
Investigacion U-2 lectura y redaccionInvestigacion U-2 lectura y redaccion
Investigacion U-2 lectura y redaccionOrta Orta
 
BHASKARAN CHANDRA SEKHAR CV
BHASKARAN CHANDRA SEKHAR CVBHASKARAN CHANDRA SEKHAR CV
BHASKARAN CHANDRA SEKHAR CVBCSPRODUCTIONS
 

Viewers also liked (9)

Ladakh group tour
Ladakh group tourLadakh group tour
Ladakh group tour
 
sajna psychology
sajna psychologysajna psychology
sajna psychology
 
what-do-we-know-perry-chapter
what-do-we-know-perry-chapterwhat-do-we-know-perry-chapter
what-do-we-know-perry-chapter
 
Docker Workshop
Docker WorkshopDocker Workshop
Docker Workshop
 
Trimainne Forrest PPP
Trimainne Forrest PPPTrimainne Forrest PPP
Trimainne Forrest PPP
 
Appreciative learning
Appreciative learningAppreciative learning
Appreciative learning
 
Comenzando el recorrido
Comenzando el recorridoComenzando el recorrido
Comenzando el recorrido
 
Investigacion U-2 lectura y redaccion
Investigacion U-2 lectura y redaccionInvestigacion U-2 lectura y redaccion
Investigacion U-2 lectura y redaccion
 
BHASKARAN CHANDRA SEKHAR CV
BHASKARAN CHANDRA SEKHAR CVBHASKARAN CHANDRA SEKHAR CV
BHASKARAN CHANDRA SEKHAR CV
 

Similar to land Development

Highway design presentation (Malyar Talash)
Highway design presentation (Malyar Talash)Highway design presentation (Malyar Talash)
Highway design presentation (Malyar Talash)Malyar Talash
 
Dragline Planning
Dragline PlanningDragline Planning
Dragline PlanningVR M
 
Traffic StudyProject location· Summary Traf.docx
Traffic StudyProject location· Summary Traf.docxTraffic StudyProject location· Summary Traf.docx
Traffic StudyProject location· Summary Traf.docxturveycharlyn
 
SANCTION DRAWING PROJECT.PDF
SANCTION DRAWING PROJECT.PDFSANCTION DRAWING PROJECT.PDF
SANCTION DRAWING PROJECT.PDFARUNIMASRAJU
 
RTE Roundabout Analysis - Technical Data
RTE Roundabout Analysis - Technical DataRTE Roundabout Analysis - Technical Data
RTE Roundabout Analysis - Technical DataJerry Dinzes
 
21dj0036 plan.pdf
21dj0036 plan.pdf21dj0036 plan.pdf
21dj0036 plan.pdfQuote5
 
Design_Guidelines_and_Standard_Drawings.pdf
Design_Guidelines_and_Standard_Drawings.pdfDesign_Guidelines_and_Standard_Drawings.pdf
Design_Guidelines_and_Standard_Drawings.pdfecep nurali
 
Items # 7&8 - 309 & 317 Lamont Replat
Items # 7&8 - 309 & 317 Lamont ReplatItems # 7&8 - 309 & 317 Lamont Replat
Items # 7&8 - 309 & 317 Lamont Replatahcitycouncil
 
2011.02rev canda larga ranch
2011.02rev canda larga ranch2011.02rev canda larga ranch
2011.02rev canda larga ranchjamesmaredmond
 
Saratoga Landscape and Lighting Districts 2016-2017
Saratoga Landscape and Lighting Districts 2016-2017Saratoga Landscape and Lighting Districts 2016-2017
Saratoga Landscape and Lighting Districts 2016-2017Rishi Kumar
 
Week Four.pdf geomagnetic.1presentation.
Week Four.pdf geomagnetic.1presentation.Week Four.pdf geomagnetic.1presentation.
Week Four.pdf geomagnetic.1presentation.jiranjami46
 
Route 123 and Jermantown Rd. Intersection Improvements November 2020
Route 123 and Jermantown Rd. Intersection Improvements November 2020Route 123 and Jermantown Rd. Intersection Improvements November 2020
Route 123 and Jermantown Rd. Intersection Improvements November 2020Fairfax County
 
Pasinaya-Townhomes-Thickened-Slab-1.pdf
Pasinaya-Townhomes-Thickened-Slab-1.pdfPasinaya-Townhomes-Thickened-Slab-1.pdf
Pasinaya-Townhomes-Thickened-Slab-1.pdfIsabel68664
 

Similar to land Development (20)

Highway design presentation (Malyar Talash)
Highway design presentation (Malyar Talash)Highway design presentation (Malyar Talash)
Highway design presentation (Malyar Talash)
 
Civil 150 project
Civil 150 projectCivil 150 project
Civil 150 project
 
Capitulo 02 grupo 01
Capitulo 02 grupo 01Capitulo 02 grupo 01
Capitulo 02 grupo 01
 
210_MFLA_TS_TrafficReport-2.pdf
210_MFLA_TS_TrafficReport-2.pdf210_MFLA_TS_TrafficReport-2.pdf
210_MFLA_TS_TrafficReport-2.pdf
 
Tes p-122.07-r0
Tes p-122.07-r0Tes p-122.07-r0
Tes p-122.07-r0
 
Dragline Planning
Dragline PlanningDragline Planning
Dragline Planning
 
Traffic StudyProject location· Summary Traf.docx
Traffic StudyProject location· Summary Traf.docxTraffic StudyProject location· Summary Traf.docx
Traffic StudyProject location· Summary Traf.docx
 
Lbdc 081013
Lbdc 081013Lbdc 081013
Lbdc 081013
 
SANCTION DRAWING PROJECT.PDF
SANCTION DRAWING PROJECT.PDFSANCTION DRAWING PROJECT.PDF
SANCTION DRAWING PROJECT.PDF
 
Drainage design
Drainage designDrainage design
Drainage design
 
RTE Roundabout Analysis - Technical Data
RTE Roundabout Analysis - Technical DataRTE Roundabout Analysis - Technical Data
RTE Roundabout Analysis - Technical Data
 
21dj0036 plan.pdf
21dj0036 plan.pdf21dj0036 plan.pdf
21dj0036 plan.pdf
 
Design_Guidelines_and_Standard_Drawings.pdf
Design_Guidelines_and_Standard_Drawings.pdfDesign_Guidelines_and_Standard_Drawings.pdf
Design_Guidelines_and_Standard_Drawings.pdf
 
Tes p-122.08-r0
Tes p-122.08-r0Tes p-122.08-r0
Tes p-122.08-r0
 
Items # 7&8 - 309 & 317 Lamont Replat
Items # 7&8 - 309 & 317 Lamont ReplatItems # 7&8 - 309 & 317 Lamont Replat
Items # 7&8 - 309 & 317 Lamont Replat
 
2011.02rev canda larga ranch
2011.02rev canda larga ranch2011.02rev canda larga ranch
2011.02rev canda larga ranch
 
Saratoga Landscape and Lighting Districts 2016-2017
Saratoga Landscape and Lighting Districts 2016-2017Saratoga Landscape and Lighting Districts 2016-2017
Saratoga Landscape and Lighting Districts 2016-2017
 
Week Four.pdf geomagnetic.1presentation.
Week Four.pdf geomagnetic.1presentation.Week Four.pdf geomagnetic.1presentation.
Week Four.pdf geomagnetic.1presentation.
 
Route 123 and Jermantown Rd. Intersection Improvements November 2020
Route 123 and Jermantown Rd. Intersection Improvements November 2020Route 123 and Jermantown Rd. Intersection Improvements November 2020
Route 123 and Jermantown Rd. Intersection Improvements November 2020
 
Pasinaya-Townhomes-Thickened-Slab-1.pdf
Pasinaya-Townhomes-Thickened-Slab-1.pdfPasinaya-Townhomes-Thickened-Slab-1.pdf
Pasinaya-Townhomes-Thickened-Slab-1.pdf
 

land Development

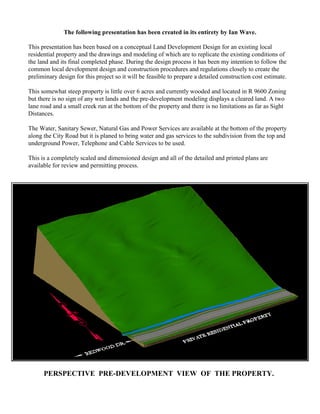
  • 1. The following presentation has been created in its entirety by Ian Wave. This presentation has been based on a conceptual Land Development Design for an existing local residential property and the drawings and modeling of which are to replicate the existing conditions of the land and its final completed phase. During the design process it has been my intention to follow the common local development design and construction procedures and regulations closely to create the preliminary design for this project so it will be feasible to prepare a detailed construction cost estimate. This somewhat steep property is little over 6 acres and currently wooded and located in R 9600 Zoning but there is no sign of any wet lands and the pre-development modeling displays a cleared land. A two lane road and a small creek run at the bottom of the property and there is no limitations as far as Sight Distances. The Water, Sanitary Sewer, Natural Gas and Power Services are available at the bottom of the property along the City Road but it is planed to bring water and gas services to the subdivision from the top and underground Power, Telephone and Cable Services to be used. This is a completely scaled and dimensioned design and all of the detailed and printed plans are available for review and permitting process. PERSPECTIVE PRE-DEVELOPMENT VIEW OF THE PROPERTY.
  • 2. This property will be accessed by a bridge over an environmentally protected creek, so the design would include a short span arched reinforced concrete bridge design, it is also planned to subdivide this property into 20 single family lots (Minimum 9600 SF. per lot) plus a Tennis Court and a Storm Drain Infiltration area. PROPERTY PRE-DEVELOPMENT CONTOUR LINES.
  • 3. The plan view displaying the whole subdivision layout which includes a private one way and a two way roads throughout the property for total accessibility. PROPOSED 20 LOTS SUBDIVISION LAYOUT.
  • 4. To provide an access onto the property the City Main Road must be studied and evaluated. By viewing the following existing road plan and its profile, it seems an access at station 3+00 by way of a Bridge over the creek would be a proper location to consider. THE CITY ROAD SUPER ELEVATED PLAN AND PROFILE VIEWS.
  • 5. The cross section view of the City Road Alignment at station 3+00 , where there will be an access road designed and built onto the subdivision from the North. CROSS SECTION VIEW OF THE CITY ROAD AT STATION 3+00. CROSS SECTION VIEWS OF THE CITY ROAD AT VARIOUS STATIONS.
  • 6. The private road alignments for desired accessibility and their transitions to the city road are established and considering the existing land contours and profiles the roads are designed. MAIN ROAD HORIZONTAL ALIGNMENT ABOUT 1200 LINEAR FEET. The following page will display the Vertical Curve of the above alignment.
  • 7.
  • 8. Also there will be another two way road T ing off the main road and coming south to serve the culdesac As the following graph displays its Vertical Curve Design. After designing the vertical curves the Cross Sections information are available and using the designed Templates the amount of necessary soil cut and fill could be calculated, please review the following samples.
  • 9. The following graphs show placement of the retaining walls by Rockery or Reinforced Concrete. CROSS SECTION VIEW OF 16 FEET WIDE PRIVATE ROAD AT STATION 1+50. CROSS SECTION VIEW OF 16 FEET WIDE PRIVATE ROAD AT STATION 2+15.
  • 10. We now can calculate the amount of soil cut and fill volumes by having the cross section information at relatively close stations, in this case every foot as is indicated in the table bellow. THE MAIN ROAD SOIL CUT AND FILL CALCULATION. The figure bellow displays the complete subdivision layout with detail information of the lots’ corner point positions, lot lines’ orientations and also corners and special points elevations with respect to our referenced survey Monument in the following page.
  • 11.
  • 12. To construct the roads, The Horizontal Curves information are also necessary as is shown in the table bellow for the main road. Horizontal Alignment Station and Curve Report. Alignment: A-2 Desc: Private RD. Desc. Station Spiral/Curve Data Northing Easting ------------------------------------------------------------------------------- ------------------------------------------------------------------------------- PI 0+00 17.33 320.17 Length: 148.90 Course: N 75-00-00 E ------------------------------------------------------------------------------- PI 1+48.90 55.87 464.00 Length: 268.62 Course: N 00-00-00 E Delta: 75-00-00 ------------------------------------------------------------------------------- Tangent Data 0+00 17.33 320.17 1+32.02 51.50 447.69 Length: 132.02 Course: N 75-00-00 E ------------------------------------------------------------------------------- Circular Curve Data PC 1+32.02 51.50 447.69 RP 72.75 442.00 PT 1+60.82 72.75 464.00 Delta: 75-00-00 Type: LEFT Radius: 22.00 DOC: 260-26-07 Length: 28.80 Tangent: 16.88 Mid-Ord: 4.55 External: 5.73 Chord: 26.79 Course: N 37-30-00 E Es: 5.73 ------------------------------------------------------------------------------- PI 4+12.56 324.48 464.00 Length: 328.00 Course: N 90-00-00 W Delta: 90-00-00 ------------------------------------------------------------------------------- Tangent Data 1+60.82 72.75 464.00 3+90.56 302.48 464.00 Length: 229.74 Course: N 00-00-00 E ------------------------------------------------------------------------------- Circular Curve Data PC 3+90.56 302.48 464.00 RP 302.48 442.00 PT 4+25.12 324.48 442.00 Delta: 90-00-00 Type: LEFT Radius: 22.00 DOC: 260-26-07 Length: 34.56 Tangent: 22.00 Mid-Ord: 6.44 External: 9.11 Chord: 31.11 Course: N 45-00-00 W Es: 9.11 ------------------------------------------------------------------------------- PI 7+31.12 324.48 136.00 Length: 257.81 Course: S 00-00-00 W Delta: 90-00-00 -------------------------------------------------------------------------------
  • 13. Tangent Data 4+25.12 324.48 442.00 7+09.12 324.48 158.00 Length: 284.00 Course: N 90-00-00 W ------------------------------------------------------------------------------- Circular Curve Data PC 7+09.12 324.48 158.00 RP 302.48 158.00 PT 7+43.67 302.48 136.00 Delta: 90-00-00 Type: LEFT Radius: 22.00 DOC: 260-26-07 Length: 34.56 Tangent: 22.00 Mid-Ord: 6.44 External: 9.11 Chord: 31.11 Course: S 45-00-00 W Es: 9.11 ------------------------------------------------------------------------------- PI 9+79.48 66.67 136.00 Length: 190.67 Course: S 75-00-00 E Delta: 75-00-00 ------------------------------------------------------------------------------- Tangent Data 7+43.67 302.48 136.00 9+62.60 83.56 136.00 Length: 218.93 Course: S 00-00-00 W ------------------------------------------------------------------------------- Circular Curve Data PC 9+62.60 83.56 136.00 RP 83.56 158.00 PT 9+91.40 62.30 152.31 Delta: 75-00-00 Type: LEFT Radius: 22.00 DOC: 260-26-07 Length: 28.80 Tangent: 16.88 Mid-Ord: 4.55 External: 5.73 Chord: 26.79 Course: S 37-30-00 E Es: 5.73 ------------------------------------------------------------------------------- PI 11+65.18 17.33 320.17 ------------------------------------------------------------------------------- Tangent Data 9+91.40 62.30 152.31 11+65.18 17.33 320.17 Length: 173.78 Course: S 75-00-00 E ______________________________________________________
  • 14. As the rough roads are established and constructed, the lots’ rough surfaces based on the designed information could also be built. The individual lots and total soil cut and fill volumes are shown in the figure bellow. This soil will be reserved for future use when the actual construction of homes will begin based on the Landscaping Designs and or the home owner’s desire for more level ground. SOIL CUT AND FILL VOLUME CALCULATION FOR THE SUBDIVISION.
  • 15. At this stage of the development The Utility Pipes and Cables could be installed , my personal preference is to first start laying down the Sanitary Sewer Pipes based on the approved plans. The following figures represent the proposed Sanitary Sewer System for this subdivision. There will be 3 Main lines called S. Sewer East, S. Sewer North and S. Sewer West which will join together at bottom of the property before connecting to the City Sewer Line.
  • 16.
  • 17.
  • 18.
  • 19.
  • 20. The Main Water Supply lines will be installed and connected to The City Main next. The following graphs represent design of the water supply system for the subdivision. There will be three main branches called Main North, Main East and Main West.
  • 21.
  • 22.
  • 23.
  • 24. The Storm Drain Pipes will be installed and connected to the Storage & Infiltration Basin at the bottom of the property next. The storage structure and pipe design will be based on the following information and methods. Graphical Peak Discharge method Given Input Data: Description ..................... East Right Side Tennis Court & Road Rainfall distribution ........... Type I Frequency ....................... 2 years Rainfall, P (24-hours) .......... 3.0000 in Drainage area ................... 0.6474 ac Runoff curve number, CN ......... 98 Time of concentration, Tc ....... 360.0000 sec Pond and Swamp Areas ............ 0.0000 % of Area Computed Results: Initial abstraction, Ia ......... 0.0408 in Ia/P ............................ 0.1000 Unit peak discharge, qu ......... 503.8369 csm/in Runoff, Q ....................... 2.7683 in Pond and swamp adjustment, Fp ... 1.0000 Peak discharge, qp .............. 1.4109 cfs Manning Pipe Calculator Given Input Data: Shape ........................... Circular Solving for ..................... Depth of Flow Diameter ........................ 0.4829 ft Flowrate ........................ 3.3039 cfs Slope ........................... 0.2000 ft/ft Manning's n ..................... 0.0090 Computed Results: Depth ........................... 0.3958 ft Area ............................ 0.1832 ft2 Wetted Area ..................... 0.1607 ft2 Wetted Perimeter ................ 1.0935 ft Perimeter ....................... 1.5172 ft Velocity ........................ 20.5616 fps Hydraulic Radius ................ 0.1469 ft Percent Full .................... 81.9629 % Full flow Flowrate .............. 3.3039 cfs Full flow velocity .............. 18.0373 fps The above Flowrate is based on Peak discharge of the East 6 lots of 0.3155 x 6 = 1.8930 cfs Plus The road and Tennis court of 1.4109 cfs. Graphical Peak Discharge method Given Input Data: Description ..................... Total Impervious Area (Tennis Court & Roads) Rainfall distribution ........... Type I Frequency ....................... 2 years Rainfall, P (24-hours) .......... 3.0000 in Drainage area ................... 1.2673 ac Runoff curve number, CN ......... 98 Time of concentration, Tc ....... 360.0000 sec Pond and Swamp Areas ............ 0.0000 % of Area Computed Results: Initial abstraction, Ia ......... 0.0408 in Ia/P ............................ 0.1000 Unit peak discharge, qu ......... 503.8369 csm/in Runoff, Q ....................... 2.7683 in Pond and swamp adjustment, Fp ... 1.0000 Peak discharge, qp .............. 2.7618 cfs
  • 25. Predevelopment Runoff: Graphical Peak Discharge method Given Input Data: Description ..................... Predevelopment Rainfall distribution ........... Type I Frequency ....................... 2 years Rainfall, P (24-hours) .......... 3.0000 in Drainage area ................... 6.3200 ac Runoff curve number, CN ......... 72 Time of concentration, Tc ....... 360.0000 sec Pond and Swamp Areas ............ 0.0000 % of Area Computed Results: Initial abstraction, Ia ......... 0.7778 in Ia/P ............................ 0.2593 Unit peak discharge, qu ......... 388.7183 csm/in Runoff, Q ....................... 0.8081 in Pond and swamp adjustment, Fp ... 1.0000 Peak discharge, qp .............. 3.1019 cfs Postdevelopment Runoff: Graphical Peak Discharge method Given Input Data: Description ..................... Lot Runoff (9600 SF) Rainfall distribution ........... Type I Frequency ....................... 2 years Rainfall, P (24-hours) .......... 3.0000 in Drainage area ................... 0.2204 ac Runoff curve number, CN ......... 88 Time of concentration, Tc ....... 360.0000 sec Pond and Swamp Areas ............ 0.0000 % of Area Computed Results: Initial abstraction, Ia ......... 0.2727 in Ia/P ............................ 0.1000 Unit peak discharge, qu ......... 503.8369 csm/in Runoff, Q ....................... 1.8182 in Pond and swamp adjustment, Fp ... 1.0000 Peak discharge, qp .............. 0.3155 cfs Graphical Peak Discharge method Given Input Data: Description ..................... Tennis Court & Road Rainfall distribution ........... Type I Frequency ....................... 2 years Rainfall, P (24-hours) .......... 3.0000 in Drainage area ................... 1.2673 ac Runoff curve number, CN ......... 98 Time of concentration, Tc ....... 360.0000 sec Pond and Swamp Areas ............ 0.0000 % of Area Computed Results: Initial abstraction, Ia ......... 0.0408 in Ia/P ............................ 0.1000 Unit peak discharge, qu ......... 503.8369 csm/in Runoff, Q ....................... 2.7683 in Pond and swamp adjustment, Fp ... 1.0000 Peak discharge, qp .............. 2.7618 cfs Total Runoff Volume Calculation V1 (Predevelopment) = Q x A = 0.81 in (275,275 SF)(1/12) = 18,580 CFT V2 (Postdevelopment) = Q1 ( A1) + Q2 (A2 ) A1 = 197,426.75SF ( Total Lot Area ) A2 = 55,203.45SF ( Private Road + Tennis Court Areas) V2 = 1.82 in ( 197,426.75 SF )(1/12) + 2.77in ( 46,203.45SF + 9,000SF )(1/12) = 42,685CFT The Design Infiltration Basin Size to store the increased storm runoff : Increased Volume = V2 - V1 (qu1/qu2) = 42,685 CFT - 18,580 Cft (388.72/503.84) =28,350 CFT=212,100 GAL.
  • 26. The following graphs display the Storm Drain Pipe Design. There will be 6 branches, 1 through 6, one on each side of the roads serving the Roads and individual lots.
  • 27.
  • 28. At this time rest of the Utility Lines must be installed as the following graph displays a Cross Section view of the Main Road and the utility lines at station 3+25.00.
  • 29. While the Utility lines are being installed the Retaining Walls for both the roads and individual lots should be built as well which requires good scheduling, organizing and management with different trades contractors just so they can accomplish their part of the assignments collectively without any interference to advance the project as planned which is very critical in Land Development Projects. After all the utility lines have been installed and extended to the individual lots and approved with respective Districts and County Officials, the trenches and retaining walls could be back filled and compacted where necessary to a required density or soil bearing capacity and rough grades could be once again reestablished. The next step is to build the Curbs, Private Roads, Sidewalks, stairways and Accesses to the individual lots and install the Utility Fixtures & Meters, Safety Elements and Hydro-Seed the entire bare land to prevent any potential erosion progressively as designed, and after the project as a whole has been fully inspected, approved and singed off , The Development is pretty much complete and The Plat could be Recorded and ready for further development which is building the Homes and Public Facilities. I like to mention that this design does not include Landscaping Design which is essential to any development and must be professionally designed and implemented but its total footage has been considered and dedicated. Based on these design criteria and information I have created 3D Modeling of the development to virtually observe the finished product and also to make it realistic for a more precise construction estimates preparation. Various Perspective Views are presented in th following pages.
  • 30. POST DEVELOPMENT SW. ISO. VIEW
  • 31. SW. LOWER SEC. CLOSE-UP VIEW
  • 32. SW UPPER SEC. CLOSE-UP VIEW
  • 33. SE. LOWER SEC. CLOSE-UP VIEW
  • 34. SE. MID. SEC. CLOSE-UP VIEW
  • 35. NE. MID. SEC. CLOSE-UP VIEW
  • 36. NS. MID. SEC. CLOSE-UP VIEW
  • 38. SE. LOWER SEC. CLOSE-UP VIEW
  • 39. SE. LOWER SEC. WITH STORM BASIN CAPPED OFF, CLOSE-UP VIEW
  • 40. SE. UPPER SEC. CLOSE-UP VIEW
  • 42. ENTRANCE TO THE SUBDIVISION CLOSE-UP VIEW
  • 49. MAPLE LN. SW. CLOSE-UP VIEW
  • 50. CULDESAC RETAINING WALL CLOSE-UP VIEW
  • 52. SW. CORNER STAIRWAY CLOSE-UP VIEW
  • 53. To take a step further in this project I designed a sample Single Family Home of about 4,000 SF. With 3 door Garage and a Pool for lot 18 of this subdivision. The following graphs display the details of this design and also the built house in various views.
  • 61. HOUSE BUILT ON LOT 18 VIEW
  • 62. HOUSE ON LOT 18 SW. VIEW
  • 63. HOUSE ON LOT 18 SE. VIEW
  • 64. HOUSE ON LOT 18 NE. VIEW
  • 65. HOUSE ON LOT 18 NW. VIEW
  • 66. WELCOME TO THE PANORAMA This Development Design is complete and all the Engineering & Architectural Details are available for further review and discussion. For more information please contact me at ianstructures@yahoo.com.