
Recommended
Recommended
More Related Content
What's hot
What's hot (20)
Similar to Monthly sept20 spx qi
Similar to Monthly sept20 spx qi (20)
Recently uploaded
Recently uploaded (20)
Monthly sept20 spx qi
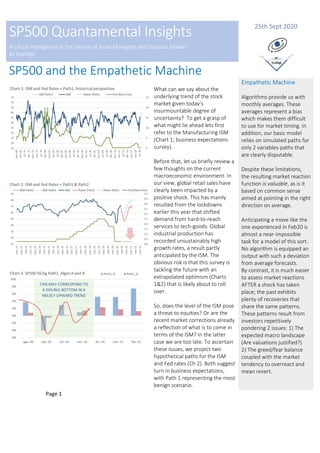
- 1. Page 1 SP500 Quantamental Insights Artificial Intelligence at the Service of Asset Managers and Decision Makers By EyeHigh 25th Sept 2020 SP500 and the Empathetic Machine What can we say about the underlying trend of the stock market given today’s insurmountable degree of uncertainty? To get a grasp of what might lie ahead lets first refer to the Manufacturing ISM (Chart 1; business expectations survey). Before that, let us briefly review a few thoughts on the current macroeconomic environment. In our view, global retail sales have clearly been impacted by a positive shock. This has mainly resulted from the lockdowns earlier this year that shifted demand from hard-to-reach services to tech-goods. Global industrial production has recorded unsustainably high growth rates, a result partly anticipated by the ISM. The obvious risk is that this survey is tackling the future with an extrapolated optimism (Charts 1&2) that is likely about to roll over. So, does the level of the ISM pose a threat to equities? Or are the recent market corrections already a reflection of what is to come in terms of the ISM? In the latter case we are too late. To ascertain these issues, we project two hypothetical paths for the ISM and Fed rates (Ch 2). Both suggest turn in business expectations, with Path 1 representing the most benign scenario. Empathetic Machine Algorithms provide us with monthly averages. These averages represent a bias which makes them difficult to use for market timing. In addition, our basic model relies on simulated paths for only 2 variables-paths that are clearly disputable. Despite these limitations, the resulting market reaction function is valuable, as is it based on common sense aimed at pointing in the right direction on average. Anticipating a move like the one experienced in Feb20 is almost a near-impossible task for a model of this sort. No algorithm is equipped an output with such a deviation from average forecasts. By contrast, it is much easier to assess market reactions AFTER a shock has taken place; the past exhibits plenty of recoveries that share the same patterns. These patterns result from investors repetitively pondering 2 issues: 1) The expected macro landscape (Are valuations justified?) 2) The greed/fear balance coupled with the market tendency to overreact and mean revert. THIS MAY CORRESPOND TO A DOUBLE BOTTOM IN A MILDLY UPWARD TREND
- 2. Page 2 SP500 Quantamental Insights Artificial Intelligence at the Service of Asset Managers and Decision Makers By EyeHigh SP500 and the Ai Empathetic Machine Given our time horizon we assume no change in rates. We suspect that the loss of growth momentum (lockdowns) and the fiscal stimulus/elections will be central for the ISM survey. The election is an exogenous variable. The result is unknown as it is the fiscal program that will be approved by the winning party. Our goal is to uncover the probability of a significant macro downturn in spite of these limitations. The algorithm will provide average “biases” (not exact forecasts) which we will interpret. These are the main conclusions of our two algorithms: 1) If the ISM were currently rolling over, algo A & B both suggest that we are immersed in a 1-2 month downside risk window. 2) Strikingly, the most severe ISM correction (Path 2) barely changes that conclusion. We suspect that this is so because in both cases the ISM gets back above 50 in a reasonably short time span (Ch 2). 3) This market hiccup would translate to double bottom within a mildly positive market trend (Charts 3 and 4). 4) The main difference between of the two paths lies in the period dic20 to feb21 (when path A reaches 60; slightly higher returns). 5) The time to buy is within the next few weeks. Empathetic Machine So, if recoveries share a lot more common features then, from a machine learning perspective, they are a convenient starting point for analysis. Now, three weeks into a correction, might well be the right time to pose these questions. For the sake of accuracy and timing we would need to drill down to a weekly data frequency. The idea would be to feed “highly emotional” data into the machine and still get reasonable readings of the underlying strength of the market. We fed the algorithm with VIX, Skew, Put/Call, and similar emotional data together with a low load of macro fundamentals. We targeted cycles of 8 weeks into the future and allow the machine some freedom (not much) to choose a suitable mix to respond. Our empathetic machine “feels” (Chart 5) that the fear/greed balance will be tilted towards fear for another 2-3 weeks. This, then, is the opportunity window if we are to build a long position in equities. Chart 5: Empathetic Machine Underlying Strength
- 3. DISCLAIMER: This document does not constitute an offer or a solicitation to engage in any trading strategy or to purchase or sell any financial instruments. Given its general nature, the information included in this document does not contain all the elements that may be relevant for a recipient to make an informed decision in relation to any strategies or financial instruments discussed herein. The information and opinions contained in this document have been obtained from sources believed to be reliable, but we make no representation, express or implied, that such information and opinions are accurate or complete. Other financial institutions or persons may have different opinions or draw different conclusions from the same facts or ideas analyzed in this document. Any scenarios, assumptions, historical or simulated performances, indicative prices or examples of potential transactions or returns are included for illustrative purposes only, and we give no assurance that any favorable scenarios described are likely to happen, nor that it is possible to trade on the terms described herein or that any of the potential returns illustrated can be achieved. We have used historical information in order to provide an illustration of how certain parameters may have performed over a defined period. This document also contains certain performance data based on back-testing, i.e., calculations of the hypothetical performance of a strategy, index or asset as if it had actually existed during a defined period of time and may in certain circumstances contain simulated performance information where the index or asset described has recently been established or issued. The scenarios, simulations, development expectations and forecasts contained in this document are for illustrative purposes only. This type of information has inherent limitations which you must consider carefully. While the information has been prepared in good faith in accordance with our own internal models and other relevant sources, an analysis based on different models or assumptions may yield different results. Therefore, this analysis may vary significantly from an analysis obtained from other sources or market participants. Further, please note that such analysis is based on a number of working assumptions that may not be capable of duplication in actual trading terms. Unlike actual performance records, hypothetical or simulated performances, returns or scenarios may not necessarily reflect certain market factors such as liquidity constraints, fees and transaction costs. Actual historical or backtested past performance does not constitute an indication of future results. In providing this document, we give no financial, legal, tax or any other type of advice to recipients. Certain strategies and/or potential transactions discussed in this document involve the use of derivatives, which may be complex in nature and may give rise to substantial risk, including the risk of partial or total loss of any investment. We make no representation as to whether any of the strategies discussed herein may be suitable for investors’ financial needs, circumstances or requirements. Investors must make their own assessment of the strategies and/or potential transactions, using such professional advisors as they make require. We accept no liability for any direct or consequential losses arising from any action taken in connection with the information contained in this document.