
Recommended
Recommended
More Related Content
What's hot
What's hot (19)
Similar to Monthly may20 spx qi
Similar to Monthly may20 spx qi (20)
Recently uploaded
Recently uploaded (20)
Monthly may20 spx qi
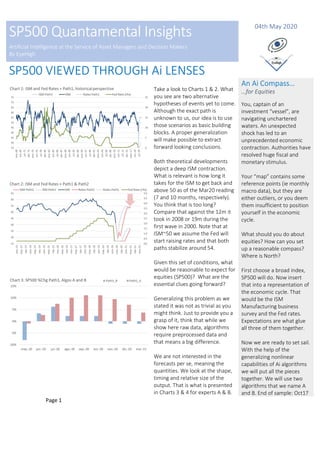
- 1. Page 1 SP500 Quantamental Insights Artificial Intelligence at the Service of Asset Managers and Decision Makers By EyeHigh 04th May 2020 SP500 VIEWED THROUGH Ai LENSES Take a look to Charts 1 & 2. What you see are two alternative hypotheses of events yet to come. Although the exact path is unknown to us, our idea is to use those scenarios as basic building blocks. A proper generalization will make possible to extract forward looking conclusions. Both theoretical developments depict a deep ISM contraction. What is relevant is how long it takes for the ISM to get back and above 50 as of the Mar20 reading (7 and 10 months, respectively). You think that is too long? Compare that against the 12m it took in 2008 or 19m during the first wave in 2000. Note that at ISM~50 we assume the Fed will start raising rates and that both paths stabilize around 54. Given this set of conditions, what would be reasonable to expect for equities (SP500)? What are the essential clues going forward? Generalizing this problem as we stated it was not as trivial as you might think. Just to provide you a grasp of it, think that while we show here raw data, algorithms require preprocessed data and that means a big difference. We are not interested in the forecasts per se, meaning the quantities. We look at the shape, timing and relative size of the output. That is what is presented in Charts 3 & 4 for experts A & B. An Ai Compass… …for Equities You, captain of an investment “vessel”, are navigating unchartered waters. An unexpected shock has led to an unprecedented economic contraction. Authorities have resolved huge fiscal and monetary stimulus. Your “map” contains some reference points (ie monthly macro data), but they are either outliers, or you deem them insufficient to position yourself in the economic cycle. What should you do about equities? How can you set up a reasonable compass? Where is North? First choose a broad index, SP500 will do. Now insert that into a representation of the economic cycle. That would be the ISM Manufacturing business survey and the Fed rates. Expectations are what glue all three of them together. Now we are ready to set sail. With the help of the generalizing nonlinear capabilities of Ai algorithms we will put all the pieces together. We will use two algorithms that we name A and B. End of sample: Oct17
- 2. Page 2 SP500 Quantamental Insights Artificial Intelligence at the Service of Asset Managers and Decision Makers By EyeHigh SP500 VIEWED THROUGH Ai LENSES These are the main takeaways: 1) A & B do not think the same!! A is more optimistic, but as we said before we will focus on relative size of forecasted returns. 2) The longer it takes the ISM to get above 50, the more the downside risk. 3) The market will resume its upward trend way before the ISM reaches 50. And it is not proportional. In Path2 it takes 3 more months for the ISM to reach 50, but it only translates into 1 additional month of downside risk. 4) Our expert’s opinions part ways once ISM = 50. This provides reassurance for the first few periods but implies more uncertainty there on. 5) Despite that higher degree of uncertainty, downside risk diminishes dramatically once ISM gets above 50. 6) The SP500 might not return to march’s lows, but still there is scope for more corrections. 7) Corrections in Path2 are subsequently recovered faster later. If you are short and you wait for ISM improvements to get long you will be increasingly pressed for time. This signals a potential upwards move a bit by surprise while chaos stills prevails in data. 8) Once above 50, a stagnant ISM entails a weakening SP500 trend. 9) Our designed path for Fed interest rate increases are have a neutral or positive (ie not negative) effect in the SP500. MACRO SCENARIO But how credible is any of our ISM future alternatives? The current macro environment has not been caused by the COVID19, but by human decisions. We have full knowledge of the underlying macro factor, but no way to play it. We do not know what politicians are thinking. Their reaction functions are a mystery to us. We will ask this question to our expert. Given the current macro information available, what would be the predominant force in the ISM for the coming months? Chart 5 shows that there is underlying negative strength (<0.5) for the ISM for at least 4 more months. Brace for Path1 but remain open to Path2. This implies we have not seen the ISM low yet. Also, a clear upward trend will take time to settle and will probably not be a straight line. An unexpected tweet, drug, vaccine or political decision may render our forecast useless. All of these are in fact upside risks. MORE DOWNSIDE RISK
- 3. DISCLAIMER: This document does not constitute an offer or a solicitation to engage in any trading strategy or to purchase or sell any financial instruments. Given its general nature, the information included in this document does not contain all the elements that may be relevant for a recipient to make an informed decision in relation to any strategies or financial instruments discussed herein. The information and opinions contained in this document have been obtained from sources believed to be reliable, but we make no representation, express or implied, that such information and opinions are accurate or complete. Other financial institutions or persons may have different opinions or draw different conclusions from the same facts or ideas analyzed in this document. Any scenarios, assumptions, historical or simulated performances, indicative prices or examples of potential transactions or returns are included for illustrative purposes only, and we give no assurance that any favorable scenarios described are likely to happen, nor that it is possible to trade on the terms described herein or that any of the potential returns illustrated can be achieved. We have used historical information in order to provide an illustration of how certain parameters may have performed over a defined period. This document also contains certain performance data based on back-testing, i.e., calculations of the hypothetical performance of a strategy, index or asset as if it had actually existed during a defined period of time and may in certain circumstances contain simulated performance information where the index or asset described has recently been established or issued. The scenarios, simulations, development expectations and forecasts contained in this document are for illustrative purposes only. This type of information has inherent limitations which you must consider carefully. While the information has been prepared in good faith in accordance with our own internal models and other relevant sources, an analysis based on different models or assumptions may yield different results. Therefore, this analysis may vary significantly from an analysis obtained from other sources or market participants. Further, please note that such analysis is based on a number of working assumptions that may not be capable of duplication in actual trading terms. Unlike actual performance records, hypothetical or simulated performances, returns or scenarios may not necessarily reflect certain market factors such as liquidity constraints, fees and transaction costs. Actual historical or backtested past performance does not constitute an indication of future results. In providing this document, we give no financial, legal, tax or any other type of advice to recipients. Certain strategies and/or potential transactions discussed in this document involve the use of derivatives, which may be complex in nature and may give rise to substantial risk, including the risk of partial or total loss of any investment. We make no representation as to whether any of the strategies discussed herein may be suitable for investors’ financial needs, circumstances or requirements. Investors must make their own assessment of the strategies and/or potential transactions, using such professional advisors as they make require. We accept no liability for any direct or consequential losses arising from any action taken in connection with the information contained in this document.