SlideShare a Scribd company logo
1 of 1
RESEARCH POSTER PRESENTATION DESIGN © 2012
www.PosterPresentations.com
This study investigates the role of learner-generated
representations (drawing) while trying to learn from a biology
text. Participants were asked to draw figures while reading ten
passages about the cardiovascular system. A coding scheme was
developed to analyze two drawings (corresponding two passages)
from each participant, to measure aspects of content and meta-
representation. Preliminary analyses reveal correlations between
post-test scores and 1) the number of images and labels that
participants generate 2) the number of inaccurate representations
that participants generate, and 3) whether or not participants used
a legend in their drawing. We hope future analyses will provide
students with guidelines for drawing while learning from text to
improve understanding.
Abstract(
The coding schematic used for this project included content
“knowledge elements” and “meta-representational aspects.” Due to
time constraints, our analysis only covers passage 3 of the data, which
details the valve system in the heart and the overall process of
oxygenation/deoxygenation in the body.
Knowledge Elements
Knowledge elements were coded on a 0-1 (not present/present)
scale, based on 3 categories:
Meta-Representational Aspects:
Also coded on a 0-1 scale (not present/present). Categories
included: anthropomorphism, metaphor, mneumonic devices, image
and organizational abstraction and more; however, many of these
aspects did not appear in drawings for passage 3. Therefore, for the
purposes of this poster, we are only focusing on legend.
Analyses(
The following tables show correlations between gain and
retention scores and the number of labels, images, and errors
students made, and whether or not they included a legend in their
drawings. Assessment responses were divided into understanding of
the structures within the cardiovascular system, pathway that blood
takes through the system, and function of structures as components
of the system.
Findings(
•  Between groups: Participants in the Drawing Group tended to
include more information (i.e. labels and images) and legends in
their drawings while studying. We hypothesize that this
difference exists because participants participants in the
Combined Group, who self-explain before they draw, may think
it unnecessary to reiterate information that they have already said
aloud.
•  Drawing and learning: Overall, participants (regardless of
condition) who drew more information and used a legend while
studying tended to learn more about structures in the
cardiovascular system. This might be because drawing focuses on
discrete pieces of the system, which is instrumental in learning
about structure. Whereas, those who drew less (perhaps because
they also self-explained) did not learn as much about structure
because self-explanation may focus more on how elements work
together in the system.
•  Retention: These correlations, however, do not exist for
measurements of Retention; therefore, drawing may not be as
beneficial for long-term memory as self-explanation. This might
be because some of the short-term learning attributed to drawing
was related to motor memory, and without practice over the two
weeks between the post-test and delayed-test, those who only
drew while studying did retained relatively less of the
information. Additionally, we hypothesize that the additional self-
explanation of the combined group, may have facilitated drawing
connections to previous knowledge, which would help with
retention of the information.
This study, conducted as a part of a larger research project,
examines the drawings of participants during an independent study
session where they are asked to either draw, or self-explain and then
draw as they read from a text about the cardiovascular system.
As seen above, students were…
•  Given a Pre-Test (to measure prior knowledge)
•  Assigned a condition—either the “Drawing” group or the
“Combined” group—and trained according to the respective
learning strategies they were assigned
•  Completed an independent study session where they (self-explained
and) drew diagrams for each of 11 passages they read about the
cardiovascular system
•  Given a Post-Test (to measure short-term learning)
•  Given a Delayed Test and Figure Interpretation Test (to measure
long-term learning/retention)
Elizabeth Sabiniano, Echo Lu, Diane P. Lam
Hypotheses for How Drawing as a Study Strategy May Impact Learning from Text
The legend in example above explains that red represents
oxygenated blood and blue represents oxygenated blood.
Examples:
Example of Drawings of Passage 3
GAIN(by(QuesBon(Type
Structure Pathway Func/on
Label 0.36* 0.19 0.06
Image 0.29* 0.28* 0.33*
Error L0.46* L0.14 L0.18
Legend 0.19 0.25 0.15
This study shows that drawing is beneficial for understanding
structure but learners who focus solely on drawing retain less
information in the long-term. Self-explanation, on the other hand,
is shown to be more beneficial for long-term retention of
information about function, but not of structure or pathways.
Perhaps, if the training process for the Combined Group were
improved, the benefits of the short-term learning gains seen in the
Drawing Group could be optimized, without losing the long-term
retention associated with self-explaining. In other words, students
could self-explain, and draw with an emphasis on using labels,
images, and legends. A combination of these learning strategies is
likely to maximize learning.
•  Label:&Words&used&to&describe&or&iden/fy&a&knowledge&element.&
Labels&for&processes,&such&as&diffusion,&only&count&when&verbs&or&
preposi/ons&are&included.&
•  Image:&A&realis/c&or&geometric&representa/on&of&a&knowledge&
element&(including&processes,&organs,&arrows&indica/ng&flow&
•  Error:&Incorrectly&placed&or&defined&label&or&image&&
Methods(
Discussion(
Conclusion(
!"
#"
$"
%"
&"
'!"
'#"
'$"
'%"
'&"
()*+," -.)/+" 0+1"
!"#$%$&'$()"&)*++,-$.)/%01"&2()
23)4"
56.*78+9"
!"##$
%"&'$
!"()$
#"%&$
%"&%$
!"*#$
("($
("+$
%"($
%"+$
#"($
#"+$
!"($
!"+$
*"($
!"#$%"$#&' ()"*+),' -$.%/0.'
122&223&."'4)5.2''
678&./%)9':$&2/0.2';#03'(#&'"0'(02"'"&2"<'
$,$
,$-.("(+$
!"#$%
!&#'%
!&#$%
!$#'%
$#$%
$#'%
&#$%
!"#$%"$#&' ()"*+),' -$.%/0.'
122&223&."'4&"&./0.''
5166'7$&2/0.2'8#03'(02"'"0'9&6),&:;'
!"#$%
!"&'%
!%
!"&%
!"(%
!"$%
!"#%
!")%
!"*%
+,-,./%
!"#$%#&'()*+),-#)*+).)/#0#&1)
!"#$%
&$"!'%
#"()%
&*"&+%
,%
*%
$%
'%
)%
&,%
&*%
&$%
&'%
&)%
-./01% 23.40%
!"#$%&#'()*+#$',-'./*#0'%'1%$23/4%56'7538)9#9'%':%+#8',$'7*%&#'
The results of this study suggest that the Drawing Group
tended to include more labels and images than the Combined
Group, and they also showed higher performance on the Post-
Tests. This may suggest that drawing is more beneficial for short-
term understanding of structure than a combination
of drawing and self-explanation.
Though this study has yielded many interesting correlations, it
was only based on a portion of the data that we have collected. It
would be instrumental to analyze other passages in the booklets to
see if the same patterns persist. Furthermore, many of the meta-
representational aspects that were analyzed, were also not
commonly used in passage 3; hence, we were unable to accurately
measure their influence on a participant’s learning. We anticipate
that meta-representational knowledge is likely to effect learning and
retention.
Future(DirecBons(
•  Biology educational research on external representations has had
a heavy focus on learners interpreting figures created by a more
knowledgeable person (e.g. Bowen & Roth, 2002; Kindfield &
Singer-Gabella, 2010)
•  While interpreting and generating representations are equally
important to learning biology, research on learners generating
their own representations for learning has been less prominent
(e.g. Cox & Brna, 1995; Parnafes, 2012)
•  A few studies have shown that drawing can be more beneficial for
learning compared to reading or summarizing (Gobert & Clement,
1999; Van Meter 2001).
•  This study investigates how drawing may influence learning by
examining what learners draw and how their different types of
drawings may influence their learning.
IntroducBon(
RETENTION(by(QuesBon(Type
Structure Pathway Func/on
Label L0.20& 0.07& L0.18&
Image 0.00& L0.07& L0.16&
Error L0.13& 0.00& L0.05&
Legend L0.26& L0.14& L0.22&
3. Error: AV valves
incorrectly placed,
oxygenated blood loop
incorrect
2. Image: Lungs
1. Label: “Tricuspid valve”
#3982&
#3982&
*&p<0.05&
Based on correlational analyses, we found weak to moderate
relationships between the types of information participants were
including in their drawings and their improvement on certain types
of assessment questions from pre- to post-test. Including more
images in their representations of passage 3 may influence
understanding across all three types of understanding, while labels
help mainly with understanding of structures within the system.
We found no significant relationship between drawings and
retention.
This research is partially supported by the National Science
Foundation Graduate Research Fellowship Program
University of California, Berkeley
#3603&
#9704& #6784&
#0065&
#0151&
#8646&

More Related Content

What's hot

Quantitative data analysis - John Richardson
Quantitative data analysis - John RichardsonQuantitative data analysis - John Richardson
Quantitative data analysis - John RichardsonOUmethods
 
18533 chapter3
18533 chapter318533 chapter3
18533 chapter3Mayra
 
Query based summarization
Query based summarizationQuery based summarization
Query based summarizationdamom77
 
Quantitative data analysis - Attitudes Towards Research
Quantitative data analysis - Attitudes Towards ResearchQuantitative data analysis - Attitudes Towards Research
Quantitative data analysis - Attitudes Towards ResearchLee Cox
 
Probability Theory and Mathematical Statistics in Tver State University
Probability Theory and Mathematical Statistics in Tver State UniversityProbability Theory and Mathematical Statistics in Tver State University
Probability Theory and Mathematical Statistics in Tver State Universitymetamath
 
Ib 09 River Holford
Ib 09 River HolfordIb 09 River Holford
Ib 09 River Holfordtudorgeog
 
Probability Theory and Mathematical Statistics
Probability Theory and Mathematical StatisticsProbability Theory and Mathematical Statistics
Probability Theory and Mathematical Statisticsmetamath
 
Statistics for Data Analytics
Statistics for Data AnalyticsStatistics for Data Analytics
Statistics for Data AnalyticsSSaudia
 
Analysing qualitative data from information organizations
Analysing qualitative data from information organizationsAnalysing qualitative data from information organizations
Analysing qualitative data from information organizationsAleeza Ahmad
 
Topic interpretation of data and its analysis
Topic   interpretation of data and its analysisTopic   interpretation of data and its analysis
Topic interpretation of data and its analysisKmTriptiSingh
 
Technological persuasive pedagogy a new way to persuade students in the compu...
Technological persuasive pedagogy a new way to persuade students in the compu...Technological persuasive pedagogy a new way to persuade students in the compu...
Technological persuasive pedagogy a new way to persuade students in the compu...Alexander Decker
 
Revision checklist for igcse geography
Revision checklist for igcse geographyRevision checklist for igcse geography
Revision checklist for igcse geographyMoses Lutta
 
A Term Paper for the Course of Theories and Approaches in Language Teaching(...
A Term Paper for  the Course of Theories and Approaches in Language Teaching(...A Term Paper for  the Course of Theories and Approaches in Language Teaching(...
A Term Paper for the Course of Theories and Approaches in Language Teaching(...DawitDibekulu
 

What's hot (17)

Quantitative data analysis - John Richardson
Quantitative data analysis - John RichardsonQuantitative data analysis - John Richardson
Quantitative data analysis - John Richardson
 
Qualitative data analysis
Qualitative data analysisQualitative data analysis
Qualitative data analysis
 
18533 chapter3
18533 chapter318533 chapter3
18533 chapter3
 
Fd33935939
Fd33935939Fd33935939
Fd33935939
 
Query based summarization
Query based summarizationQuery based summarization
Query based summarization
 
Quantitative data analysis - Attitudes Towards Research
Quantitative data analysis - Attitudes Towards ResearchQuantitative data analysis - Attitudes Towards Research
Quantitative data analysis - Attitudes Towards Research
 
Probability Theory and Mathematical Statistics in Tver State University
Probability Theory and Mathematical Statistics in Tver State UniversityProbability Theory and Mathematical Statistics in Tver State University
Probability Theory and Mathematical Statistics in Tver State University
 
Ib 09 River Holford
Ib 09 River HolfordIb 09 River Holford
Ib 09 River Holford
 
Probability Theory and Mathematical Statistics
Probability Theory and Mathematical StatisticsProbability Theory and Mathematical Statistics
Probability Theory and Mathematical Statistics
 
Statistics for Data Analytics
Statistics for Data AnalyticsStatistics for Data Analytics
Statistics for Data Analytics
 
Analysing qualitative data from information organizations
Analysing qualitative data from information organizationsAnalysing qualitative data from information organizations
Analysing qualitative data from information organizations
 
Topic interpretation of data and its analysis
Topic   interpretation of data and its analysisTopic   interpretation of data and its analysis
Topic interpretation of data and its analysis
 
Technological persuasive pedagogy a new way to persuade students in the compu...
Technological persuasive pedagogy a new way to persuade students in the compu...Technological persuasive pedagogy a new way to persuade students in the compu...
Technological persuasive pedagogy a new way to persuade students in the compu...
 
Independent Study Guide
Independent Study GuideIndependent Study Guide
Independent Study Guide
 
Revision checklist for igcse geography
Revision checklist for igcse geographyRevision checklist for igcse geography
Revision checklist for igcse geography
 
A Term Paper for the Course of Theories and Approaches in Language Teaching(...
A Term Paper for  the Course of Theories and Approaches in Language Teaching(...A Term Paper for  the Course of Theories and Approaches in Language Teaching(...
A Term Paper for the Course of Theories and Approaches in Language Teaching(...
 
Qualitative data analysis
Qualitative data analysisQualitative data analysis
Qualitative data analysis
 

Similar to Hypotheses for How Drawing as a Study Strategy May Impact Learning from Text

Practical Research 2, MELCS - Slides ppt (CS_RS12-If-j-6).pptx
Practical Research 2, MELCS - Slides ppt (CS_RS12-If-j-6).pptxPractical Research 2, MELCS - Slides ppt (CS_RS12-If-j-6).pptx
Practical Research 2, MELCS - Slides ppt (CS_RS12-If-j-6).pptxTristanBabaylan1
 
Research Writing Methodology
Research Writing MethodologyResearch Writing Methodology
Research Writing MethodologyAiden Yeh
 
ContentUsability_TechnologySupportedLearning
ContentUsability_TechnologySupportedLearningContentUsability_TechnologySupportedLearning
ContentUsability_TechnologySupportedLearningNivedita Singh
 
Assessing Complex Problem Solving Performances
Assessing Complex Problem Solving PerformancesAssessing Complex Problem Solving Performances
Assessing Complex Problem Solving PerformancesRenee Lewis
 
Jurnal utama tentang media
Jurnal utama tentang mediaJurnal utama tentang media
Jurnal utama tentang mediaNining Ningsih
 
Jurnal utama tentang media
Jurnal utama tentang mediaJurnal utama tentang media
Jurnal utama tentang mediaNining Ningsih
 
The World Testifies Of Data And Our Understanding Of It Essay
The World Testifies Of Data And Our Understanding Of It EssayThe World Testifies Of Data And Our Understanding Of It Essay
The World Testifies Of Data And Our Understanding Of It EssaySandy Harwell
 
Resaerch-design-Presentation-MTTE-1st-sem-2023.pptx
Resaerch-design-Presentation-MTTE-1st-sem-2023.pptxResaerch-design-Presentation-MTTE-1st-sem-2023.pptx
Resaerch-design-Presentation-MTTE-1st-sem-2023.pptxJanVincentFuentes
 
Parts of research paper
Parts of research paperParts of research paper
Parts of research paperAllanAdem
 
14. Students Difficulties In Practicing Computer-Supported Data Analysis So...
14. Students  Difficulties In Practicing Computer-Supported Data Analysis  So...14. Students  Difficulties In Practicing Computer-Supported Data Analysis  So...
14. Students Difficulties In Practicing Computer-Supported Data Analysis So...Carrie Tran
 
ActionResearch - Strategies FOR PRACTICE.pptx
ActionResearch - Strategies FOR PRACTICE.pptxActionResearch - Strategies FOR PRACTICE.pptx
ActionResearch - Strategies FOR PRACTICE.pptx300272
 
Improving Communication about Limit Concept in Mathematics through Inquisitio...
Improving Communication about Limit Concept in Mathematics through Inquisitio...Improving Communication about Limit Concept in Mathematics through Inquisitio...
Improving Communication about Limit Concept in Mathematics through Inquisitio...IOSR Journals
 
Running Head DESCRIPTIVE STATISTICS COMPUTING .docx
Running Head DESCRIPTIVE STATISTICS COMPUTING                    .docxRunning Head DESCRIPTIVE STATISTICS COMPUTING                    .docx
Running Head DESCRIPTIVE STATISTICS COMPUTING .docxtodd271
 
Vis Symposium 7 29
Vis Symposium 7 29Vis Symposium 7 29
Vis Symposium 7 29jishen
 
The Comparison and Contrast Block Comparison Essay TemplateThe B.docx
The Comparison and Contrast Block Comparison Essay TemplateThe B.docxThe Comparison and Contrast Block Comparison Essay TemplateThe B.docx
The Comparison and Contrast Block Comparison Essay TemplateThe B.docxrtodd643
 
Rd1 r17a19 datawarehousing and mining_cap617t_cap617
Rd1 r17a19 datawarehousing and mining_cap617t_cap617Rd1 r17a19 datawarehousing and mining_cap617t_cap617
Rd1 r17a19 datawarehousing and mining_cap617t_cap617Ravi Kumar
 
Log Vis All 0729
Log Vis All 0729Log Vis All 0729
Log Vis All 0729hsinyichang
 

Similar to Hypotheses for How Drawing as a Study Strategy May Impact Learning from Text (20)

Practical Research 2, MELCS - Slides ppt (CS_RS12-If-j-6).pptx
Practical Research 2, MELCS - Slides ppt (CS_RS12-If-j-6).pptxPractical Research 2, MELCS - Slides ppt (CS_RS12-If-j-6).pptx
Practical Research 2, MELCS - Slides ppt (CS_RS12-If-j-6).pptx
 
ICTERI-2021-seidametova.pdf
ICTERI-2021-seidametova.pdfICTERI-2021-seidametova.pdf
ICTERI-2021-seidametova.pdf
 
Research Writing Methodology
Research Writing MethodologyResearch Writing Methodology
Research Writing Methodology
 
ContentUsability_TechnologySupportedLearning
ContentUsability_TechnologySupportedLearningContentUsability_TechnologySupportedLearning
ContentUsability_TechnologySupportedLearning
 
Assessing Complex Problem Solving Performances
Assessing Complex Problem Solving PerformancesAssessing Complex Problem Solving Performances
Assessing Complex Problem Solving Performances
 
Jurnal utama tentang media
Jurnal utama tentang mediaJurnal utama tentang media
Jurnal utama tentang media
 
Jurnal utama tentang media
Jurnal utama tentang mediaJurnal utama tentang media
Jurnal utama tentang media
 
The World Testifies Of Data And Our Understanding Of It Essay
The World Testifies Of Data And Our Understanding Of It EssayThe World Testifies Of Data And Our Understanding Of It Essay
The World Testifies Of Data And Our Understanding Of It Essay
 
Resaerch-design-Presentation-MTTE-1st-sem-2023.pptx
Resaerch-design-Presentation-MTTE-1st-sem-2023.pptxResaerch-design-Presentation-MTTE-1st-sem-2023.pptx
Resaerch-design-Presentation-MTTE-1st-sem-2023.pptx
 
Parts of research paper
Parts of research paperParts of research paper
Parts of research paper
 
14. Students Difficulties In Practicing Computer-Supported Data Analysis So...
14. Students  Difficulties In Practicing Computer-Supported Data Analysis  So...14. Students  Difficulties In Practicing Computer-Supported Data Analysis  So...
14. Students Difficulties In Practicing Computer-Supported Data Analysis So...
 
“Discovery with Models”
“Discovery with Models”“Discovery with Models”
“Discovery with Models”
 
ActionResearch - Strategies FOR PRACTICE.pptx
ActionResearch - Strategies FOR PRACTICE.pptxActionResearch - Strategies FOR PRACTICE.pptx
ActionResearch - Strategies FOR PRACTICE.pptx
 
Improving Communication about Limit Concept in Mathematics through Inquisitio...
Improving Communication about Limit Concept in Mathematics through Inquisitio...Improving Communication about Limit Concept in Mathematics through Inquisitio...
Improving Communication about Limit Concept in Mathematics through Inquisitio...
 
B0610506
B0610506B0610506
B0610506
 
Running Head DESCRIPTIVE STATISTICS COMPUTING .docx
Running Head DESCRIPTIVE STATISTICS COMPUTING                    .docxRunning Head DESCRIPTIVE STATISTICS COMPUTING                    .docx
Running Head DESCRIPTIVE STATISTICS COMPUTING .docx
 
Vis Symposium 7 29
Vis Symposium 7 29Vis Symposium 7 29
Vis Symposium 7 29
 
The Comparison and Contrast Block Comparison Essay TemplateThe B.docx
The Comparison and Contrast Block Comparison Essay TemplateThe B.docxThe Comparison and Contrast Block Comparison Essay TemplateThe B.docx
The Comparison and Contrast Block Comparison Essay TemplateThe B.docx
 
Rd1 r17a19 datawarehousing and mining_cap617t_cap617
Rd1 r17a19 datawarehousing and mining_cap617t_cap617Rd1 r17a19 datawarehousing and mining_cap617t_cap617
Rd1 r17a19 datawarehousing and mining_cap617t_cap617
 
Log Vis All 0729
Log Vis All 0729Log Vis All 0729
Log Vis All 0729
 

Recently uploaded

This PowerPoint helps students to consider the concept of infinity.
This PowerPoint helps students to consider the concept of infinity.This PowerPoint helps students to consider the concept of infinity.
This PowerPoint helps students to consider the concept of infinity.christianmathematics
 
Sociology 101 Demonstration of Learning Exhibit
Sociology 101 Demonstration of Learning ExhibitSociology 101 Demonstration of Learning Exhibit
Sociology 101 Demonstration of Learning Exhibitjbellavia9
 
Application orientated numerical on hev.ppt
Application orientated numerical on hev.pptApplication orientated numerical on hev.ppt
Application orientated numerical on hev.pptRamjanShidvankar
 
SOC 101 Demonstration of Learning Presentation
SOC 101 Demonstration of Learning PresentationSOC 101 Demonstration of Learning Presentation
SOC 101 Demonstration of Learning Presentationcamerronhm
 
Spellings Wk 3 English CAPS CARES Please Practise
Spellings Wk 3 English CAPS CARES Please PractiseSpellings Wk 3 English CAPS CARES Please Practise
Spellings Wk 3 English CAPS CARES Please PractiseAnaAcapella
 
PROCESS RECORDING FORMAT.docx
PROCESS      RECORDING        FORMAT.docxPROCESS      RECORDING        FORMAT.docx
PROCESS RECORDING FORMAT.docxPoojaSen20
 
Magic bus Group work1and 2 (Team 3).pptx
Magic bus Group work1and 2 (Team 3).pptxMagic bus Group work1and 2 (Team 3).pptx
Magic bus Group work1and 2 (Team 3).pptxdhanalakshmis0310
 
microwave assisted reaction. General introduction
microwave assisted reaction. General introductionmicrowave assisted reaction. General introduction
microwave assisted reaction. General introductionMaksud Ahmed
 
Third Battle of Panipat detailed notes.pptx
Third Battle of Panipat detailed notes.pptxThird Battle of Panipat detailed notes.pptx
Third Battle of Panipat detailed notes.pptxAmita Gupta
 
How to Manage Global Discount in Odoo 17 POS
How to Manage Global Discount in Odoo 17 POSHow to Manage Global Discount in Odoo 17 POS
How to Manage Global Discount in Odoo 17 POSCeline George
 
Kodo Millet PPT made by Ghanshyam bairwa college of Agriculture kumher bhara...
Kodo Millet  PPT made by Ghanshyam bairwa college of Agriculture kumher bhara...Kodo Millet  PPT made by Ghanshyam bairwa college of Agriculture kumher bhara...
Kodo Millet PPT made by Ghanshyam bairwa college of Agriculture kumher bhara...pradhanghanshyam7136
 
Unit-IV- Pharma. Marketing Channels.pptx
Unit-IV- Pharma. Marketing Channels.pptxUnit-IV- Pharma. Marketing Channels.pptx
Unit-IV- Pharma. Marketing Channels.pptxVishalSingh1417
 
Unit-V; Pricing (Pharma Marketing Management).pptx
Unit-V; Pricing (Pharma Marketing Management).pptxUnit-V; Pricing (Pharma Marketing Management).pptx
Unit-V; Pricing (Pharma Marketing Management).pptxVishalSingh1417
 
Dyslexia AI Workshop for Slideshare.pptx
Dyslexia AI Workshop for Slideshare.pptxDyslexia AI Workshop for Slideshare.pptx
Dyslexia AI Workshop for Slideshare.pptxcallscotland1987
 
Making communications land - Are they received and understood as intended? we...
Making communications land - Are they received and understood as intended? we...Making communications land - Are they received and understood as intended? we...
Making communications land - Are they received and understood as intended? we...Association for Project Management
 
Introduction to Nonprofit Accounting: The Basics
Introduction to Nonprofit Accounting: The BasicsIntroduction to Nonprofit Accounting: The Basics
Introduction to Nonprofit Accounting: The BasicsTechSoup
 
Holdier Curriculum Vitae (April 2024).pdf
Holdier Curriculum Vitae (April 2024).pdfHoldier Curriculum Vitae (April 2024).pdf
Holdier Curriculum Vitae (April 2024).pdfagholdier
 
Russian Escort Service in Delhi 11k Hotel Foreigner Russian Call Girls in Delhi
Russian Escort Service in Delhi 11k Hotel Foreigner Russian Call Girls in DelhiRussian Escort Service in Delhi 11k Hotel Foreigner Russian Call Girls in Delhi
Russian Escort Service in Delhi 11k Hotel Foreigner Russian Call Girls in Delhikauryashika82
 

Recently uploaded (20)

This PowerPoint helps students to consider the concept of infinity.
This PowerPoint helps students to consider the concept of infinity.This PowerPoint helps students to consider the concept of infinity.
This PowerPoint helps students to consider the concept of infinity.
 
Sociology 101 Demonstration of Learning Exhibit
Sociology 101 Demonstration of Learning ExhibitSociology 101 Demonstration of Learning Exhibit
Sociology 101 Demonstration of Learning Exhibit
 
Application orientated numerical on hev.ppt
Application orientated numerical on hev.pptApplication orientated numerical on hev.ppt
Application orientated numerical on hev.ppt
 
SOC 101 Demonstration of Learning Presentation
SOC 101 Demonstration of Learning PresentationSOC 101 Demonstration of Learning Presentation
SOC 101 Demonstration of Learning Presentation
 
Spellings Wk 3 English CAPS CARES Please Practise
Spellings Wk 3 English CAPS CARES Please PractiseSpellings Wk 3 English CAPS CARES Please Practise
Spellings Wk 3 English CAPS CARES Please Practise
 
PROCESS RECORDING FORMAT.docx
PROCESS      RECORDING        FORMAT.docxPROCESS      RECORDING        FORMAT.docx
PROCESS RECORDING FORMAT.docx
 
Magic bus Group work1and 2 (Team 3).pptx
Magic bus Group work1and 2 (Team 3).pptxMagic bus Group work1and 2 (Team 3).pptx
Magic bus Group work1and 2 (Team 3).pptx
 
microwave assisted reaction. General introduction
microwave assisted reaction. General introductionmicrowave assisted reaction. General introduction
microwave assisted reaction. General introduction
 
Spatium Project Simulation student brief
Spatium Project Simulation student briefSpatium Project Simulation student brief
Spatium Project Simulation student brief
 
Third Battle of Panipat detailed notes.pptx
Third Battle of Panipat detailed notes.pptxThird Battle of Panipat detailed notes.pptx
Third Battle of Panipat detailed notes.pptx
 
Mehran University Newsletter Vol-X, Issue-I, 2024
Mehran University Newsletter Vol-X, Issue-I, 2024Mehran University Newsletter Vol-X, Issue-I, 2024
Mehran University Newsletter Vol-X, Issue-I, 2024
 
How to Manage Global Discount in Odoo 17 POS
How to Manage Global Discount in Odoo 17 POSHow to Manage Global Discount in Odoo 17 POS
How to Manage Global Discount in Odoo 17 POS
 
Kodo Millet PPT made by Ghanshyam bairwa college of Agriculture kumher bhara...
Kodo Millet  PPT made by Ghanshyam bairwa college of Agriculture kumher bhara...Kodo Millet  PPT made by Ghanshyam bairwa college of Agriculture kumher bhara...
Kodo Millet PPT made by Ghanshyam bairwa college of Agriculture kumher bhara...
 
Unit-IV- Pharma. Marketing Channels.pptx
Unit-IV- Pharma. Marketing Channels.pptxUnit-IV- Pharma. Marketing Channels.pptx
Unit-IV- Pharma. Marketing Channels.pptx
 
Unit-V; Pricing (Pharma Marketing Management).pptx
Unit-V; Pricing (Pharma Marketing Management).pptxUnit-V; Pricing (Pharma Marketing Management).pptx
Unit-V; Pricing (Pharma Marketing Management).pptx
 
Dyslexia AI Workshop for Slideshare.pptx
Dyslexia AI Workshop for Slideshare.pptxDyslexia AI Workshop for Slideshare.pptx
Dyslexia AI Workshop for Slideshare.pptx
 
Making communications land - Are they received and understood as intended? we...
Making communications land - Are they received and understood as intended? we...Making communications land - Are they received and understood as intended? we...
Making communications land - Are they received and understood as intended? we...
 
Introduction to Nonprofit Accounting: The Basics
Introduction to Nonprofit Accounting: The BasicsIntroduction to Nonprofit Accounting: The Basics
Introduction to Nonprofit Accounting: The Basics
 
Holdier Curriculum Vitae (April 2024).pdf
Holdier Curriculum Vitae (April 2024).pdfHoldier Curriculum Vitae (April 2024).pdf
Holdier Curriculum Vitae (April 2024).pdf
 
Russian Escort Service in Delhi 11k Hotel Foreigner Russian Call Girls in Delhi
Russian Escort Service in Delhi 11k Hotel Foreigner Russian Call Girls in DelhiRussian Escort Service in Delhi 11k Hotel Foreigner Russian Call Girls in Delhi
Russian Escort Service in Delhi 11k Hotel Foreigner Russian Call Girls in Delhi
 

Hypotheses for How Drawing as a Study Strategy May Impact Learning from Text

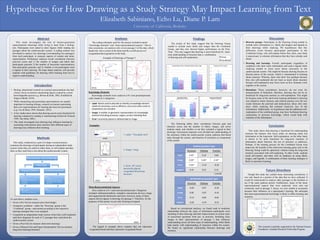
  • 1. RESEARCH POSTER PRESENTATION DESIGN © 2012 www.PosterPresentations.com This study investigates the role of learner-generated representations (drawing) while trying to learn from a biology text. Participants were asked to draw figures while reading ten passages about the cardiovascular system. A coding scheme was developed to analyze two drawings (corresponding two passages) from each participant, to measure aspects of content and meta- representation. Preliminary analyses reveal correlations between post-test scores and 1) the number of images and labels that participants generate 2) the number of inaccurate representations that participants generate, and 3) whether or not participants used a legend in their drawing. We hope future analyses will provide students with guidelines for drawing while learning from text to improve understanding. Abstract( The coding schematic used for this project included content “knowledge elements” and “meta-representational aspects.” Due to time constraints, our analysis only covers passage 3 of the data, which details the valve system in the heart and the overall process of oxygenation/deoxygenation in the body. Knowledge Elements Knowledge elements were coded on a 0-1 (not present/present) scale, based on 3 categories: Meta-Representational Aspects: Also coded on a 0-1 scale (not present/present). Categories included: anthropomorphism, metaphor, mneumonic devices, image and organizational abstraction and more; however, many of these aspects did not appear in drawings for passage 3. Therefore, for the purposes of this poster, we are only focusing on legend. Analyses( The following tables show correlations between gain and retention scores and the number of labels, images, and errors students made, and whether or not they included a legend in their drawings. Assessment responses were divided into understanding of the structures within the cardiovascular system, pathway that blood takes through the system, and function of structures as components of the system. Findings( •  Between groups: Participants in the Drawing Group tended to include more information (i.e. labels and images) and legends in their drawings while studying. We hypothesize that this difference exists because participants participants in the Combined Group, who self-explain before they draw, may think it unnecessary to reiterate information that they have already said aloud. •  Drawing and learning: Overall, participants (regardless of condition) who drew more information and used a legend while studying tended to learn more about structures in the cardiovascular system. This might be because drawing focuses on discrete pieces of the system, which is instrumental in learning about structure. Whereas, those who drew less (perhaps because they also self-explained) did not learn as much about structure because self-explanation may focus more on how elements work together in the system. •  Retention: These correlations, however, do not exist for measurements of Retention; therefore, drawing may not be as beneficial for long-term memory as self-explanation. This might be because some of the short-term learning attributed to drawing was related to motor memory, and without practice over the two weeks between the post-test and delayed-test, those who only drew while studying did retained relatively less of the information. Additionally, we hypothesize that the additional self- explanation of the combined group, may have facilitated drawing connections to previous knowledge, which would help with retention of the information. This study, conducted as a part of a larger research project, examines the drawings of participants during an independent study session where they are asked to either draw, or self-explain and then draw as they read from a text about the cardiovascular system. As seen above, students were… •  Given a Pre-Test (to measure prior knowledge) •  Assigned a condition—either the “Drawing” group or the “Combined” group—and trained according to the respective learning strategies they were assigned •  Completed an independent study session where they (self-explained and) drew diagrams for each of 11 passages they read about the cardiovascular system •  Given a Post-Test (to measure short-term learning) •  Given a Delayed Test and Figure Interpretation Test (to measure long-term learning/retention) Elizabeth Sabiniano, Echo Lu, Diane P. Lam Hypotheses for How Drawing as a Study Strategy May Impact Learning from Text The legend in example above explains that red represents oxygenated blood and blue represents oxygenated blood. Examples: Example of Drawings of Passage 3 GAIN(by(QuesBon(Type Structure Pathway Func/on Label 0.36* 0.19 0.06 Image 0.29* 0.28* 0.33* Error L0.46* L0.14 L0.18 Legend 0.19 0.25 0.15 This study shows that drawing is beneficial for understanding structure but learners who focus solely on drawing retain less information in the long-term. Self-explanation, on the other hand, is shown to be more beneficial for long-term retention of information about function, but not of structure or pathways. Perhaps, if the training process for the Combined Group were improved, the benefits of the short-term learning gains seen in the Drawing Group could be optimized, without losing the long-term retention associated with self-explaining. In other words, students could self-explain, and draw with an emphasis on using labels, images, and legends. A combination of these learning strategies is likely to maximize learning. •  Label:&Words&used&to&describe&or&iden/fy&a&knowledge&element.& Labels&for&processes,&such&as&diffusion,&only&count&when&verbs&or& preposi/ons&are&included.& •  Image:&A&realis/c&or&geometric&representa/on&of&a&knowledge& element&(including&processes,&organs,&arrows&indica/ng&flow& •  Error:&Incorrectly&placed&or&defined&label&or&image&& Methods( Discussion( Conclusion( !" #" $" %" &" '!" '#" '$" '%" '&" ()*+," -.)/+" 0+1" !"#$%$&'$()"&)*++,-$.)/%01"&2() 23)4" 56.*78+9" !"##$ %"&'$ !"()$ #"%&$ %"&%$ !"*#$ ("($ ("+$ %"($ %"+$ #"($ #"+$ !"($ !"+$ *"($ !"#$%"$#&' ()"*+),' -$.%/0.' 122&223&."'4)5.2'' 678&./%)9':$&2/0.2';#03'(#&'"0'(02"'"&2"<' $,$ ,$-.("(+$ !"#$% !&#'% !&#$% !$#'% $#$% $#'% &#$% !"#$%"$#&' ()"*+),' -$.%/0.' 122&223&."'4&"&./0.'' 5166'7$&2/0.2'8#03'(02"'"0'9&6),&:;' !"#$% !"&'% !% !"&% !"(% !"$% !"#% !")% !"*% +,-,./% !"#$%#&'()*+),-#)*+).)/#0#&1) !"#$% &$"!'% #"()% &*"&+% ,% *% $% '% )% &,% &*% &$% &'% &)% -./01% 23.40% !"#$%&#'()*+#$',-'./*#0'%'1%$23/4%56'7538)9#9'%':%+#8',$'7*%&#' The results of this study suggest that the Drawing Group tended to include more labels and images than the Combined Group, and they also showed higher performance on the Post- Tests. This may suggest that drawing is more beneficial for short- term understanding of structure than a combination of drawing and self-explanation. Though this study has yielded many interesting correlations, it was only based on a portion of the data that we have collected. It would be instrumental to analyze other passages in the booklets to see if the same patterns persist. Furthermore, many of the meta- representational aspects that were analyzed, were also not commonly used in passage 3; hence, we were unable to accurately measure their influence on a participant’s learning. We anticipate that meta-representational knowledge is likely to effect learning and retention. Future(DirecBons( •  Biology educational research on external representations has had a heavy focus on learners interpreting figures created by a more knowledgeable person (e.g. Bowen & Roth, 2002; Kindfield & Singer-Gabella, 2010) •  While interpreting and generating representations are equally important to learning biology, research on learners generating their own representations for learning has been less prominent (e.g. Cox & Brna, 1995; Parnafes, 2012) •  A few studies have shown that drawing can be more beneficial for learning compared to reading or summarizing (Gobert & Clement, 1999; Van Meter 2001). •  This study investigates how drawing may influence learning by examining what learners draw and how their different types of drawings may influence their learning. IntroducBon( RETENTION(by(QuesBon(Type Structure Pathway Func/on Label L0.20& 0.07& L0.18& Image 0.00& L0.07& L0.16& Error L0.13& 0.00& L0.05& Legend L0.26& L0.14& L0.22& 3. Error: AV valves incorrectly placed, oxygenated blood loop incorrect 2. Image: Lungs 1. Label: “Tricuspid valve” #3982& #3982& *&p<0.05& Based on correlational analyses, we found weak to moderate relationships between the types of information participants were including in their drawings and their improvement on certain types of assessment questions from pre- to post-test. Including more images in their representations of passage 3 may influence understanding across all three types of understanding, while labels help mainly with understanding of structures within the system. We found no significant relationship between drawings and retention. This research is partially supported by the National Science Foundation Graduate Research Fellowship Program University of California, Berkeley #3603& #9704& #6784& #0065& #0151& #8646&