SlideShare a Scribd company logo
1 of 12
Download to read offline
for Forestry Spring 2013
Esri News
Better Forest Damage Assessment
ArcGIS Saves Time, Improves Accuracy
By Barbara Shields, Esri Writer
Thunderstorms, powerful winds, and deadly tornadoes tore through
39 counties in Alabama in April 2011. The city of Tuscaloosa was flat-
tened. Across the state, people were killed and homes and businesses
were destroyed. Forests suffered loss as well. The Alabama Forestry
Commission (AFC) used ArcGIS to assess forest resource damage.
	 AFC estimated that 26,733 acres of forestland were impacted by the
April 15 tornadoes, with an assessed value of $37,728,175. The April 27
tornadoes were estimated to have damaged 177,857 acres, with an
 Alabama forests were damaged by tornadoes in April 2011.
assessed value of $228,360,576. Impact to the forestland in Alabama
from the April storms totaled 204,590 acres, with an assessed value of
$266,088,751.
	 “The ability to use GIS technologies to integrate cadastral, remotely
sensed, and observational data greatly reduced the time frame neces-
sary for developing the assessment information,” said Patrick A. Glass,
assistant state forester, AFC. “Geoprocessing models developed in
continued on page 3
Spring 2013
Esri News for Forestry is a publication of the 	
Forestry Group of Esri.
To contact the Esri Desktop Order Center, call 1-800-447-9778
within the United States or 909-793-2853, extension 1-1235,
outside the United States.
Visit the Esri website at esri.com.
View Esri News for Forestry online at esri.com/forestry or scan
the code below with your smartphone.
Advertise with Us
E-mail ads@esri.com.
Submit Content
To submit articles for publication in Esri News for Forestry,
contact Barbara Shields at bshields@esri.com.
Manage Your Subscription
To update your mailing address or subscribe or unsubscribe to
Esri publications, visit esri.com/publications.
International customers should contact an Esri distributor to
manage their subscriptions.
For a directory of distributors, visit esri.com/distributors.
Circulation Services
For back issues, missed issues, and other circulation services,
e-mail requests@esri.com; call 909-793-2853, extension 2778;
or fax 909-798-0560.
2 Esri News for Forestry  Spring 2013
Contents
The information contained in this work is the exclusive property of Esri or its licensors. This work is protected
under United States copyright law and other international copyright treaties and conventions. No part of this
work may be reproduced or transmitted in any form or by any means, electronic or mechanical, including
photocopying and recording, or by any information storage or retrieval system, except as expressly permitted
in writing by Esri. All requests should be sent to Attention: Contracts and Legal Services Manager, Esri, 380 New
York Street, Redlands, CA 92373-8100 USA.
The information contained in this work is subject to change without notice.
The Geographic Advantage, Esri, the Esri globe logo, 3D Analyst, ArcAtlas, ArcCatalog, ArcData, ArcDoc,
ArcEditor, ArcExplorer, ArcGIS, the ArcGIS logo, ArcGlobe, ArcIMS, ARC/INFO, ArcInfo, ArcLogistics, ArcMap,
ArcNetwork, ArcNews, ArcObjects, ArcPad, ArcPress, ArcReader, ArcSDE, ArcSurvey, ArcToolbox, ArcTools,
ArcUser, ArcView, ArcVoyager, ArcWatch, ArcWeb, ArcWorld, ArcXML, Business Analyst Online, BusinessMAP,
CommunityInfo, EDN, Geography Network, GIS Day, MapData, MapObjects, Maplex, MapStudio, ModelBuilder,
MOLE, NetEngine, RouteMAP, SDE, Sourcebook•America, StreetMap, Tapestry, @esri.com, esri.com, arcgis.
com, geographynetwork.com, gis.com, and gisday.com are trademarks, service marks, or registered marks of
Esri in the United States, the European Community, or certain other jurisdictions.
Other companies and products or services mentioned herein may be trademarks, service marks, or registered
marks of their respective mark owners.
Copyright © 2013 Esri.
All rights reserved.
Printed in the United States of America.
1	 Better Forest Damage Assessment
4	 Clinton Climate Initiative Uses GIS to Preserve and
Regrow Forests
5	 Quickly and Easily Use Landsat Data with ArcGIS Online
6	 Researchers Develop an Effective Approach to 		
Forest Cover Analysis
8	 USDA Forest Service FUSION Offers Powerful Lidar Tools
10	 Create a Map in Seven Steps	
11	 Attend a Conference Just for You
11	 Esri Invites You to Join the Forestry Group
11	 On the Road
response to the April tornadoes allowed for unprece-
dented speed and precision in producing results that are
portable and scalable to any significant geographic area.”
	 AFC collected GPS Exchange Format (GPX) files
on the tornado paths and converted them to feature
classes for GIS analysis to meet agency objectives. AFC
GIS specialist Abi Dhakal was tasked to create maps for
analyzing and assessing the total forest damage by acre,
by county, and for the entire state. Dhakal created a GIS
model that significantly reduced the time to produce
these geospatial products.
	 Manually geoprocessing data for 39 counties individu-
ally and generating maps for tornado damage analysis
would have taken weeks, if not months, to complete.
Instead, Dhakal built a GIS model that included batch
processing, which allowed him to quickly and efficiently
render processes on multiple datasets. He easily ac-
cessed ArcGIS tools—such as Select, Intersect, Buffer,
Clip, and Tabulate Area—in the geoprocessing models.
	 Dhakal designed more than a dozen geoprocesses
and steps to produce results. By slightly tweaking the
models, he could adapt subtle changes in analysis
objectives. Initially, it took him a few days to develop the GIS model,
but upon completion, the model ran data for multiple counties
through geoprocesses and created damage analysis maps in just a few
minutes.
	 Next, Dhakal and Glass used Forest Inventory & Analysis (FIA) data
outside the model to calculate the volume of timber loss. Finally, they
applied Timber-Mart South standing timber prices to the volume loss
and calculated tornado damage to the forests in US dollar amounts.
	 The results of the analysis were used by Alabama’s congressional
delegation to document a supplemental funding request for the
USDA Farm Service Agency’s Emergency Forest Restoration Program.
Results were also used by AFC, Alabama Forestry Recovery Task
Force, Alabama Cooperative Extension Service, and other agencies to
manage recovery of the forest resources.
For more information about the
forest damage assessment model,
contact Abi Dhakal at
abi.dhakal@forestry.alabama.gov.
 To assess forest types impacted by two tornadoes, a model used tornado
path polygons derived from aerial reconnaissance, the National Land Cover
Dataset (NLCD), and parcel data. Data from Esri, AFC, NOSS NWS, and the
US Geological Survey (USGS) was also used.
 The volume of timber damage was calculated for
each of the 39 Alabama counties impacted by the
tornadoes. Data is from AFC, Esri, NLCD, and USGS.
3Spring 2013 esri.com/forestry
Better Forest Damage Assessment  continued from cover
Clinton Climate Initiative Uses
GIS to Preserve and Regrow Forests
security, viability of coastal cities, and water
availability around the world.
	  To reduce emissions, governments and
economies must use less fossil fuels and
increase the use of energy-efficient and
renewable technologies. The CCI Forestry
Program focuses on helping developing
countries reverse deforestation and plant new
trees. By showing that they can monitor and
verify the reduction of their carbon dioxide
emissions, countries become eligible for fund-
ing to manage their forest programs and other
low-carbon economic activities.
	 CCI uses GIS technology as a centerpiece
of forest carbon measurement, reporting,
and verification (MRV) systems for develop-
ing countries. GIS is one of three legs of the
platform—data, models, and GIS—that allow
 CCI used GIS to measure carbon
and compute carbon credits that were
used to preserve this forest in Guyana.
4 Esri News for Forestry  Spring 2013
The Clinton Climate Initiative (CCI) Forestry
Program develops forestry projects and
carbon measurement systems that help
governments and local communities receive
compensation for preserving and regrowing
forests. CCI uses GIS technology to help
countries monitor their carbon levels.
	 Global warming is caused by increased
carbon dioxide in the atmosphere from burn-
ing fossil fuels, and deforestation accounts
for about 15 percent of total carbon dioxide
emissions in the world. Scientists predict that
if governments and communities don’t take
action to reduce carbon dioxide emissions,
our world will face increasingly drastic con-
sequences ranging from stronger heat waves
to more droughts and floods to increasing
sea level. All these affect agriculture, food
countries to determine how much carbon they
have, how it is changing, and how the drivers
of deforestation and forest degradation can
be monitored and adjusted as required.
	  With GIS in place for forestry, developing
countries can be eligible for direct payments
through international agreements based on
the effectiveness of their MRV systems. Once
in place, GIS can be used more broadly for
other resource development, land surveys,
and the determination of land tenure.
	 For example, tree farming projects in Kenya
help make forest conservation and restoration
profitable for local communities. CCI is cur-
rently working on 10 sustainable-forest man-
agement projects, encompassing 644,000
hectares of land, that will benefit more than
353,000 people in forest-dependent commu-
nities around the world.
	 Esri awarded CCI the 2012 Special
Achievement in GIS Award for helping the
country of Guyana become eligible for
$70 million in forest-based payments from the
government of Norway. Guyana is now using
this funding to facilitate specific elements of
a low-carbon development plan envisioned
and put in place by former Guyana president
Bharrat Jagdeo. This project is part of the CCI
Forestry Program and has been supported by
the Rockefeller Foundation and the govern-
ments of Norway and Australia.
Read more about CCI’s
forestry projects at
clintonfoundation.org.
 The Clinton Climate Initiative supports tree farming projects
in Kenya. This Kenyan tree farmer is working in a nursery to
conserve a local forest.
Quickly and Easily Use
Landsat Data with ArcGIS Online
Landsat imagery is one of several remote sensor systems land analysts use to study vegetation,
land use, soil conditions, and terrain. ArcGIS Online image services provide quick and simple
access to free United States Department of the Interior’s US Geological Survey (USGS) Landsat
data. These image services are based on the Global Land Survey (GLS) datasets created by
USGS and the National Aeronautics and Space Administration (NASA). Landsat data supports
global assessments of land cover, land cover change, and ecosystem dynamics such as
disturbance and vegetation health.
	 Landsat represents the world’s longest continuously acquired collection of space-based,
moderate-resolution, land remote-sensing, data change research. It is more efficient than any
other technology used to meet decision support requirements.
	 Esri provides Landsat image services that enable users to explore important imagery
information such as band combination analysis for natural color, infrared, vegetative change,
and Normalized Difference Vegetation Index (NDVI). The user can also compare many years of
imagery to see changes over time.
	 Two Landsat viewers are available online to help users do just that—LandsatLook Viewer
from USGS and ChangeMatters Viewer from Esri. Both of these viewers use ArcGIS technology
to serve Landsat as web services, accessing many terabytes of imagery. LandsatLook Viewer
provides access to the complete archive of USGS Landsat scenes going back to 1972.
	 ChangeMatters Viewer provides access to the best cloud-free Landsat scenes from the five
epochs, circa 1975, 1990, 2000, 2005, and 2010. It uses ArcGIS as its underlying technology to
additionally process the Landsat GLS dataset on the fly into multiple data products. These are
served as World Landsat Services on ArcGIS Online. The image service platform is also host to
the Landsat community, a group that shares maps and applications using Landsat imagery.
 This map is a mosaicked composite of data
from the image service of the Landsat Global
Land Survey (GLS) 2010 dataset and can be
accessed on ArcGIS Online. This data has
been enhanced with radiometric correction
and histogram stretching to make it more
visually appealing.
5Spring 2013 esri.com/forestry
Researchers Develop an Effective Approach to
Forest Cover Analysis
By Aaron E. Maxwell, Remote Sensing Analyst, Natural Resource Analysis Center, West Virginia University
Overwatch. The outcome was a statewide
forest cover and forest fragmentation map
created from raster data at a nine-meter cell
size for the state of West Virginia.
	 The project goal was to capture the
spectral, textural, and land-use variability
with defined classes. WVU researchers relied
on object-based image analysis, which uses
spectral and textural information within an
image to extract thematic data. The pro-
ject’s imagery was from the United States
Department of Agriculture (USDA) Farm
Service Agency. This was four-band, leaf-on,
one-meter pixel size, uncompressed imagery
State resource agencies model wildlife habitat
to support the planning and management of
natural resources. The most widely available
land cover for states to use is the Landsat-
derived National Land Cover Dataset (NLCD).
Because of its coarse resolution (30 meters)
and temporal lag to the current conditions,
using the NLCD is a challenge for wildlife
modeling at a local scale. Researchers from
West Virginia University (WVU) created a more
effective approach for modeling habitat. They
implemented a GIS and remote-sensing meth-
odology for creating statewide forest cover
and forest fragmentation data layers.
 Figure 1. This training data was derived from interpreting photo imagery as polygons in ArcGIS. This base imagery is 2011 NAIP
orthophotography displayed in true color.
	 The approach was to use publicly avail-
able orthophotography from the National
Agriculture Imagery Program (NAIP). This pro-
vided better resolution for raster data layers,
increased accuracy of forest cover analysis,
and delineation of fragmented wildlife habi-
tat. NAIP orthophotography has a one-meter
cell size and four-band spectral information
(true color bands and an infrared band). The
photography is captured on a two-year cycle,
so datasets can be regularly updated.
	 The analyst used Esri’s ArcGIS 10 Desktop
image analysis tools and tools from the
Feature Analyst 5 extension for ArcGIS by
6 Esri News for Forestry  Spring 2013
representing forest conditions during the 2011
growing season.
	 The bulk of the researchers’ time was spent
extracting cover from each image and classify-
ing it as either forested/woody, grasslands/
herbaceous, or barren/nonvegetated cover.
It was necessary to collect a large number
of samples to accurately extract the cover of
interest. Researchers spent from one to three
hours creating training data, which contains
examples of the cover types of interest. They
manually interpreted photographs within the
ArcGIS editor, using its functionality to create
training data as vector and polygon features.
This training data process allowed user input
of vector data and generated examples of the
cover of interest. Figure 1 shows an example
of the training data digitized throughout the
state.
	 To extract cover, researchers used Feature
Analyst 5 to process each image. The integra-
tion of its extraction tools with ModelBuilder
enabled users to complete mapping tasks in
a timely manner. They visually inspected all
outputs for accuracy and, when necessary,
reprocessed outputs.
	 Having completed this mapping task, re-
searchers merged the resultant raster data to
produce a statewide grid at a nine-meter cell
size. They did this by using the Mosaic To New
Raster tool in the ArcGIS Data Management
toolbox. The outcome was a statewide forest
cover map representing the 2011 growing-
season conditions at a higher resolution than
is currently available from existing datasets,
such as the NLCD. Figure 2 shows the result-
ant cover.
	 To assess the accuracy of the forest cover
data, researchers compared the cover extrac-
tion to manual photograph interpretation at
randomly selected point locations across the
state. They streamed the 2011 NAIP ortho-
photography through ArcGIS for Server, which
was hosted by the Aerial Photography Field
Office (APFO) of the USDA. This allowed them
to quickly and easily access photography and
assess the accuracy of the resultant cover.
This approach yielded a forest cover map with
accuracy that was greater than 90 percent.
	 Forest fragmentation was created as a deriv-
ative of the raster forest cover. First, researchers
smoothed the resultant cover to provide a
more general representation of fragmentation
and to remove small canopy interruptions that
were deemed too small to fragment the forest.
To create the forest fragmentation data, they
employed morphological image analysis, ap-
plying mathematical morphology to analyze the
shape and form of objects.
	 Running the downloadable Landscape
Fragmentation Tool (LFT) version 2.0 in ArcGIS,
researchers mapped the types of fragmenta-
tion present in specified land cover types,
including patch, edge, perforated, and core,
which is based on a specified edge width.
	 To complete the processing, researchers
segmented the state into manageable units
and then merged the final results, ultimately
producing a raster grid of statewide forest
fragmentation with a nine-meter cell size.
Figure 3 shows the fragmentation data.
Project Team
Aaron E. Maxwell, Natural Resource Analysis Center, West Virginia University, Morgantown,
West Virginia; Michael P. Strager, Division of Forestry and Natural Resources, West Virginia
University, Morgantown, West Virginia; Elise M. Austin, Natural Resource Analysis Center,
West Virginia University, Morgantown, West Virginia
 Figure 2. Researchers created thematic tree cover for West Virginia.
They derived this coverage from 2011 NAIP orthophotography by
using object-based image analysis tools in the Feature Analyst 5
extension for ArcGIS.
 Figure 3: Forest researchers were able to derive this forest
fragmentation data for West Virginia by using a script within
ArcToolbox to extract forest cover thematic data layers.
7Spring 2013 esri.com/forestry
Forest managers can now use lidar data in combination with GIS to
help them assess forest inventories and create forest plans. The USDA
Forest Service’s (USFS) FUSION software, combined with Esri’s ArcGIS,
provides lidar analytic tools, a streamlined workflow, and functionality
for storing, organizing, and sharing lidar .las files. Foresters can under-
stand, explore, and analyze lidar data point clouds and interactively
view them in 3D.
	 Foresters use FUSION to quantify vegetation by extracting lidar
point clouds and correlating them with forest inventory plots. It calcu-
lates various canopy metrics, such as height statistics, to describe the
canopy distribution and cover density ratios. FUSION then summarizes
these ratios at the plot level or in a continuous grid cell format. It also
performs a quality routine to assess the appropriateness of lidar point
data for a forestry application.
	 FUSION provides a robust ability to perform extensive point cloud
analytics of forest inventory variables across large landscapes. The in-
formation it extracts to describe the forest canopy is easily exported as
an ASCII grid and imported into ArcGIS along with other GIS datasets
(figure 1).
USDA Forest Service FUSION Offers
Powerful Lidar Tools
 Figure 1. The user exported FUSION-derived
lidar canopy metrics into ArcGIS to produce this
map showing the first return percent canopy cover
grid metric, produced at a 25-meter cell size, across
approximately 85,000 acres in southeast Arizona.
 Figure 2. The GIS
grid layer (25 m cell
size) represents
the Basal Area
inventory parameter
model applied at
the landscape level.
This GIS layer is
one of the end-user
products that will
be used for future
decision making,
analysis, and
monitoring for the
Pinaleño Sky Island
study area.
8 Esri News for Forestry  Spring 2013
Using ArcGIS Spatial Analyst, users apply conditional logic to the
FUSION-derived canopy structure grids to extract pixels meeting
certain criteria. For example, foresters can locate areas containing tall
trees with relatively low canopy cover.
FUSION Applied
Over the past several years, a workflow incorporating ArcGIS and
FUSION was implemented for a forest restoration effort in the Pinaleño
Mountains of the Coronado National Forest in southeastern Arizona.
To model forest inventory parameters, the team used regression
analysis to determine the correlation between the parameters that
were measured on field plots and the lidar canopy metrics that were
summarized in FUSION and classified as subsets for each plot.
	 Before applying the resultant statistical models to the landscape,
team members used GIS to ensure the models were applied appropri-
ately and successfully across the landscape. First, they applied a forest/
nonforest mask to ensure the models were applied only in forested
areas. This was accomplished using the Spatial Analyst Conditional
tool in ArcGIS and the canopy height and cover structure grid layers
output from FUSION. Each pixel had to meet a minimum vegetation
height of three meters and 2 percent canopy cover. All pixels that did
not meet the criteria were masked out before models were applied
across the study area.
	 The final step was to apply the regression models created in the
initial modeling steps to the appropriate ASCII grid layers. This
generated continuous inventory parameter GIS layers covering the
entire study area. Each calculation produced a new grid in which
each 25-meter cell spatially represents the estimated forest inventory
parameter of interest such as biomass, basal area, Lorey’s mean height,
and timber volume (figure 2). The resultant GIS inventory layers were
qualitatively validated by local experts and conformed well to trends
known to occur on the landscape.
	 The project team estimated that the cost for obtaining data suf-
ficient to implement the Pinaleño Ecosystem Restoration Project using
lidar was half the cost of traditional methods. Furthermore, capturing
the lidar data to measure sample areas was easier than deploying field
crews that could not safely measure trees in extreme terrain. Lidar
made it possible for the team to create continuous coverage of all
forested areas.
	 FUSION software is currently managed by Robert McGaughey of the
USDA Forest Service—Pacific Northwest Research Station. Download
USFS FUSION software free of charge at http://forsys.cfr.washington	
.edu/fusion/fusionlatest.html.
For more information, tutorials, and
sample lidar datasets, visit the USFS
Remote Sensing Applications Center at
www.fs.fed.us/eng/rsac.
Learn more about FUSION by contacting
Ron Behrendt, managing member,
Behron LLC, at behron@centurytel.net.
9Spring 2013 esri.com/forestry
Create a Map in Seven Steps
ArcGIS Online is the mapping platform for your organization. CEOs,
staff, and contractors can access maps and data for their work. See
opportunities and gain insight into your data. Do this quickly with no
data to install.
	 Create an ArcGIS Online forest map in seven steps at arcgis.com.
Click Sign In and note the ribbon on the top of the page. Click the word
ArcGIS to get to the ArcGIS Online page.
	 Let’s get started.
1.	Open a map: Click Make a Map, and you see a map of the 	
United States.
2.	Create the basemap: Click Basemap and select Light Gray Canvas.
3.	Add a data layer: Click the Add button on the ribbon; select Search
for layers; and in the Find field, type “USFS Ecological Subregions”
(the In field should say “ArcGIS Online”) and click Go. When the layer
appears, click Add beside the layer title.
4.	To add another layer package, go to the Find field and type “USGS
Forest Fragmentation”. Add it to your map.
5.	At the bottom of the Search for layers to add section, click the Done
Adding Layers button.
6.	See your layers in the table of contents. Point to a layer title and click
the arrow to its right. Play with the zoom, transparency, and visibility
tools and set them to your preference.
7.	Click Save to save your map in your account folder.
	 Explore your map. Click the layer title to see the map’s data layer
contents and select what you want to see. Above the Contents line,
pause your mouse pointer over an icon to see its function. Click Show
Map Legend to open it and click again to close it. Click the data layer
to select subsets on the map. Zoom to see greater detail. Click on the
map to get specific information. Click the Details button on the ribbon
to turn the contents column on and off.
	 ArcGIS Online is a service that lets you use GIS software and data.
Create maps that tell your story, build applications, and more.
Sign up for a 30-day free trial subscription
at arcgis.com.
 The USDA Forest Service published this map of ecological subregions.
 This map shows forest fragmentation risk.
 By combining two layers, the reader can see forest fragmentation
risk by ecological regions. The result has been saved and published for
public use.
10 Esri News for Forestry  Spring 2013
Join forestry professionals from around the world at the Esri Forestry
GIS Conference, which is hosted by the Esri Forestry Group. You will
meet with a community of GIS for forestry users, share ideas, hear best
practices, and talk to experts.
	 This year’s theme is Benefiting from Change: Realizing the Value of
GIS in Forest Management. The conference offers a hands-on work-
shop for you to develop your forestry GIS skills. You can also attend
sessions that explore these topics:
•• Forest spatial optimization
•• Integrating data and systems
•• Automated workflows
•• A complete desktop, web, and mobile system
•• Image management, classification, and analysis
•• Web applications and services for many user types
Esri Forestry GIS Conference
May 14–16, 2013 | Esri Headquarters, Redlands, California
For more information and to register, 	
visit esri.com/events/forestry.
Mark Your Calendar
Western Forestry Leadership Coalition (WFLC)
April 29–May 1, 2013
Denver, Colorado, USA
wflccenter.org
Esri Forestry GIS Conference
May 14–16, 2013
Redlands, California, USA
esri.com/events/forestry
2013 Southern Group of State Foresters (SGSF) 	
Summer Meeting
June 3–6, 2013
Savannah, Georgia, USA
www.southernforests.org
ElmiaWood
June 5–8, 2013
Jönköping, Sweden
elmia.se/en/wood
The Association of Consulting Foresters 		
National Conference
June 21–25, 2013
Keystone, Colorado, USA
www.acf-foresters.org
Esri International User Conference
July 8–12, 2013
San Diego, California, USA
esri.com/uc
Remsoft Modeling Conference and User Group
September 9–13, 2013
Fredericton, New Brunswick, Canada
remsoft.com
National Association of State Foresters
September 22–26, 2013
Hot Springs, Virginia, USA
stateforesters.org
Society of American Foresters National Convention
October 23–27, 2013
Charleston, South Carolina, USA
safnet.org
Western Forestry Leadership Coalition (WFLC) 		
Fall Meeting
October 28–30, 2013
San Diego, California, USA
wflccenter.org
COP 19
November 2013
Warsaw, Poland
polandcop19.org
Southern Forestry and Natural Resource 		
Management Conference
December 8–10, 2013
Athens, Georgia, USA
www.soforgis.net/2013
On the RoadAttend a Conference 	
Just for You
Esri invites you to join the Esri Forestry Group (EFG). Your participation
in this dynamic group will help you get more from your GIS and your
forest and land management data. Meet like-minded professionals,
share experiences, and exchange knowledge.
Become a Member
•• Community: Connect with a community of professionals 		
passionate about GIS.
•• Information: Stay current on Esri forestry products, events, 	
webinars, and resources.
•• Solutions: Learn about forestry GIS tools, applications, and projects.
Join today or renew your membership 	
at esri.com/efg.
Esri Invites You to Join
the Forestry Group
11Spring 2013 esri.com/forestry
Presorted
Standard
US Postage
Paid
Esri
380 New York Street
Redlands, California 92373-8100  usa
Grow Your Investment
With Esri®
Technology, you can run your daily
operations without losing sight of the big
picture. We have the analysis, modeling, and
asset management tools that you need to save
time, reduce risks, and lower costs.
Copyright © 2013 Esri. All rights reserved.
Learn more at esri.com/forestry
133839  QUAD15.3M4/13tk

More Related Content

What's hot

Esri News for State and Local Government Winter 2012/2013 issue
Esri News for State and Local Government Winter 2012/2013 issueEsri News for State and Local Government Winter 2012/2013 issue
Esri News for State and Local Government Winter 2012/2013 issueEsri
 
ArcGIS Online
ArcGIS OnlineArcGIS Online
ArcGIS OnlineEsri
 
Esri News for Petroleum Winter 2012/2013 newsletter
Esri News for Petroleum Winter 2012/2013 newsletterEsri News for Petroleum Winter 2012/2013 newsletter
Esri News for Petroleum Winter 2012/2013 newsletterEsri
 
GIS in Africa 2
GIS in Africa 2GIS in Africa 2
GIS in Africa 2Esri
 
Esri News for Petroleum Winter 2013/2014 newsletter
Esri News for Petroleum Winter 2013/2014 newsletterEsri News for Petroleum Winter 2013/2014 newsletter
Esri News for Petroleum Winter 2013/2014 newsletterEsri
 
Location analytics-put-the-where
Location analytics-put-the-whereLocation analytics-put-the-where
Location analytics-put-the-whereEsri
 
Summer 2013
Summer 2013Summer 2013
Summer 2013Esri
 
Esri News for State & Local Government Fall 2013 newsletter
Esri News for State & Local Government Fall 2013 newsletterEsri News for State & Local Government Fall 2013 newsletter
Esri News for State & Local Government Fall 2013 newsletterEsri
 
Esri News for Facilities Winter 2012/2013 newsletter
Esri News for Facilities Winter 2012/2013 newsletterEsri News for Facilities Winter 2012/2013 newsletter
Esri News for Facilities Winter 2012/2013 newsletterEsri
 
Lidar Unlocks Subterranean Philadelphia
Lidar Unlocks Subterranean PhiladelphiaLidar Unlocks Subterranean Philadelphia
Lidar Unlocks Subterranean PhiladelphiaEsri
 
Open Data
Open Data Open Data
Open Data Esri
 
GIS for National Mapping
GIS for National MappingGIS for National Mapping
GIS for National MappingEsri
 
Esri Technology for Defense
Esri Technology for DefenseEsri Technology for Defense
Esri Technology for DefenseEsri
 
GIS for Small Utilities
GIS for Small UtilitiesGIS for Small Utilities
GIS for Small UtilitiesEsri
 
GIS for Electric Transmission
GIS for Electric TransmissionGIS for Electric Transmission
GIS for Electric TransmissionEsri
 
Improving Citizen Engagement: Gov 2.0
Improving Citizen Engagement: Gov 2.0Improving Citizen Engagement: Gov 2.0
Improving Citizen Engagement: Gov 2.0Esri
 
Bathymetric Data Management
Bathymetric Data ManagementBathymetric Data Management
Bathymetric Data ManagementEsri
 
Esri data-tapestry-segmentation
Esri data-tapestry-segmentationEsri data-tapestry-segmentation
Esri data-tapestry-segmentationEsri
 
Esri Roads and Highways
Esri Roads and HighwaysEsri Roads and Highways
Esri Roads and HighwaysEsri
 

What's hot (20)

Esri News for State and Local Government Winter 2012/2013 issue
Esri News for State and Local Government Winter 2012/2013 issueEsri News for State and Local Government Winter 2012/2013 issue
Esri News for State and Local Government Winter 2012/2013 issue
 
ArcGIS Online
ArcGIS OnlineArcGIS Online
ArcGIS Online
 
Esri News for Petroleum Winter 2012/2013 newsletter
Esri News for Petroleum Winter 2012/2013 newsletterEsri News for Petroleum Winter 2012/2013 newsletter
Esri News for Petroleum Winter 2012/2013 newsletter
 
GIS in Africa 2
GIS in Africa 2GIS in Africa 2
GIS in Africa 2
 
Esri News for Petroleum Winter 2013/2014 newsletter
Esri News for Petroleum Winter 2013/2014 newsletterEsri News for Petroleum Winter 2013/2014 newsletter
Esri News for Petroleum Winter 2013/2014 newsletter
 
Location analytics-put-the-where
Location analytics-put-the-whereLocation analytics-put-the-where
Location analytics-put-the-where
 
Summer 2013
Summer 2013Summer 2013
Summer 2013
 
Esri News for State & Local Government Fall 2013 newsletter
Esri News for State & Local Government Fall 2013 newsletterEsri News for State & Local Government Fall 2013 newsletter
Esri News for State & Local Government Fall 2013 newsletter
 
Esri News for Facilities Winter 2012/2013 newsletter
Esri News for Facilities Winter 2012/2013 newsletterEsri News for Facilities Winter 2012/2013 newsletter
Esri News for Facilities Winter 2012/2013 newsletter
 
Lidar Unlocks Subterranean Philadelphia
Lidar Unlocks Subterranean PhiladelphiaLidar Unlocks Subterranean Philadelphia
Lidar Unlocks Subterranean Philadelphia
 
Open Data
Open Data Open Data
Open Data
 
GIS for National Mapping
GIS for National MappingGIS for National Mapping
GIS for National Mapping
 
Esri Technology for Defense
Esri Technology for DefenseEsri Technology for Defense
Esri Technology for Defense
 
GIS for Small Utilities
GIS for Small UtilitiesGIS for Small Utilities
GIS for Small Utilities
 
GIS for Electric Transmission
GIS for Electric TransmissionGIS for Electric Transmission
GIS for Electric Transmission
 
Improving Citizen Engagement: Gov 2.0
Improving Citizen Engagement: Gov 2.0Improving Citizen Engagement: Gov 2.0
Improving Citizen Engagement: Gov 2.0
 
ODOT PR
ODOT PRODOT PR
ODOT PR
 
Bathymetric Data Management
Bathymetric Data ManagementBathymetric Data Management
Bathymetric Data Management
 
Esri data-tapestry-segmentation
Esri data-tapestry-segmentationEsri data-tapestry-segmentation
Esri data-tapestry-segmentation
 
Esri Roads and Highways
Esri Roads and HighwaysEsri Roads and Highways
Esri Roads and Highways
 

Viewers also liked

7 Apps Government Should Know About
7 Apps Government Should Know About7 Apps Government Should Know About
7 Apps Government Should Know AboutEsri
 
Location Analytics for Insurance
Location Analytics for InsuranceLocation Analytics for Insurance
Location Analytics for InsuranceEsri
 
ArcGIS 10.2.2 for Desktop Functionality Matrix
ArcGIS 10.2.2 for Desktop Functionality MatrixArcGIS 10.2.2 for Desktop Functionality Matrix
ArcGIS 10.2.2 for Desktop Functionality MatrixEsri
 
Prof. marc bonazountas & mr. alkis astyakopoulos (epsilon international sa) “...
Prof. marc bonazountas & mr. alkis astyakopoulos (epsilon international sa) “...Prof. marc bonazountas & mr. alkis astyakopoulos (epsilon international sa) “...
Prof. marc bonazountas & mr. alkis astyakopoulos (epsilon international sa) “...anest_trip
 
Dr. pavlos konstantinidis (forest research institute of thessaloniki) “use of...
Dr. pavlos konstantinidis (forest research institute of thessaloniki) “use of...Dr. pavlos konstantinidis (forest research institute of thessaloniki) “use of...
Dr. pavlos konstantinidis (forest research institute of thessaloniki) “use of...anest_trip
 
Forest Management with Esri
Forest Management with EsriForest Management with Esri
Forest Management with EsriEsri
 
Boost Mining Profits with Esri
Boost Mining Profits with EsriBoost Mining Profits with Esri
Boost Mining Profits with EsriEsri
 
2014 Esri US Business Locations and Business Summary Data: Methodology Statement
2014 Esri US Business Locations and Business Summary Data: Methodology Statement2014 Esri US Business Locations and Business Summary Data: Methodology Statement
2014 Esri US Business Locations and Business Summary Data: Methodology StatementEsri
 
Esri News for Health & Human Services -- Summer 2012
Esri News for Health & Human Services -- Summer 2012Esri News for Health & Human Services -- Summer 2012
Esri News for Health & Human Services -- Summer 2012Esri
 
Lidar Analysis in ArcGIS® 10.0 for Forestry Applications
Lidar Analysis in ArcGIS® 10.0 for Forestry ApplicationsLidar Analysis in ArcGIS® 10.0 for Forestry Applications
Lidar Analysis in ArcGIS® 10.0 for Forestry ApplicationsGordon Sumerling
 
Using ArcGIS to Manage Wildland Fires
Using ArcGIS to Manage Wildland FiresUsing ArcGIS to Manage Wildland Fires
Using ArcGIS to Manage Wildland FiresBill King
 
Fighting Climate Change by Fighting Fires - Esri FedGIS 2016 Presentation
Fighting Climate Change by Fighting Fires - Esri FedGIS 2016 PresentationFighting Climate Change by Fighting Fires - Esri FedGIS 2016 Presentation
Fighting Climate Change by Fighting Fires - Esri FedGIS 2016 PresentationBlue Raster
 

Viewers also liked (13)

7 Apps Government Should Know About
7 Apps Government Should Know About7 Apps Government Should Know About
7 Apps Government Should Know About
 
Location Analytics for Insurance
Location Analytics for InsuranceLocation Analytics for Insurance
Location Analytics for Insurance
 
ArcGIS 10.2.2 for Desktop Functionality Matrix
ArcGIS 10.2.2 for Desktop Functionality MatrixArcGIS 10.2.2 for Desktop Functionality Matrix
ArcGIS 10.2.2 for Desktop Functionality Matrix
 
Prof. marc bonazountas & mr. alkis astyakopoulos (epsilon international sa) “...
Prof. marc bonazountas & mr. alkis astyakopoulos (epsilon international sa) “...Prof. marc bonazountas & mr. alkis astyakopoulos (epsilon international sa) “...
Prof. marc bonazountas & mr. alkis astyakopoulos (epsilon international sa) “...
 
Dr. pavlos konstantinidis (forest research institute of thessaloniki) “use of...
Dr. pavlos konstantinidis (forest research institute of thessaloniki) “use of...Dr. pavlos konstantinidis (forest research institute of thessaloniki) “use of...
Dr. pavlos konstantinidis (forest research institute of thessaloniki) “use of...
 
Forest Management with Esri
Forest Management with EsriForest Management with Esri
Forest Management with Esri
 
Boost Mining Profits with Esri
Boost Mining Profits with EsriBoost Mining Profits with Esri
Boost Mining Profits with Esri
 
Sphynx
SphynxSphynx
Sphynx
 
2014 Esri US Business Locations and Business Summary Data: Methodology Statement
2014 Esri US Business Locations and Business Summary Data: Methodology Statement2014 Esri US Business Locations and Business Summary Data: Methodology Statement
2014 Esri US Business Locations and Business Summary Data: Methodology Statement
 
Esri News for Health & Human Services -- Summer 2012
Esri News for Health & Human Services -- Summer 2012Esri News for Health & Human Services -- Summer 2012
Esri News for Health & Human Services -- Summer 2012
 
Lidar Analysis in ArcGIS® 10.0 for Forestry Applications
Lidar Analysis in ArcGIS® 10.0 for Forestry ApplicationsLidar Analysis in ArcGIS® 10.0 for Forestry Applications
Lidar Analysis in ArcGIS® 10.0 for Forestry Applications
 
Using ArcGIS to Manage Wildland Fires
Using ArcGIS to Manage Wildland FiresUsing ArcGIS to Manage Wildland Fires
Using ArcGIS to Manage Wildland Fires
 
Fighting Climate Change by Fighting Fires - Esri FedGIS 2016 Presentation
Fighting Climate Change by Fighting Fires - Esri FedGIS 2016 PresentationFighting Climate Change by Fighting Fires - Esri FedGIS 2016 Presentation
Fighting Climate Change by Fighting Fires - Esri FedGIS 2016 Presentation
 

Similar to Spring 2013

Esri News for Federal Government Winter 2012/2013 issue
Esri News for Federal Government Winter 2012/2013 issueEsri News for Federal Government Winter 2012/2013 issue
Esri News for Federal Government Winter 2012/2013 issueEsri
 
Role of gis in climate change
Role of gis in climate changeRole of gis in climate change
Role of gis in climate changeSalar Saeed Dogar
 
Esri News for State and Local Government Spring 2013 issue
Esri News for State and Local Government Spring 2013 issueEsri News for State and Local Government Spring 2013 issue
Esri News for State and Local Government Spring 2013 issueEsri
 
Esri News for Water Resources Winter 2012/2013 newsletter
Esri News for Water Resources Winter 2012/2013 newsletterEsri News for Water Resources Winter 2012/2013 newsletter
Esri News for Water Resources Winter 2012/2013 newsletterEsri
 
Esri News for Agriculture Spring 2013 issue
Esri News for Agriculture Spring 2013 issueEsri News for Agriculture Spring 2013 issue
Esri News for Agriculture Spring 2013 issueEsri
 
Calculating the Value of Green
Calculating the Value of GreenCalculating the Value of Green
Calculating the Value of GreenDan Dinelli
 
GEOG2900 Project Proposal
GEOG2900 Project ProposalGEOG2900 Project Proposal
GEOG2900 Project Proposalmolivos
 
Project Proposal
Project ProposalProject Proposal
Project Proposalmolivos
 
Signed_StrategicEnergy_Framework_01_14_11-3
Signed_StrategicEnergy_Framework_01_14_11-3Signed_StrategicEnergy_Framework_01_14_11-3
Signed_StrategicEnergy_Framework_01_14_11-3Loren Ford
 
NISAR NASA-ISRO Synthetic Aperture Radar (NISAR) Forest Resources
NISAR NASA-ISRO Synthetic Aperture Radar (NISAR) Forest ResourcesNISAR NASA-ISRO Synthetic Aperture Radar (NISAR) Forest Resources
NISAR NASA-ISRO Synthetic Aperture Radar (NISAR) Forest ResourcesDr. Pankaj Dhussa
 
The Restoring Healthy Forests for Healthy Communities Act: Program Design and...
The Restoring Healthy Forests for Healthy Communities Act: Program Design and...The Restoring Healthy Forests for Healthy Communities Act: Program Design and...
The Restoring Healthy Forests for Healthy Communities Act: Program Design and...Sam Rosen
 
SCOPE OF HIGHER EDUCATION AND RESEARCH IN URBAN FORESTRY, LANDSCAPE& URBAN B...
SCOPE	OF	HIGHER	EDUCATION	AND	 RESEARCH	IN	URBAN	FORESTRY, LANDSCAPE&	URBAN	B...SCOPE	OF	HIGHER	EDUCATION	AND	 RESEARCH	IN	URBAN	FORESTRY, LANDSCAPE&	URBAN	B...
SCOPE OF HIGHER EDUCATION AND RESEARCH IN URBAN FORESTRY, LANDSCAPE& URBAN B...Anchal Garg
 
GEO242_Win0607_LPTree_final_report
GEO242_Win0607_LPTree_final_reportGEO242_Win0607_LPTree_final_report
GEO242_Win0607_LPTree_final_reportKimberly Frye
 
Assessment of Forest Stock and Encroachment on Forest Land in Sonbhadra Fores...
Assessment of Forest Stock and Encroachment on Forest Land in Sonbhadra Fores...Assessment of Forest Stock and Encroachment on Forest Land in Sonbhadra Fores...
Assessment of Forest Stock and Encroachment on Forest Land in Sonbhadra Fores...IRJET Journal
 
Davey Natural Resources Consulting Overview
Davey Natural Resources Consulting OverviewDavey Natural Resources Consulting Overview
Davey Natural Resources Consulting Overviewjennygulick
 
Eco-Logical GIS
Eco-Logical GISEco-Logical GIS
Eco-Logical GISBill Bass
 
Esri Solutions for Water Resources Management
Esri Solutions for Water Resources ManagementEsri Solutions for Water Resources Management
Esri Solutions for Water Resources ManagementEsri
 

Similar to Spring 2013 (20)

Esri News for Federal Government Winter 2012/2013 issue
Esri News for Federal Government Winter 2012/2013 issueEsri News for Federal Government Winter 2012/2013 issue
Esri News for Federal Government Winter 2012/2013 issue
 
Role of gis in climate change
Role of gis in climate changeRole of gis in climate change
Role of gis in climate change
 
Esri News for State and Local Government Spring 2013 issue
Esri News for State and Local Government Spring 2013 issueEsri News for State and Local Government Spring 2013 issue
Esri News for State and Local Government Spring 2013 issue
 
miami_dade_2008
miami_dade_2008miami_dade_2008
miami_dade_2008
 
Esri News for Water Resources Winter 2012/2013 newsletter
Esri News for Water Resources Winter 2012/2013 newsletterEsri News for Water Resources Winter 2012/2013 newsletter
Esri News for Water Resources Winter 2012/2013 newsletter
 
Esri News for Agriculture Spring 2013 issue
Esri News for Agriculture Spring 2013 issueEsri News for Agriculture Spring 2013 issue
Esri News for Agriculture Spring 2013 issue
 
Calculating the Value of Green
Calculating the Value of GreenCalculating the Value of Green
Calculating the Value of Green
 
GEOG2900 Project Proposal
GEOG2900 Project ProposalGEOG2900 Project Proposal
GEOG2900 Project Proposal
 
Project Proposal
Project ProposalProject Proposal
Project Proposal
 
Using AI to Tackle Global Environmental Challenges
Using AI to Tackle Global Environmental ChallengesUsing AI to Tackle Global Environmental Challenges
Using AI to Tackle Global Environmental Challenges
 
Signed_StrategicEnergy_Framework_01_14_11-3
Signed_StrategicEnergy_Framework_01_14_11-3Signed_StrategicEnergy_Framework_01_14_11-3
Signed_StrategicEnergy_Framework_01_14_11-3
 
NISAR NASA-ISRO Synthetic Aperture Radar (NISAR) Forest Resources
NISAR NASA-ISRO Synthetic Aperture Radar (NISAR) Forest ResourcesNISAR NASA-ISRO Synthetic Aperture Radar (NISAR) Forest Resources
NISAR NASA-ISRO Synthetic Aperture Radar (NISAR) Forest Resources
 
The Restoring Healthy Forests for Healthy Communities Act: Program Design and...
The Restoring Healthy Forests for Healthy Communities Act: Program Design and...The Restoring Healthy Forests for Healthy Communities Act: Program Design and...
The Restoring Healthy Forests for Healthy Communities Act: Program Design and...
 
SCOPE OF HIGHER EDUCATION AND RESEARCH IN URBAN FORESTRY, LANDSCAPE& URBAN B...
SCOPE	OF	HIGHER	EDUCATION	AND	 RESEARCH	IN	URBAN	FORESTRY, LANDSCAPE&	URBAN	B...SCOPE	OF	HIGHER	EDUCATION	AND	 RESEARCH	IN	URBAN	FORESTRY, LANDSCAPE&	URBAN	B...
SCOPE OF HIGHER EDUCATION AND RESEARCH IN URBAN FORESTRY, LANDSCAPE& URBAN B...
 
GIS for NGOs
GIS for NGOsGIS for NGOs
GIS for NGOs
 
GEO242_Win0607_LPTree_final_report
GEO242_Win0607_LPTree_final_reportGEO242_Win0607_LPTree_final_report
GEO242_Win0607_LPTree_final_report
 
Assessment of Forest Stock and Encroachment on Forest Land in Sonbhadra Fores...
Assessment of Forest Stock and Encroachment on Forest Land in Sonbhadra Fores...Assessment of Forest Stock and Encroachment on Forest Land in Sonbhadra Fores...
Assessment of Forest Stock and Encroachment on Forest Land in Sonbhadra Fores...
 
Davey Natural Resources Consulting Overview
Davey Natural Resources Consulting OverviewDavey Natural Resources Consulting Overview
Davey Natural Resources Consulting Overview
 
Eco-Logical GIS
Eco-Logical GISEco-Logical GIS
Eco-Logical GIS
 
Esri Solutions for Water Resources Management
Esri Solutions for Water Resources ManagementEsri Solutions for Water Resources Management
Esri Solutions for Water Resources Management
 

More from Esri

INIA- CISA: Análisis de las amenazas en la fauna silvestre
INIA- CISA: Análisis de las amenazas en la fauna silvestreINIA- CISA: Análisis de las amenazas en la fauna silvestre
INIA- CISA: Análisis de las amenazas en la fauna silvestreEsri
 
Aena Aeropuerto Adolfo Suárez-Barajas crea potentes aplicaciones para sus cli...
Aena Aeropuerto Adolfo Suárez-Barajas crea potentes aplicaciones para sus cli...Aena Aeropuerto Adolfo Suárez-Barajas crea potentes aplicaciones para sus cli...
Aena Aeropuerto Adolfo Suárez-Barajas crea potentes aplicaciones para sus cli...Esri
 
Plataforma Smart City de Móstoles
Plataforma Smart City de MóstolesPlataforma Smart City de Móstoles
Plataforma Smart City de MóstolesEsri
 
ArcGIS Online para Organizaciones
ArcGIS Online para OrganizacionesArcGIS Online para Organizaciones
ArcGIS Online para OrganizacionesEsri
 
Molina de Segura se convierte en una smart city
Molina de Segura se convierte en una smart cityMolina de Segura se convierte en una smart city
Molina de Segura se convierte en una smart cityEsri
 
Portal for ArcGIS
Portal for ArcGISPortal for ArcGIS
Portal for ArcGISEsri
 
GIS-Based Web Services Provide Rapid Analysis and Dissemination of Maritime Data
GIS-Based Web Services Provide Rapid Analysis and Dissemination of Maritime DataGIS-Based Web Services Provide Rapid Analysis and Dissemination of Maritime Data
GIS-Based Web Services Provide Rapid Analysis and Dissemination of Maritime DataEsri
 
An Effective Tool for Drinking Water Protection
An Effective Tool for Drinking Water ProtectionAn Effective Tool for Drinking Water Protection
An Effective Tool for Drinking Water ProtectionEsri
 
GeoCollector for ArcPad
GeoCollector for ArcPadGeoCollector for ArcPad
GeoCollector for ArcPadEsri
 
GeoCollector for ArcGIS for Windows Mobile
GeoCollector for ArcGIS for Windows MobileGeoCollector for ArcGIS for Windows Mobile
GeoCollector for ArcGIS for Windows MobileEsri
 
Data Appliance for ArcGIS
Data Appliance for ArcGISData Appliance for ArcGIS
Data Appliance for ArcGISEsri
 
Esri and BlackBridge
Esri and BlackBridgeEsri and BlackBridge
Esri and BlackBridgeEsri
 
GeoPlanner for ArcGIS
GeoPlanner for ArcGISGeoPlanner for ArcGIS
GeoPlanner for ArcGISEsri
 
Esri and AccuWeather
Esri and AccuWeatherEsri and AccuWeather
Esri and AccuWeatherEsri
 
Esri and Airbus Defense & Space
Esri and Airbus Defense & SpaceEsri and Airbus Defense & Space
Esri and Airbus Defense & SpaceEsri
 
Esri US Data Fact Sheet
Esri US Data Fact SheetEsri US Data Fact Sheet
Esri US Data Fact SheetEsri
 
ArcGIS for Server on Microsoft Azure Jumpstart
ArcGIS for Server on Microsoft Azure JumpstartArcGIS for Server on Microsoft Azure Jumpstart
ArcGIS for Server on Microsoft Azure JumpstartEsri
 
ArcGIS for the Military--Maritime Operations
ArcGIS for the Military--Maritime OperationsArcGIS for the Military--Maritime Operations
ArcGIS for the Military--Maritime OperationsEsri
 
Esri Geoportal Server
Esri Geoportal ServerEsri Geoportal Server
Esri Geoportal ServerEsri
 
ArcGIS GeoEvent Extension for Server
ArcGIS GeoEvent Extension for ServerArcGIS GeoEvent Extension for Server
ArcGIS GeoEvent Extension for ServerEsri
 

More from Esri (20)

INIA- CISA: Análisis de las amenazas en la fauna silvestre
INIA- CISA: Análisis de las amenazas en la fauna silvestreINIA- CISA: Análisis de las amenazas en la fauna silvestre
INIA- CISA: Análisis de las amenazas en la fauna silvestre
 
Aena Aeropuerto Adolfo Suárez-Barajas crea potentes aplicaciones para sus cli...
Aena Aeropuerto Adolfo Suárez-Barajas crea potentes aplicaciones para sus cli...Aena Aeropuerto Adolfo Suárez-Barajas crea potentes aplicaciones para sus cli...
Aena Aeropuerto Adolfo Suárez-Barajas crea potentes aplicaciones para sus cli...
 
Plataforma Smart City de Móstoles
Plataforma Smart City de MóstolesPlataforma Smart City de Móstoles
Plataforma Smart City de Móstoles
 
ArcGIS Online para Organizaciones
ArcGIS Online para OrganizacionesArcGIS Online para Organizaciones
ArcGIS Online para Organizaciones
 
Molina de Segura se convierte en una smart city
Molina de Segura se convierte en una smart cityMolina de Segura se convierte en una smart city
Molina de Segura se convierte en una smart city
 
Portal for ArcGIS
Portal for ArcGISPortal for ArcGIS
Portal for ArcGIS
 
GIS-Based Web Services Provide Rapid Analysis and Dissemination of Maritime Data
GIS-Based Web Services Provide Rapid Analysis and Dissemination of Maritime DataGIS-Based Web Services Provide Rapid Analysis and Dissemination of Maritime Data
GIS-Based Web Services Provide Rapid Analysis and Dissemination of Maritime Data
 
An Effective Tool for Drinking Water Protection
An Effective Tool for Drinking Water ProtectionAn Effective Tool for Drinking Water Protection
An Effective Tool for Drinking Water Protection
 
GeoCollector for ArcPad
GeoCollector for ArcPadGeoCollector for ArcPad
GeoCollector for ArcPad
 
GeoCollector for ArcGIS for Windows Mobile
GeoCollector for ArcGIS for Windows MobileGeoCollector for ArcGIS for Windows Mobile
GeoCollector for ArcGIS for Windows Mobile
 
Data Appliance for ArcGIS
Data Appliance for ArcGISData Appliance for ArcGIS
Data Appliance for ArcGIS
 
Esri and BlackBridge
Esri and BlackBridgeEsri and BlackBridge
Esri and BlackBridge
 
GeoPlanner for ArcGIS
GeoPlanner for ArcGISGeoPlanner for ArcGIS
GeoPlanner for ArcGIS
 
Esri and AccuWeather
Esri and AccuWeatherEsri and AccuWeather
Esri and AccuWeather
 
Esri and Airbus Defense & Space
Esri and Airbus Defense & SpaceEsri and Airbus Defense & Space
Esri and Airbus Defense & Space
 
Esri US Data Fact Sheet
Esri US Data Fact SheetEsri US Data Fact Sheet
Esri US Data Fact Sheet
 
ArcGIS for Server on Microsoft Azure Jumpstart
ArcGIS for Server on Microsoft Azure JumpstartArcGIS for Server on Microsoft Azure Jumpstart
ArcGIS for Server on Microsoft Azure Jumpstart
 
ArcGIS for the Military--Maritime Operations
ArcGIS for the Military--Maritime OperationsArcGIS for the Military--Maritime Operations
ArcGIS for the Military--Maritime Operations
 
Esri Geoportal Server
Esri Geoportal ServerEsri Geoportal Server
Esri Geoportal Server
 
ArcGIS GeoEvent Extension for Server
ArcGIS GeoEvent Extension for ServerArcGIS GeoEvent Extension for Server
ArcGIS GeoEvent Extension for Server
 

Recently uploaded

Tampa BSides - Chef's Tour of Microsoft Security Adoption Framework (SAF)
Tampa BSides - Chef's Tour of Microsoft Security Adoption Framework (SAF)Tampa BSides - Chef's Tour of Microsoft Security Adoption Framework (SAF)
Tampa BSides - Chef's Tour of Microsoft Security Adoption Framework (SAF)Mark Simos
 
Gen AI in Business - Global Trends Report 2024.pdf
Gen AI in Business - Global Trends Report 2024.pdfGen AI in Business - Global Trends Report 2024.pdf
Gen AI in Business - Global Trends Report 2024.pdfAddepto
 
Scanning the Internet for External Cloud Exposures via SSL Certs
Scanning the Internet for External Cloud Exposures via SSL CertsScanning the Internet for External Cloud Exposures via SSL Certs
Scanning the Internet for External Cloud Exposures via SSL CertsRizwan Syed
 
My INSURER PTE LTD - Insurtech Innovation Award 2024
My INSURER PTE LTD - Insurtech Innovation Award 2024My INSURER PTE LTD - Insurtech Innovation Award 2024
My INSURER PTE LTD - Insurtech Innovation Award 2024The Digital Insurer
 
Developer Data Modeling Mistakes: From Postgres to NoSQL
Developer Data Modeling Mistakes: From Postgres to NoSQLDeveloper Data Modeling Mistakes: From Postgres to NoSQL
Developer Data Modeling Mistakes: From Postgres to NoSQLScyllaDB
 
"Federated learning: out of reach no matter how close",Oleksandr Lapshyn
"Federated learning: out of reach no matter how close",Oleksandr Lapshyn"Federated learning: out of reach no matter how close",Oleksandr Lapshyn
"Federated learning: out of reach no matter how close",Oleksandr LapshynFwdays
 
Leverage Zilliz Serverless - Up to 50X Saving for Your Vector Storage Cost
Leverage Zilliz Serverless - Up to 50X Saving for Your Vector Storage CostLeverage Zilliz Serverless - Up to 50X Saving for Your Vector Storage Cost
Leverage Zilliz Serverless - Up to 50X Saving for Your Vector Storage CostZilliz
 
Ensuring Technical Readiness For Copilot in Microsoft 365
Ensuring Technical Readiness For Copilot in Microsoft 365Ensuring Technical Readiness For Copilot in Microsoft 365
Ensuring Technical Readiness For Copilot in Microsoft 3652toLead Limited
 
Artificial intelligence in cctv survelliance.pptx
Artificial intelligence in cctv survelliance.pptxArtificial intelligence in cctv survelliance.pptx
Artificial intelligence in cctv survelliance.pptxhariprasad279825
 
Kotlin Multiplatform & Compose Multiplatform - Starter kit for pragmatics
Kotlin Multiplatform & Compose Multiplatform - Starter kit for pragmaticsKotlin Multiplatform & Compose Multiplatform - Starter kit for pragmatics
Kotlin Multiplatform & Compose Multiplatform - Starter kit for pragmaticscarlostorres15106
 
"Subclassing and Composition – A Pythonic Tour of Trade-Offs", Hynek Schlawack
"Subclassing and Composition – A Pythonic Tour of Trade-Offs", Hynek Schlawack"Subclassing and Composition – A Pythonic Tour of Trade-Offs", Hynek Schlawack
"Subclassing and Composition – A Pythonic Tour of Trade-Offs", Hynek SchlawackFwdays
 
Unleash Your Potential - Namagunga Girls Coding Club
Unleash Your Potential - Namagunga Girls Coding ClubUnleash Your Potential - Namagunga Girls Coding Club
Unleash Your Potential - Namagunga Girls Coding ClubKalema Edgar
 
Bun (KitWorks Team Study 노별마루 발표 2024.4.22)
Bun (KitWorks Team Study 노별마루 발표 2024.4.22)Bun (KitWorks Team Study 노별마루 발표 2024.4.22)
Bun (KitWorks Team Study 노별마루 발표 2024.4.22)Wonjun Hwang
 
SIP trunking in Janus @ Kamailio World 2024
SIP trunking in Janus @ Kamailio World 2024SIP trunking in Janus @ Kamailio World 2024
SIP trunking in Janus @ Kamailio World 2024Lorenzo Miniero
 
DevoxxFR 2024 Reproducible Builds with Apache Maven
DevoxxFR 2024 Reproducible Builds with Apache MavenDevoxxFR 2024 Reproducible Builds with Apache Maven
DevoxxFR 2024 Reproducible Builds with Apache MavenHervé Boutemy
 
Transcript: New from BookNet Canada for 2024: BNC CataList - Tech Forum 2024
Transcript: New from BookNet Canada for 2024: BNC CataList - Tech Forum 2024Transcript: New from BookNet Canada for 2024: BNC CataList - Tech Forum 2024
Transcript: New from BookNet Canada for 2024: BNC CataList - Tech Forum 2024BookNet Canada
 
SAP Build Work Zone - Overview L2-L3.pptx
SAP Build Work Zone - Overview L2-L3.pptxSAP Build Work Zone - Overview L2-L3.pptx
SAP Build Work Zone - Overview L2-L3.pptxNavinnSomaal
 
Dev Dives: Streamline document processing with UiPath Studio Web
Dev Dives: Streamline document processing with UiPath Studio WebDev Dives: Streamline document processing with UiPath Studio Web
Dev Dives: Streamline document processing with UiPath Studio WebUiPathCommunity
 
Install Stable Diffusion in windows machine
Install Stable Diffusion in windows machineInstall Stable Diffusion in windows machine
Install Stable Diffusion in windows machinePadma Pradeep
 
Powerpoint exploring the locations used in television show Time Clash
Powerpoint exploring the locations used in television show Time ClashPowerpoint exploring the locations used in television show Time Clash
Powerpoint exploring the locations used in television show Time Clashcharlottematthew16
 

Recently uploaded (20)

Tampa BSides - Chef's Tour of Microsoft Security Adoption Framework (SAF)
Tampa BSides - Chef's Tour of Microsoft Security Adoption Framework (SAF)Tampa BSides - Chef's Tour of Microsoft Security Adoption Framework (SAF)
Tampa BSides - Chef's Tour of Microsoft Security Adoption Framework (SAF)
 
Gen AI in Business - Global Trends Report 2024.pdf
Gen AI in Business - Global Trends Report 2024.pdfGen AI in Business - Global Trends Report 2024.pdf
Gen AI in Business - Global Trends Report 2024.pdf
 
Scanning the Internet for External Cloud Exposures via SSL Certs
Scanning the Internet for External Cloud Exposures via SSL CertsScanning the Internet for External Cloud Exposures via SSL Certs
Scanning the Internet for External Cloud Exposures via SSL Certs
 
My INSURER PTE LTD - Insurtech Innovation Award 2024
My INSURER PTE LTD - Insurtech Innovation Award 2024My INSURER PTE LTD - Insurtech Innovation Award 2024
My INSURER PTE LTD - Insurtech Innovation Award 2024
 
Developer Data Modeling Mistakes: From Postgres to NoSQL
Developer Data Modeling Mistakes: From Postgres to NoSQLDeveloper Data Modeling Mistakes: From Postgres to NoSQL
Developer Data Modeling Mistakes: From Postgres to NoSQL
 
"Federated learning: out of reach no matter how close",Oleksandr Lapshyn
"Federated learning: out of reach no matter how close",Oleksandr Lapshyn"Federated learning: out of reach no matter how close",Oleksandr Lapshyn
"Federated learning: out of reach no matter how close",Oleksandr Lapshyn
 
Leverage Zilliz Serverless - Up to 50X Saving for Your Vector Storage Cost
Leverage Zilliz Serverless - Up to 50X Saving for Your Vector Storage CostLeverage Zilliz Serverless - Up to 50X Saving for Your Vector Storage Cost
Leverage Zilliz Serverless - Up to 50X Saving for Your Vector Storage Cost
 
Ensuring Technical Readiness For Copilot in Microsoft 365
Ensuring Technical Readiness For Copilot in Microsoft 365Ensuring Technical Readiness For Copilot in Microsoft 365
Ensuring Technical Readiness For Copilot in Microsoft 365
 
Artificial intelligence in cctv survelliance.pptx
Artificial intelligence in cctv survelliance.pptxArtificial intelligence in cctv survelliance.pptx
Artificial intelligence in cctv survelliance.pptx
 
Kotlin Multiplatform & Compose Multiplatform - Starter kit for pragmatics
Kotlin Multiplatform & Compose Multiplatform - Starter kit for pragmaticsKotlin Multiplatform & Compose Multiplatform - Starter kit for pragmatics
Kotlin Multiplatform & Compose Multiplatform - Starter kit for pragmatics
 
"Subclassing and Composition – A Pythonic Tour of Trade-Offs", Hynek Schlawack
"Subclassing and Composition – A Pythonic Tour of Trade-Offs", Hynek Schlawack"Subclassing and Composition – A Pythonic Tour of Trade-Offs", Hynek Schlawack
"Subclassing and Composition – A Pythonic Tour of Trade-Offs", Hynek Schlawack
 
Unleash Your Potential - Namagunga Girls Coding Club
Unleash Your Potential - Namagunga Girls Coding ClubUnleash Your Potential - Namagunga Girls Coding Club
Unleash Your Potential - Namagunga Girls Coding Club
 
Bun (KitWorks Team Study 노별마루 발표 2024.4.22)
Bun (KitWorks Team Study 노별마루 발표 2024.4.22)Bun (KitWorks Team Study 노별마루 발표 2024.4.22)
Bun (KitWorks Team Study 노별마루 발표 2024.4.22)
 
SIP trunking in Janus @ Kamailio World 2024
SIP trunking in Janus @ Kamailio World 2024SIP trunking in Janus @ Kamailio World 2024
SIP trunking in Janus @ Kamailio World 2024
 
DevoxxFR 2024 Reproducible Builds with Apache Maven
DevoxxFR 2024 Reproducible Builds with Apache MavenDevoxxFR 2024 Reproducible Builds with Apache Maven
DevoxxFR 2024 Reproducible Builds with Apache Maven
 
Transcript: New from BookNet Canada for 2024: BNC CataList - Tech Forum 2024
Transcript: New from BookNet Canada for 2024: BNC CataList - Tech Forum 2024Transcript: New from BookNet Canada for 2024: BNC CataList - Tech Forum 2024
Transcript: New from BookNet Canada for 2024: BNC CataList - Tech Forum 2024
 
SAP Build Work Zone - Overview L2-L3.pptx
SAP Build Work Zone - Overview L2-L3.pptxSAP Build Work Zone - Overview L2-L3.pptx
SAP Build Work Zone - Overview L2-L3.pptx
 
Dev Dives: Streamline document processing with UiPath Studio Web
Dev Dives: Streamline document processing with UiPath Studio WebDev Dives: Streamline document processing with UiPath Studio Web
Dev Dives: Streamline document processing with UiPath Studio Web
 
Install Stable Diffusion in windows machine
Install Stable Diffusion in windows machineInstall Stable Diffusion in windows machine
Install Stable Diffusion in windows machine
 
Powerpoint exploring the locations used in television show Time Clash
Powerpoint exploring the locations used in television show Time ClashPowerpoint exploring the locations used in television show Time Clash
Powerpoint exploring the locations used in television show Time Clash
 

Spring 2013

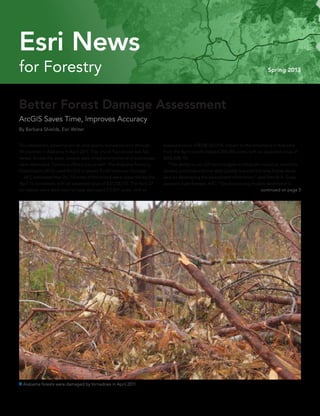
  • 1. for Forestry Spring 2013 Esri News Better Forest Damage Assessment ArcGIS Saves Time, Improves Accuracy By Barbara Shields, Esri Writer Thunderstorms, powerful winds, and deadly tornadoes tore through 39 counties in Alabama in April 2011. The city of Tuscaloosa was flat- tened. Across the state, people were killed and homes and businesses were destroyed. Forests suffered loss as well. The Alabama Forestry Commission (AFC) used ArcGIS to assess forest resource damage. AFC estimated that 26,733 acres of forestland were impacted by the April 15 tornadoes, with an assessed value of $37,728,175. The April 27 tornadoes were estimated to have damaged 177,857 acres, with an  Alabama forests were damaged by tornadoes in April 2011. assessed value of $228,360,576. Impact to the forestland in Alabama from the April storms totaled 204,590 acres, with an assessed value of $266,088,751. “The ability to use GIS technologies to integrate cadastral, remotely sensed, and observational data greatly reduced the time frame neces- sary for developing the assessment information,” said Patrick A. Glass, assistant state forester, AFC. “Geoprocessing models developed in continued on page 3
  • 2. Spring 2013 Esri News for Forestry is a publication of the Forestry Group of Esri. To contact the Esri Desktop Order Center, call 1-800-447-9778 within the United States or 909-793-2853, extension 1-1235, outside the United States. Visit the Esri website at esri.com. View Esri News for Forestry online at esri.com/forestry or scan the code below with your smartphone. Advertise with Us E-mail ads@esri.com. Submit Content To submit articles for publication in Esri News for Forestry, contact Barbara Shields at bshields@esri.com. Manage Your Subscription To update your mailing address or subscribe or unsubscribe to Esri publications, visit esri.com/publications. International customers should contact an Esri distributor to manage their subscriptions. For a directory of distributors, visit esri.com/distributors. Circulation Services For back issues, missed issues, and other circulation services, e-mail requests@esri.com; call 909-793-2853, extension 2778; or fax 909-798-0560. 2 Esri News for Forestry  Spring 2013 Contents The information contained in this work is the exclusive property of Esri or its licensors. This work is protected under United States copyright law and other international copyright treaties and conventions. No part of this work may be reproduced or transmitted in any form or by any means, electronic or mechanical, including photocopying and recording, or by any information storage or retrieval system, except as expressly permitted in writing by Esri. All requests should be sent to Attention: Contracts and Legal Services Manager, Esri, 380 New York Street, Redlands, CA 92373-8100 USA. The information contained in this work is subject to change without notice. The Geographic Advantage, Esri, the Esri globe logo, 3D Analyst, ArcAtlas, ArcCatalog, ArcData, ArcDoc, ArcEditor, ArcExplorer, ArcGIS, the ArcGIS logo, ArcGlobe, ArcIMS, ARC/INFO, ArcInfo, ArcLogistics, ArcMap, ArcNetwork, ArcNews, ArcObjects, ArcPad, ArcPress, ArcReader, ArcSDE, ArcSurvey, ArcToolbox, ArcTools, ArcUser, ArcView, ArcVoyager, ArcWatch, ArcWeb, ArcWorld, ArcXML, Business Analyst Online, BusinessMAP, CommunityInfo, EDN, Geography Network, GIS Day, MapData, MapObjects, Maplex, MapStudio, ModelBuilder, MOLE, NetEngine, RouteMAP, SDE, Sourcebook•America, StreetMap, Tapestry, @esri.com, esri.com, arcgis. com, geographynetwork.com, gis.com, and gisday.com are trademarks, service marks, or registered marks of Esri in the United States, the European Community, or certain other jurisdictions. Other companies and products or services mentioned herein may be trademarks, service marks, or registered marks of their respective mark owners. Copyright © 2013 Esri. All rights reserved. Printed in the United States of America. 1 Better Forest Damage Assessment 4 Clinton Climate Initiative Uses GIS to Preserve and Regrow Forests 5 Quickly and Easily Use Landsat Data with ArcGIS Online 6 Researchers Develop an Effective Approach to Forest Cover Analysis 8 USDA Forest Service FUSION Offers Powerful Lidar Tools 10 Create a Map in Seven Steps 11 Attend a Conference Just for You 11 Esri Invites You to Join the Forestry Group 11 On the Road
  • 3. response to the April tornadoes allowed for unprece- dented speed and precision in producing results that are portable and scalable to any significant geographic area.” AFC collected GPS Exchange Format (GPX) files on the tornado paths and converted them to feature classes for GIS analysis to meet agency objectives. AFC GIS specialist Abi Dhakal was tasked to create maps for analyzing and assessing the total forest damage by acre, by county, and for the entire state. Dhakal created a GIS model that significantly reduced the time to produce these geospatial products. Manually geoprocessing data for 39 counties individu- ally and generating maps for tornado damage analysis would have taken weeks, if not months, to complete. Instead, Dhakal built a GIS model that included batch processing, which allowed him to quickly and efficiently render processes on multiple datasets. He easily ac- cessed ArcGIS tools—such as Select, Intersect, Buffer, Clip, and Tabulate Area—in the geoprocessing models. Dhakal designed more than a dozen geoprocesses and steps to produce results. By slightly tweaking the models, he could adapt subtle changes in analysis objectives. Initially, it took him a few days to develop the GIS model, but upon completion, the model ran data for multiple counties through geoprocesses and created damage analysis maps in just a few minutes. Next, Dhakal and Glass used Forest Inventory & Analysis (FIA) data outside the model to calculate the volume of timber loss. Finally, they applied Timber-Mart South standing timber prices to the volume loss and calculated tornado damage to the forests in US dollar amounts. The results of the analysis were used by Alabama’s congressional delegation to document a supplemental funding request for the USDA Farm Service Agency’s Emergency Forest Restoration Program. Results were also used by AFC, Alabama Forestry Recovery Task Force, Alabama Cooperative Extension Service, and other agencies to manage recovery of the forest resources. For more information about the forest damage assessment model, contact Abi Dhakal at abi.dhakal@forestry.alabama.gov.  To assess forest types impacted by two tornadoes, a model used tornado path polygons derived from aerial reconnaissance, the National Land Cover Dataset (NLCD), and parcel data. Data from Esri, AFC, NOSS NWS, and the US Geological Survey (USGS) was also used.  The volume of timber damage was calculated for each of the 39 Alabama counties impacted by the tornadoes. Data is from AFC, Esri, NLCD, and USGS. 3Spring 2013 esri.com/forestry Better Forest Damage Assessment  continued from cover
  • 4. Clinton Climate Initiative Uses GIS to Preserve and Regrow Forests security, viability of coastal cities, and water availability around the world.  To reduce emissions, governments and economies must use less fossil fuels and increase the use of energy-efficient and renewable technologies. The CCI Forestry Program focuses on helping developing countries reverse deforestation and plant new trees. By showing that they can monitor and verify the reduction of their carbon dioxide emissions, countries become eligible for fund- ing to manage their forest programs and other low-carbon economic activities. CCI uses GIS technology as a centerpiece of forest carbon measurement, reporting, and verification (MRV) systems for develop- ing countries. GIS is one of three legs of the platform—data, models, and GIS—that allow  CCI used GIS to measure carbon and compute carbon credits that were used to preserve this forest in Guyana. 4 Esri News for Forestry  Spring 2013 The Clinton Climate Initiative (CCI) Forestry Program develops forestry projects and carbon measurement systems that help governments and local communities receive compensation for preserving and regrowing forests. CCI uses GIS technology to help countries monitor their carbon levels. Global warming is caused by increased carbon dioxide in the atmosphere from burn- ing fossil fuels, and deforestation accounts for about 15 percent of total carbon dioxide emissions in the world. Scientists predict that if governments and communities don’t take action to reduce carbon dioxide emissions, our world will face increasingly drastic con- sequences ranging from stronger heat waves to more droughts and floods to increasing sea level. All these affect agriculture, food countries to determine how much carbon they have, how it is changing, and how the drivers of deforestation and forest degradation can be monitored and adjusted as required.  With GIS in place for forestry, developing countries can be eligible for direct payments through international agreements based on the effectiveness of their MRV systems. Once in place, GIS can be used more broadly for other resource development, land surveys, and the determination of land tenure. For example, tree farming projects in Kenya help make forest conservation and restoration profitable for local communities. CCI is cur- rently working on 10 sustainable-forest man- agement projects, encompassing 644,000 hectares of land, that will benefit more than 353,000 people in forest-dependent commu- nities around the world. Esri awarded CCI the 2012 Special Achievement in GIS Award for helping the country of Guyana become eligible for $70 million in forest-based payments from the government of Norway. Guyana is now using this funding to facilitate specific elements of a low-carbon development plan envisioned and put in place by former Guyana president Bharrat Jagdeo. This project is part of the CCI Forestry Program and has been supported by the Rockefeller Foundation and the govern- ments of Norway and Australia. Read more about CCI’s forestry projects at clintonfoundation.org.  The Clinton Climate Initiative supports tree farming projects in Kenya. This Kenyan tree farmer is working in a nursery to conserve a local forest.
  • 5. Quickly and Easily Use Landsat Data with ArcGIS Online Landsat imagery is one of several remote sensor systems land analysts use to study vegetation, land use, soil conditions, and terrain. ArcGIS Online image services provide quick and simple access to free United States Department of the Interior’s US Geological Survey (USGS) Landsat data. These image services are based on the Global Land Survey (GLS) datasets created by USGS and the National Aeronautics and Space Administration (NASA). Landsat data supports global assessments of land cover, land cover change, and ecosystem dynamics such as disturbance and vegetation health. Landsat represents the world’s longest continuously acquired collection of space-based, moderate-resolution, land remote-sensing, data change research. It is more efficient than any other technology used to meet decision support requirements. Esri provides Landsat image services that enable users to explore important imagery information such as band combination analysis for natural color, infrared, vegetative change, and Normalized Difference Vegetation Index (NDVI). The user can also compare many years of imagery to see changes over time. Two Landsat viewers are available online to help users do just that—LandsatLook Viewer from USGS and ChangeMatters Viewer from Esri. Both of these viewers use ArcGIS technology to serve Landsat as web services, accessing many terabytes of imagery. LandsatLook Viewer provides access to the complete archive of USGS Landsat scenes going back to 1972. ChangeMatters Viewer provides access to the best cloud-free Landsat scenes from the five epochs, circa 1975, 1990, 2000, 2005, and 2010. It uses ArcGIS as its underlying technology to additionally process the Landsat GLS dataset on the fly into multiple data products. These are served as World Landsat Services on ArcGIS Online. The image service platform is also host to the Landsat community, a group that shares maps and applications using Landsat imagery.  This map is a mosaicked composite of data from the image service of the Landsat Global Land Survey (GLS) 2010 dataset and can be accessed on ArcGIS Online. This data has been enhanced with radiometric correction and histogram stretching to make it more visually appealing. 5Spring 2013 esri.com/forestry
  • 6. Researchers Develop an Effective Approach to Forest Cover Analysis By Aaron E. Maxwell, Remote Sensing Analyst, Natural Resource Analysis Center, West Virginia University Overwatch. The outcome was a statewide forest cover and forest fragmentation map created from raster data at a nine-meter cell size for the state of West Virginia. The project goal was to capture the spectral, textural, and land-use variability with defined classes. WVU researchers relied on object-based image analysis, which uses spectral and textural information within an image to extract thematic data. The pro- ject’s imagery was from the United States Department of Agriculture (USDA) Farm Service Agency. This was four-band, leaf-on, one-meter pixel size, uncompressed imagery State resource agencies model wildlife habitat to support the planning and management of natural resources. The most widely available land cover for states to use is the Landsat- derived National Land Cover Dataset (NLCD). Because of its coarse resolution (30 meters) and temporal lag to the current conditions, using the NLCD is a challenge for wildlife modeling at a local scale. Researchers from West Virginia University (WVU) created a more effective approach for modeling habitat. They implemented a GIS and remote-sensing meth- odology for creating statewide forest cover and forest fragmentation data layers.  Figure 1. This training data was derived from interpreting photo imagery as polygons in ArcGIS. This base imagery is 2011 NAIP orthophotography displayed in true color. The approach was to use publicly avail- able orthophotography from the National Agriculture Imagery Program (NAIP). This pro- vided better resolution for raster data layers, increased accuracy of forest cover analysis, and delineation of fragmented wildlife habi- tat. NAIP orthophotography has a one-meter cell size and four-band spectral information (true color bands and an infrared band). The photography is captured on a two-year cycle, so datasets can be regularly updated. The analyst used Esri’s ArcGIS 10 Desktop image analysis tools and tools from the Feature Analyst 5 extension for ArcGIS by 6 Esri News for Forestry  Spring 2013
  • 7. representing forest conditions during the 2011 growing season. The bulk of the researchers’ time was spent extracting cover from each image and classify- ing it as either forested/woody, grasslands/ herbaceous, or barren/nonvegetated cover. It was necessary to collect a large number of samples to accurately extract the cover of interest. Researchers spent from one to three hours creating training data, which contains examples of the cover types of interest. They manually interpreted photographs within the ArcGIS editor, using its functionality to create training data as vector and polygon features. This training data process allowed user input of vector data and generated examples of the cover of interest. Figure 1 shows an example of the training data digitized throughout the state. To extract cover, researchers used Feature Analyst 5 to process each image. The integra- tion of its extraction tools with ModelBuilder enabled users to complete mapping tasks in a timely manner. They visually inspected all outputs for accuracy and, when necessary, reprocessed outputs. Having completed this mapping task, re- searchers merged the resultant raster data to produce a statewide grid at a nine-meter cell size. They did this by using the Mosaic To New Raster tool in the ArcGIS Data Management toolbox. The outcome was a statewide forest cover map representing the 2011 growing- season conditions at a higher resolution than is currently available from existing datasets, such as the NLCD. Figure 2 shows the result- ant cover. To assess the accuracy of the forest cover data, researchers compared the cover extrac- tion to manual photograph interpretation at randomly selected point locations across the state. They streamed the 2011 NAIP ortho- photography through ArcGIS for Server, which was hosted by the Aerial Photography Field Office (APFO) of the USDA. This allowed them to quickly and easily access photography and assess the accuracy of the resultant cover. This approach yielded a forest cover map with accuracy that was greater than 90 percent. Forest fragmentation was created as a deriv- ative of the raster forest cover. First, researchers smoothed the resultant cover to provide a more general representation of fragmentation and to remove small canopy interruptions that were deemed too small to fragment the forest. To create the forest fragmentation data, they employed morphological image analysis, ap- plying mathematical morphology to analyze the shape and form of objects. Running the downloadable Landscape Fragmentation Tool (LFT) version 2.0 in ArcGIS, researchers mapped the types of fragmenta- tion present in specified land cover types, including patch, edge, perforated, and core, which is based on a specified edge width. To complete the processing, researchers segmented the state into manageable units and then merged the final results, ultimately producing a raster grid of statewide forest fragmentation with a nine-meter cell size. Figure 3 shows the fragmentation data. Project Team Aaron E. Maxwell, Natural Resource Analysis Center, West Virginia University, Morgantown, West Virginia; Michael P. Strager, Division of Forestry and Natural Resources, West Virginia University, Morgantown, West Virginia; Elise M. Austin, Natural Resource Analysis Center, West Virginia University, Morgantown, West Virginia  Figure 2. Researchers created thematic tree cover for West Virginia. They derived this coverage from 2011 NAIP orthophotography by using object-based image analysis tools in the Feature Analyst 5 extension for ArcGIS.  Figure 3: Forest researchers were able to derive this forest fragmentation data for West Virginia by using a script within ArcToolbox to extract forest cover thematic data layers. 7Spring 2013 esri.com/forestry
  • 8. Forest managers can now use lidar data in combination with GIS to help them assess forest inventories and create forest plans. The USDA Forest Service’s (USFS) FUSION software, combined with Esri’s ArcGIS, provides lidar analytic tools, a streamlined workflow, and functionality for storing, organizing, and sharing lidar .las files. Foresters can under- stand, explore, and analyze lidar data point clouds and interactively view them in 3D. Foresters use FUSION to quantify vegetation by extracting lidar point clouds and correlating them with forest inventory plots. It calcu- lates various canopy metrics, such as height statistics, to describe the canopy distribution and cover density ratios. FUSION then summarizes these ratios at the plot level or in a continuous grid cell format. It also performs a quality routine to assess the appropriateness of lidar point data for a forestry application. FUSION provides a robust ability to perform extensive point cloud analytics of forest inventory variables across large landscapes. The in- formation it extracts to describe the forest canopy is easily exported as an ASCII grid and imported into ArcGIS along with other GIS datasets (figure 1). USDA Forest Service FUSION Offers Powerful Lidar Tools  Figure 1. The user exported FUSION-derived lidar canopy metrics into ArcGIS to produce this map showing the first return percent canopy cover grid metric, produced at a 25-meter cell size, across approximately 85,000 acres in southeast Arizona.  Figure 2. The GIS grid layer (25 m cell size) represents the Basal Area inventory parameter model applied at the landscape level. This GIS layer is one of the end-user products that will be used for future decision making, analysis, and monitoring for the Pinaleño Sky Island study area. 8 Esri News for Forestry  Spring 2013
  • 9. Using ArcGIS Spatial Analyst, users apply conditional logic to the FUSION-derived canopy structure grids to extract pixels meeting certain criteria. For example, foresters can locate areas containing tall trees with relatively low canopy cover. FUSION Applied Over the past several years, a workflow incorporating ArcGIS and FUSION was implemented for a forest restoration effort in the Pinaleño Mountains of the Coronado National Forest in southeastern Arizona. To model forest inventory parameters, the team used regression analysis to determine the correlation between the parameters that were measured on field plots and the lidar canopy metrics that were summarized in FUSION and classified as subsets for each plot. Before applying the resultant statistical models to the landscape, team members used GIS to ensure the models were applied appropri- ately and successfully across the landscape. First, they applied a forest/ nonforest mask to ensure the models were applied only in forested areas. This was accomplished using the Spatial Analyst Conditional tool in ArcGIS and the canopy height and cover structure grid layers output from FUSION. Each pixel had to meet a minimum vegetation height of three meters and 2 percent canopy cover. All pixels that did not meet the criteria were masked out before models were applied across the study area. The final step was to apply the regression models created in the initial modeling steps to the appropriate ASCII grid layers. This generated continuous inventory parameter GIS layers covering the entire study area. Each calculation produced a new grid in which each 25-meter cell spatially represents the estimated forest inventory parameter of interest such as biomass, basal area, Lorey’s mean height, and timber volume (figure 2). The resultant GIS inventory layers were qualitatively validated by local experts and conformed well to trends known to occur on the landscape. The project team estimated that the cost for obtaining data suf- ficient to implement the Pinaleño Ecosystem Restoration Project using lidar was half the cost of traditional methods. Furthermore, capturing the lidar data to measure sample areas was easier than deploying field crews that could not safely measure trees in extreme terrain. Lidar made it possible for the team to create continuous coverage of all forested areas. FUSION software is currently managed by Robert McGaughey of the USDA Forest Service—Pacific Northwest Research Station. Download USFS FUSION software free of charge at http://forsys.cfr.washington .edu/fusion/fusionlatest.html. For more information, tutorials, and sample lidar datasets, visit the USFS Remote Sensing Applications Center at www.fs.fed.us/eng/rsac. Learn more about FUSION by contacting Ron Behrendt, managing member, Behron LLC, at behron@centurytel.net. 9Spring 2013 esri.com/forestry
  • 10. Create a Map in Seven Steps ArcGIS Online is the mapping platform for your organization. CEOs, staff, and contractors can access maps and data for their work. See opportunities and gain insight into your data. Do this quickly with no data to install. Create an ArcGIS Online forest map in seven steps at arcgis.com. Click Sign In and note the ribbon on the top of the page. Click the word ArcGIS to get to the ArcGIS Online page. Let’s get started. 1. Open a map: Click Make a Map, and you see a map of the United States. 2. Create the basemap: Click Basemap and select Light Gray Canvas. 3. Add a data layer: Click the Add button on the ribbon; select Search for layers; and in the Find field, type “USFS Ecological Subregions” (the In field should say “ArcGIS Online”) and click Go. When the layer appears, click Add beside the layer title. 4. To add another layer package, go to the Find field and type “USGS Forest Fragmentation”. Add it to your map. 5. At the bottom of the Search for layers to add section, click the Done Adding Layers button. 6. See your layers in the table of contents. Point to a layer title and click the arrow to its right. Play with the zoom, transparency, and visibility tools and set them to your preference. 7. Click Save to save your map in your account folder. Explore your map. Click the layer title to see the map’s data layer contents and select what you want to see. Above the Contents line, pause your mouse pointer over an icon to see its function. Click Show Map Legend to open it and click again to close it. Click the data layer to select subsets on the map. Zoom to see greater detail. Click on the map to get specific information. Click the Details button on the ribbon to turn the contents column on and off. ArcGIS Online is a service that lets you use GIS software and data. Create maps that tell your story, build applications, and more. Sign up for a 30-day free trial subscription at arcgis.com.  The USDA Forest Service published this map of ecological subregions.  This map shows forest fragmentation risk.  By combining two layers, the reader can see forest fragmentation risk by ecological regions. The result has been saved and published for public use. 10 Esri News for Forestry  Spring 2013
  • 11. Join forestry professionals from around the world at the Esri Forestry GIS Conference, which is hosted by the Esri Forestry Group. You will meet with a community of GIS for forestry users, share ideas, hear best practices, and talk to experts. This year’s theme is Benefiting from Change: Realizing the Value of GIS in Forest Management. The conference offers a hands-on work- shop for you to develop your forestry GIS skills. You can also attend sessions that explore these topics: •• Forest spatial optimization •• Integrating data and systems •• Automated workflows •• A complete desktop, web, and mobile system •• Image management, classification, and analysis •• Web applications and services for many user types Esri Forestry GIS Conference May 14–16, 2013 | Esri Headquarters, Redlands, California For more information and to register, visit esri.com/events/forestry. Mark Your Calendar Western Forestry Leadership Coalition (WFLC) April 29–May 1, 2013 Denver, Colorado, USA wflccenter.org Esri Forestry GIS Conference May 14–16, 2013 Redlands, California, USA esri.com/events/forestry 2013 Southern Group of State Foresters (SGSF) Summer Meeting June 3–6, 2013 Savannah, Georgia, USA www.southernforests.org ElmiaWood June 5–8, 2013 Jönköping, Sweden elmia.se/en/wood The Association of Consulting Foresters National Conference June 21–25, 2013 Keystone, Colorado, USA www.acf-foresters.org Esri International User Conference July 8–12, 2013 San Diego, California, USA esri.com/uc Remsoft Modeling Conference and User Group September 9–13, 2013 Fredericton, New Brunswick, Canada remsoft.com National Association of State Foresters September 22–26, 2013 Hot Springs, Virginia, USA stateforesters.org Society of American Foresters National Convention October 23–27, 2013 Charleston, South Carolina, USA safnet.org Western Forestry Leadership Coalition (WFLC) Fall Meeting October 28–30, 2013 San Diego, California, USA wflccenter.org COP 19 November 2013 Warsaw, Poland polandcop19.org Southern Forestry and Natural Resource Management Conference December 8–10, 2013 Athens, Georgia, USA www.soforgis.net/2013 On the RoadAttend a Conference Just for You Esri invites you to join the Esri Forestry Group (EFG). Your participation in this dynamic group will help you get more from your GIS and your forest and land management data. Meet like-minded professionals, share experiences, and exchange knowledge. Become a Member •• Community: Connect with a community of professionals passionate about GIS. •• Information: Stay current on Esri forestry products, events, webinars, and resources. •• Solutions: Learn about forestry GIS tools, applications, and projects. Join today or renew your membership at esri.com/efg. Esri Invites You to Join the Forestry Group 11Spring 2013 esri.com/forestry
  • 12. Presorted Standard US Postage Paid Esri 380 New York Street Redlands, California 92373-8100  usa Grow Your Investment With Esri® Technology, you can run your daily operations without losing sight of the big picture. We have the analysis, modeling, and asset management tools that you need to save time, reduce risks, and lower costs. Copyright © 2013 Esri. All rights reserved. Learn more at esri.com/forestry 133839  QUAD15.3M4/13tk