
Recommended
Recommended
More Related Content
What's hot
What's hot (20)
Similar to Socio-Economic Benefits from Indian Winery
Similar to Socio-Economic Benefits from Indian Winery (20)
More from Dr. Amarjeet Singh
More from Dr. Amarjeet Singh (20)
Recently uploaded
Recently uploaded (20)
Socio-Economic Benefits from Indian Winery
- 1. International Journal of Engineering and Management Research e-ISSN: 2250-0758 | p-ISSN: 2394-6962 Volume-11, Issue-4 (August 2021) www.ijemr.net https://doi.org/10.31033/ijemr.11.4.3 15 This Work is under Creative Commons Attribution-NonCommercial-NoDerivatives 4.0 International License. Socio-Economic Benefits from Indian Winery Dr. Abhishek Kumar Assistant Professor, Department of Hotel Management & Catering Technology, Jamia Hamdard, New Delhi, INDIA Corresponding Author: akumar.ihm@gmail.com ABSTRACT With globalization and increasing economy of India, Indian wine industry is growing at a CAGR of 20-25 percent and estimated to US$150 million. Uniformity in wine laws, new regulatory policies, tax incentive and increasing spending power of middle class widely spotting wine is a lifestyle drink and increased acceptability in India. The objective of this research paper is to highlight socio economic benefits from Indian winery for people living in the vicinity of wineries. To measure the socio- economic impact, the survey method was used to collect the data from two villages, Govardhan & Dindori from capital city of Indian wine, Nasik.More than 85% of wine production of India has concentrated in Maharashtra mostly in Nasik &Sangli. Theresearch finding shows that Indian winery has significantly contributed in various fields like employability, education, safety & security, assets etc to poor people of this areas. Keywords-- Winery Impact, Employability, Social Life, Indian Wine, Grape Farmers I. INTRODUCTION Winemaking Industry is one of the ancient industries which has been developed and refined over the time period and resulted in current industry today. The wine industry is global industry in which grapes are grown wine is made across the world over six continents. There are some positive as well as negative aspects of this process also like if we see negative factors then we see that agrichemicals are used heavily and water is consumed to a very high extent etc. on the other hand if we see it has positive factors also. To see the socio-economic benefits of wine making first we have to see how wine is manufactured which is described further. The winemaking process consists of two steps or two aspects. One is viticulture and second is winemaking. Viticulture means it is a process of growing grapes which are turned in to wine during winemaking process. The second step is wine making – in this process grapes are input which goes through certain process and wine is manufactured. This manufactured wine is sold throughout the world. The wine making process can also be split in to two types. One is old wine making process in which traditional technique such as using wooden barrels during the fermenting process and the second process is modern process of wine making in which steel drums, mechanized harvesting and screw tops are used. Positive Economic Benefits According to 2015 information, the global wine industry was worth 28 billion euros, providing huge advantages to the countries through economic growth, export income, and people's jobs in it. In 2005, the entire U.S. wine sector produced $128 billion for the U.S. economy. A significant amount of employment is created by the wine industry. In 2008, there were over 28,000 jobs in Australia linked to the wine industry. The sector employs over 11,000 individuals in Washington State. There are 58 units of grape winery in Maharashtra (Pawar, 2011). On the other hand, wine tourism has also become an industry itself. In 2012 in Bangalore city known as India's Siliicon Valley and home to many multinational information technology companies hosted an international wine festival that spread over three days offering its guests and chance to learn the basics of wine, its varieties and food pairing. Grape stomping, musical concerts, fashion shows and display of vintage cars and food stalls were also presented. Karnataka Wine Board (KWB) arranged this event and was co-sponsored by other government agencies including the Ministry of Food Processing Industries and the National Horticulture Board. This was the government organization's first event of its own kind in the wine industry. It provided a platform to network and show case their offers for international and domestic wine producers, grape farmers, machinery suppliers and other service providers. There have also been numerous technical sessions on multiple elements of wine making, vineyard growth and viticulture methods for both current and aspiring players While wine consumption in India is currently very low (an estimated annual per capita consumption of less than 10 millilitres), the global annual per capita consumption of wine is around four litres compared to this, but the picture is rapidly changing. The Indian wine industry reported a double-digit annual compound growth rate of over 14 percent between 2010 and 2015 (Economic Times, Mar. 15, 2017). The Indian wine market in the country has grown to 18 percent over the past few years, according to PwC, executive director of Corporate Finance and Investment Banking, Anand Dikshit. The Indian wine market currently has a value of nearly 17 million litres of Rs. 1400 crore. In line with other specialists and Total wine sales in India may increase to 8.3 million cases (one case equal to 9 litres) by 2020, according to other experts and industry players. According to Rajeev
- 2. International Journal of Engineering and Management Research e-ISSN: 2250-0758 | p-ISSN: 2394-6962 Volume-11, Issue-4 (August 2021) www.ijemr.net https://doi.org/10.31033/ijemr.11.4.3 16 This Work is under Creative Commons Attribution-NonCommercial-NoDerivatives 4.0 International License. Samant, Sula Vineyard's founder and CEO, India's leading wine company, and Kapil Grover, Grover Vineyard's second-largest wine producer, the Indian wine market is expected to grow to 25 percent YoY over the next 25 years. The wine industry's growing worldwide focus also has a adverse effect. In the present age where large- scale ownership dominates, many small farmers have been compelled to sell their property to big businesses to attain economies of scale. These large businesses also dominate in sales and render it harmful. In the current era where large scale ownership dominates in order to achieve economies of scale many small farmers have been forced to sell their land to big companies. In sales also these big companies dominate and make it harder for small wineries to distribute and subsequently operate. II. LITERATURE REVIEW Sonal Holland, 2017, explained in her research paper that women's representation as market segmentation has become increasingly important to the wine industry. Indian woman views wine as classy, empowering, healthy beverage and faces fewer cultural barriers when drinking wine in the presence of their family members or the larger society. Also, women often buy wine as compared to men on all occasions and find more spending on a bottle of wine marginally than men. The 25-34-year-old age groups as younger consumers are a promising market segment for India's wine industry. Over the centuries, wine has played a central role in the social, cultural and religious life of people (Charters, 2006; McGovern, 2003; Unwin, 1991) According to Billy Zhang (2018), the impact on society of the global wine industry was both positive and negative. This includes the adoption of wine culture throughout the new and old world. This has contributed to the habit of eating meal wines that often occurs in Italy. Wine consumers then found great pleasure and satisfaction in consuming fine wines and opened up a new area of beverage appreciation. This is evident by developing multiple wine appreciation societies which have increased social interaction and extensively published wine literature. A few people, particularly in Australia, are worried about withdrawn conduct related with overconsumption and hitting the bottle hard. This can prompt medical problems, for example, liver sclerosis, which can be unsafe, and thus puts a weight on the wellbeing arrangement of society. In the meantime, moderate drinking might be useful to wellbeing. Polyphenols in red wine are professed to lessen the danger of coronary illness, stroke, and disease. In any case, wine utilization compulsion and society's developing drinking society have diminished laborers ' profitability in the economy and in this manner decreased the potential development of the economy. At the District Bank of A. For instance, at Federation Bank of Australia, there are free drinks from Wednesday to Friday after work Wine & Social Aspect has described that the impacts of jazzed up drinking frequently rely upon the example of drinking, overwhelming or oppressive drinking examples will expand wellbeing dangers, yet for moderate drinking designs there isn't just less wellbeing hazard, yet additionally a few advantages for some grown-up consumers. The European Similar Liquor Study (ECAS) looked at and found critical contrasts in liquor utilization and savouring designs 14 European nations. While the European Mediterranean area has the most elevated liquor utilization per capita, drinking examples can be seen there that posture less wellbeing dangers: mixed refreshments, Mixed beverages, for instance, are devoured principally at home with dinners, not in bars/eateries and not without nourishment. There are additionally noteworthy national varieties with respect to "hitting the bottle hard." For instance, 34% of Irish respondents said that knocks back the firewater are generally over the top measures of liquor contrasted with just 2% in Italy and Greece, and 4% in Portugal. For instance, mixed drinks are principally devoured at home with suppers, not in bars/cafés and not without nourishment. Impressive national varieties with respect to "hard-core boozing" exist too. Zatish Y. Deodhar (March 2018) found that notwithstanding a couple of states in India, utilization of wine isn't debilitated. Indeed, to advance business and ranchers' pay, states like Maharashtra has given extract obligation exclusion to wineries. From the interest side also, with the possibility of proceeded with fast Gross domestic product development, thriving metropolitan populace, globalization, and the resulting changes in way of life; interest for wines has been expanding and the pattern would proceed later on. In this unique circumstance, it ends up basic to know the premiums appended to various wines and their characteristics coming about because of choices made by makers and customers in the wine advertise. For this reason, we utilized the epicurean value investigation strategy to Indian information. The thought is that recurrent buy component and spatial balance in a monopolistically aggressive wine market would uncover the premiums connected to different characteristics of wines giving signals both to makers and buyers on what new wines they could deliver or expend. His investigation demonstrates that there is particular and huge premium to old-world and new-world wines, in a specific order, when contrasted with Indian wine brands. High traditions obligation can't be the offender for the premium, for India permits 100 percent FDI in wineries, and, critically, traditions obligation offers insurance to household brands to raise their costs. Without high traditions obligation, while costs may get lower when all is said in done, the relative premium to remote brands
- 3. International Journal of Engineering and Management Research e-ISSN: 2250-0758 | p-ISSN: 2394-6962 Volume-11, Issue-4 (August 2021) www.ijemr.net https://doi.org/10.31033/ijemr.11.4.3 17 This Work is under Creative Commons Attribution-NonCommercial-NoDerivatives 4.0 International License. will remain. In the event that Indian brands are to end up mainstream, brand building activity should be reinforced. Linda F. Bisson (2002) has explained in his paper, wine production is an art and science both, a blend of individual creativity and technology involved. But it is also the part of economic factors deciding manufacture process and practices. To be successful wine production business, we must integrate artistic and an economic aspect of wine production with possesses an intrinsic and extrinsic factor that motivate for wine purchasing. Wine America, the National Association of American Wineries disclosed a national financial effect study demonstrating the wine business' absolute advantage to the American economy at $219.9 billion of every 2017. This is the principal point by point study at any point directed of the wine business' national financial effect. The investigation was directed by John Dunham and Partners of New York, and included figures for each of the 50 states, since wine is created in each one, from gold country to Florida and Wyoming just as California, Washington, Oregon and New York. III. OBJECTIVES OF THE STUDY 1. To assess socio economic impact of Indian Winery on Local People. 2. To compare the changes of Local people lives after establishing Indian Winery. Hypotheses H01: There is no significant impact of Indian winery on socio economic benefits to local people. H11: There is a significant impact of Indian winery on socio economic benefits to local people. IV. RESEARCH METHODOLOGY The study was conducted at villages of Maharashtra, where wineries are established and running to study socio-economic benefits of winery for the people living there. The total sample size for beneficiaries was 150. The sample was taken from two villages of Maharashtra where wineries are established and running these two villages were Govardhan and Dindori falling under Nashik district. The total population of these villages is 9603 and considering nearly 10% of population in these villages are working under wineries the sample size obtained was 147 which was rounded to 150 (keeping other parameters same as were used for consumers). In this study, the questionnaire was prepared to know about socio-economic benefits, people are getting from wineries who are residing in nearby place of wineries. Questions related to different aspects of socio- economic benefits were asked. First information related to demographics like age, religion, caste, occupation and education were asked. In the next section questions related to economics like income, land size, occupation, number of members in the family engaged in wineries, main source of income, household income, type of house, access to electricity etc. and impact of wineries on their life. In these two questionnaires the questions were mainly close ended and of dichotomous and Likert scale type questions. After preparing first draft of the questionnaire both the questionnaire was given to experts of the field to check its content and framing. After getting inputs form experts little modifications in language framing and rearrangement of the questionnaire was done and the necessary changes suggested by the experts were done. The analysis of collected data was done using MS-Excel and SPSS 19.0 version. The statistical methods applied for analysis are factor analysis, Student t test and ANOVA. V. RESULTS & FINDINGS One of the objectives of present research work was to highlight socio economic benefits from Indian wine for people living in the areas of winery, besides studying consumer behaviour regarding Indian wine. Hence to study about socio-economic benefits of winery, the data was collected from the people living in the vicinity of wineries. A brief description of sampling location and population characteristics are given below. The first sampling location was Govardhan village located in Nashik Tehsil of Nashik district in Maharashtra, India situated 6 kilometres away from district headquarter Nashik. Govardhan village is a gram panchayat. The total geographical area of village is 806 hectares. The Govardhan village has total population of 5,997 people out of which 3090 are males while 2907 are females according to population Census of 2011. Govardhan village has higher literacy rate compared to Maharashtra. In 2011, literacy rate of Govardhan village was 84.29 % compared to 82.34 % of Maharashtra. In Govardhan Male literacy stands at 91.13 % while female literacy rate was 77.03 %. The second village for sample collection was Dindori village. It is a large village located in Dindori Taluka of Nashik district, Maharashtra with total 3606 families residing with total population of 17734 consisting of 9147 male and 8587 females as per 2011 census. Dindori village has higher literacy rate compared to Maharashtra. In 2011, literacy rate of Dindori village was 83.92 % compared to 82.34 % of Maharashtra. In Dindori Male literacy stands at 89.78 % while female literacy rate was 77.79 %. The total sample size to study from these two villages to study socio-economic benefits form winery was 150. Considering nearly 10% of total population of these villages are working under wineries the sample
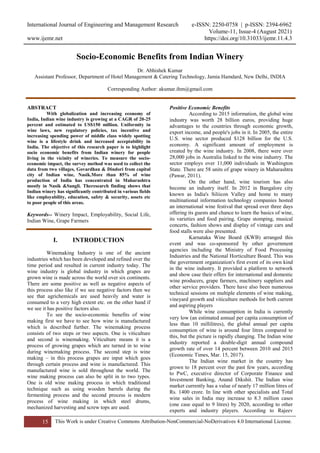
- 4. International Journal of Engineering and Management Research e-ISSN: 2250-0758 | p-ISSN: 2394-6962 Volume-11, Issue-4 (August 2021) www.ijemr.net https://doi.org/10.31033/ijemr.11.4.3 18 This Work is under Creative Commons Attribution-NonCommercial-NoDerivatives 4.0 International License. size obtained was 147 which was rounded to 150 to assess the level of Scio economic benefits from Indian wine industry. Demographic Profile of Sampled Respondents Table 1: Distribution of Respondents according to gender Gender N % Male 118 78.67 Female 32 21.33 Total 150 100.00 Figure 1: Distribution of Respondents according to gender Table shows distribution of respondents according to gender. Distribution data shows that there were 78.67% male respondents and 21.33% female respondents. Thus, proportion of male was higher in the sample as compared to proportion of females in the sample Table 2: Distribution of Respondents according to age Age (yrs.) N % Up to 25 14 9.33 25-35 28 18.67 35-45 73 48.67 45-55 24 16.00 Above 55 11 7.33 Total 150 100.00 0% 10% 20% 30% 40% 50% 60% 70% 80% Male Female 78.67% 21.33% Mean Score Type of Tourist
- 5. International Journal of Engineering and Management Research e-ISSN: 2250-0758 | p-ISSN: 2394-6962 Volume-11, Issue-4 (August 2021) www.ijemr.net https://doi.org/10.31033/ijemr.11.4.3 19 This Work is under Creative Commons Attribution-NonCommercial-NoDerivatives 4.0 International License. Figure 2: Distribution of Respondents according to age Table 5.2 shows distribution of respondents according to age of respondents. The maximum respondents (48.67%) had age between 35 to 45 years. Between 25–35 years and 45–55 years age group there were 18.67% and 16.00% respondents respectively. In up to 25 years category there were 9.33% respondents and in above 55 years category there were 7.33% respondents in above 55 years age category. Thus, maximum respondents from middle age group categories. Table 3: Distribution of Respondents according to religion Religion N % Hindu 118 78.67 Muslim 20 13.33 Others 12 8.00 Total 150 100.00 Figure 3: Distribution of Respondents according to religion 9.33% 18.67% 48.67% 16% 7.33% Up to 25 25-35 35-45 45-55 Above 55 78.67% 13.33% 8% Hindu Muslim Others
- 6. International Journal of Engineering and Management Research e-ISSN: 2250-0758 | p-ISSN: 2394-6962 Volume-11, Issue-4 (August 2021) www.ijemr.net https://doi.org/10.31033/ijemr.11.4.3 20 This Work is under Creative Commons Attribution-NonCommercial-NoDerivatives 4.0 International License. Table 3 gives distribution of wine beneficiaries according to their religion. There were 78.67% respondents belonging to Hindu religion, 13.33% belongs to Muslim community and remaining 8% respondents following various religions. Table 4: Distribution of Respondents according to caste Caste N % General 62 41.33 SC 33 22.00 ST 50 33.33 OBC 5 3.33 Total 150 100.00 Figure 4: Distribution of Respondents according to caste Table 4 shows caste wise distribution of respondents. 41.33% belongs to general caste, 22% from scheduled caste, 33.33% belongs to scheduled tribes and remaining 3.33% belongs to other backward class category. Table 5: Distribution of Respondents according to education Education N % Illiterate 34 22.67 Up to Sr. Sec. 64 42.67 Graduate 32 21.33 Post Graduate 20 13.33 Total 150 100.00 41.33% 22% 33.33% 3.33% General SC ST OBC
- 7. International Journal of Engineering and Management Research e-ISSN: 2250-0758 | p-ISSN: 2394-6962 Volume-11, Issue-4 (August 2021) www.ijemr.net https://doi.org/10.31033/ijemr.11.4.3 21 This Work is under Creative Commons Attribution-NonCommercial-NoDerivatives 4.0 International License. Figure 5: Distribution of Respondents according to education Table 5 shows distribution of respondents according to education. Among 150 respondents there were 22.67% illiterate, maximum 42.67% were educated up to senior secondary, 21.33% were graduates and remaining 13.33% were post graduates. Thus, maximum population belongs to people educated up to senior secondary level. Table 6: Main source of Family Income Source N % Agriculture 37 24.67 Regular Jobs 76 50.67 Business 2 1.33 Casual Workers 22 14.67 Dairy 11 7.33 Others 2 1.33 Total 150 100.00 Figure 6: Main source of Family Income 22.67% 42.67% 21.33% 13.33% Illiterate Up to Sr. Sec. Graduate Post Graduate 24.67% 50.67% 1.33% 14.67% 7.33% 1.33% 0.00% 10.00% 20.00% 30.00% 40.00% 50.00% 60.00% Source of Family Income
- 8. International Journal of Engineering and Management Research e-ISSN: 2250-0758 | p-ISSN: 2394-6962 Volume-11, Issue-4 (August 2021) www.ijemr.net https://doi.org/10.31033/ijemr.11.4.3 22 This Work is under Creative Commons Attribution-NonCommercial-NoDerivatives 4.0 International License. Table 6 shows distribution of respondents according to main source of family income. As evident from the table that nearly 51% of the population do regular jobs in wineries in their nearby area. 24.67% of the population do agricultural work related to winery like farming grapes. Only 1.33% was found to have business. 14.67% were casual workers, 7.33% do dairy related jobs and remaining 1.33% engaged in various works. Table 7: Income level for livelihood Response N % Yes 84 56.00 No 66 44.00 Total 150 100.00 Figure 7: Income Level for livelihood Table 7: When it was asked from the respondents that whether their income is sufficient for their livelihood, in response to this question 56% agreed in affirmation and 44% denied that their income is sufficient for their livelihood. Table 8: Family land size Family Land size N % Less than 1 acre 90 60.00 1-2 acre 30 20.00 2-5 acre 18 12.00 More than 5 acres 12 8.00 Total 150 100.00 56% 44% 0% 10% 20% 30% 40% 50% 60% Yes No Response
- 9. International Journal of Engineering and Management Research e-ISSN: 2250-0758 | p-ISSN: 2394-6962 Volume-11, Issue-4 (August 2021) www.ijemr.net https://doi.org/10.31033/ijemr.11.4.3 23 This Work is under Creative Commons Attribution-NonCommercial-NoDerivatives 4.0 International License. Figure 8: Family land size As far as family land size in concerned 60% has less than 1-acre land. 20% has 1-2 acre of land. 12% has 2-5 acre of land and 8% has more than 5 acres of land. Table 9: Household member associated with winery Response N % Yes 108 72.00 No 42 28.00 Total 150 100.00 Figure 9: Household member associated with winery 60% 20% 12% 8% 0% 10% 20% 30% 40% 50% 60% 70% Less than 1 acre 1-2 acre 2-5 acre More than 5 acres Family Land Size 72% 28% 0% 10% 20% 30% 40% 50% 60% 70% 80% Yes No Any Household member associated with winery
- 10. International Journal of Engineering and Management Research e-ISSN: 2250-0758 | p-ISSN: 2394-6962 Volume-11, Issue-4 (August 2021) www.ijemr.net https://doi.org/10.31033/ijemr.11.4.3 24 This Work is under Creative Commons Attribution-NonCommercial-NoDerivatives 4.0 International License. Table 9 shows that 72% of the household members in the family are associated with winery which again confirms that maximum of the population living in the sampled area are benefitting from the winery there. Table 10: Ways of link with winery plant Ways of connections N % Supply grapes to winery 15 10.00 Supply grapes to winery through broker 29 19.33 Some family members are working in winery 80 53.33 Small business nearby winery 14 9.33 Others 12 8.00 Total 150 100.00 Figure 10: Ways of link with winery plant In table -10 shows the ways in which family members of people living in sampled area are connected with winery. According to distribution data it can be seen that 53.33% respondents said that one of some family members of theirs are working in the winery. 19.33% said that they supply grapes to winery through broker. 10% said they supply grapes to winery. 9.33% said they do small business in nearby winery area and remaining 8% said that in other ways they of their family members are associated with winery plant. Table 11: Ways of getting food Way of getting food N % No problem of food 89 59.33 Daily wages but something save for next day 32 21.33 Eating depend on Daily work 26 17.33 Another source but not so enough 3 2.00 Total 150 100.00 10% 19.33% 53.33% 9.33% 8% 0% 10% 20% 30% 40% 50% 60% Supply grapes to winery Supply grapes to winery through broker Some family members are working in winery Small business nearby winery Others
- 11. International Journal of Engineering and Management Research e-ISSN: 2250-0758 | p-ISSN: 2394-6962 Volume-11, Issue-4 (August 2021) www.ijemr.net https://doi.org/10.31033/ijemr.11.4.3 25 This Work is under Creative Commons Attribution-NonCommercial-NoDerivatives 4.0 International License. Figure 11: Ways of getting food Respondents were asked the ways to getting food means is their income sufficient to feed them and their family daily? In response to this question 59.33% said that they had no problem in feeding them and their family daily. 21.33% said that their food depends upon daily wages but they save for next day also in anticipation that they may or may not get work next day. 17.33% said their eating depends on their daily work. Only 2% said that source of getting income are not sufficient to feed them and their family. Table 12: Need to send children for work besides schools Response N % Yes 32 21.33 No 118 78.67 Total 150 100.00 Figure 12: Need to send children for work besides schools 59.33% 21.33% 17.33% 2% 0.00% 10.00% 20.00% 30.00% 40.00% 50.00% 60.00% 70.00% No problem of food Daily wages but something save for next day Eating depend on Daily work Another source but not so enough Ways of Getting Food 21.33 78.67 0 10 20 30 40 50 60 70 80 90 Yes No Need to send children for work besides schools
- 12. International Journal of Engineering and Management Research e-ISSN: 2250-0758 | p-ISSN: 2394-6962 Volume-11, Issue-4 (August 2021) www.ijemr.net https://doi.org/10.31033/ijemr.11.4.3 26 This Work is under Creative Commons Attribution-NonCommercial-NoDerivatives 4.0 International License. Respondents were asked “Whether sometimes do you need to send your children for work besides school due to income problem?”, in response to this question 21.33% respondents said that they require their children for earning besides schools so that they get sufficient money to feed their family. On the other hand, 78.67% said that they do not need to send their children for work besides their schools to support their income. Table 13: Access to bank account Response N % Yes 120 80.00 No 30 20.00 Total 150 100.00 Figure 13: Access to bank account Respondents were asked whether they have access to bank accounts. In response to this question 80% respondents said that yes, they have bank account in the banks. Only 20% said they do not have bank accounts. Table 14: Sources of Loans Source of loan N % Banks 55 36.67 Corporate Bank 50 33.33 Micro Finance Institutions/Self Help Groups 21 14.00 Money lenders 24 16.00 Total 150 100.00 80% 20% 0% 10% 20% 30% 40% 50% 60% 70% 80% 90% Yes No Access to Bank Account
- 13. International Journal of Engineering and Management Research e-ISSN: 2250-0758 | p-ISSN: 2394-6962 Volume-11, Issue-4 (August 2021) www.ijemr.net https://doi.org/10.31033/ijemr.11.4.3 27 This Work is under Creative Commons Attribution-NonCommercial-NoDerivatives 4.0 International License. Figure 14: Sources of Loans Table 14 shows the various sources from which people living in the sample area are taking loan. 36.67% said they are taking loans from banks. 33.33% said they were taking loans from corporate banks. 14% were taking loans from micro finance institutions or self-help group. Only 16% respondents said that they take loans from money lenders. Table 15: Type of House Type of House N % Pucca 97 64.67 Semi Pucca 23 15.33 Kuccha 15 10.00 Thatcher 15 10.00 Total 150 100.00 Figure 15: Type of House 36.67% 33.33% 14% 16% 0.00% 5.00% 10.00% 15.00% 20.00% 25.00% 30.00% 35.00% 40.00% Banks Corporate Bank Micro Finance Institutions/Self Help Groups Money lenders Sources of Loans 64.67% 15.33% 10% 10% 0.00% 10.00% 20.00% 30.00% 40.00% 50.00% 60.00% 70.00% Pucca Semi Pucca Kuccha Thatcher Type of House
- 14. International Journal of Engineering and Management Research e-ISSN: 2250-0758 | p-ISSN: 2394-6962 Volume-11, Issue-4 (August 2021) www.ijemr.net https://doi.org/10.31033/ijemr.11.4.3 28 This Work is under Creative Commons Attribution-NonCommercial-NoDerivatives 4.0 International License. Table 15 shows distribution according to type of house in which sample respondents are living. Table shows that 64.67% live in pucca house. 15.33% said they are living in semi-pucca house. 10% said that they are living in kuccha house and remaining 10% said they are living in thatcher. Hence overall it can be said that people in the sampled are living in good living condition except few. Table 16: Access to electricity Main Source of Lighting N % Electricity 136 90.67 Kerosene 14 9.33 Total 150 100.00 Figure 16: Access to electricity In response to question what is their source of lighting 90.67% said that they have access to electricity and their main source of lighting is electricity. Only 9.33% respondents said that their source of lighting is still kerosene. Table 17: Toilet Facility In house toilet facility? % Yes 120 80.00 No 30 20.00 Total 150 100.00 90.67 9.33 0 10 20 30 40 50 60 70 80 90 100 Electricity Kerosene Main Source of Lighting
- 15. International Journal of Engineering and Management Research e-ISSN: 2250-0758 | p-ISSN: 2394-6962 Volume-11, Issue-4 (August 2021) www.ijemr.net https://doi.org/10.31033/ijemr.11.4.3 29 This Work is under Creative Commons Attribution-NonCommercial-NoDerivatives 4.0 International License. Figure 17: Toilet Facility Table 17 shows distribution of sampled respondents according to in house toilet facility. The distribution shows that 80% respondents have toilet facility in their house and 20% said that they do not have toilet facility in their house. Table 18: School Status Type of school N % Public/Government school 133 88.67 Private/Convent School 11 7.33 Unable to send to school 6 4.00 Total 150 100.00 Figure 18: School Status 80% 20% 0% 10% 20% 30% 40% 50% 60% 70% 80% 90% Yes No In House Toilet Facility 88.67% 7.33% 4% 0.00% 10.00% 20.00% 30.00% 40.00% 50.00% 60.00% 70.00% 80.00% 90.00% 100.00% Public/Government school Private/Convent School Unable to send to school Type of School
- 16. International Journal of Engineering and Management Research e-ISSN: 2250-0758 | p-ISSN: 2394-6962 Volume-11, Issue-4 (August 2021) www.ijemr.net https://doi.org/10.31033/ijemr.11.4.3 30 This Work is under Creative Commons Attribution-NonCommercial-NoDerivatives 4.0 International License. Table 5.18 shows the distribution according to type of school in which their children go for study. 88.67% respondents said that their children go to public or government schools for the study. 7.33% said their children go to private or convent schools and 4.00% said they are unable to send their children to school. Winery Impact on Employability and Asset Table 19: Winery Help in Making Day to Day Expenses Easy To A Very Great Extent To a Great Extent Average To a Less Extent To a Very Less Extent Food 10.67 55.33 15.33 12.00 6.67 3.51 (3) Rent 3.33 52.00 32.00 8.00 4.67 3.41 (5) Transport 6.67 44.67 30.67 10.67 7.33 3.33 (6) Education 11.33 64.67 12.00 8.00 4.00 3.71 (1) Clothing 8.67 64.00 15.33 8.00 4.00 3.65 (2) Medical 6.67 53.33 24.00 11.33 4.67 3.46 (4) Household utensils 4.67 37.33 39.33 12.00 6.67 3.21 (8) Other major expenses 6.67 35.33 44.67 10.67 2.67 3.33 (6) Respondents were asked to give their opinion that to what extent winery had helped them in making their day-to-day expenses under different heads easy. If we observe data in the table, in general view it can be said that winery has helped residents of nearby area in great way. For all the aspects given in the table it can be found that winery has helped them in every sphere of life. If individual heads are observed it came out that the top five areas in which winery has helped the residents of nearby area are education in first position, clothing in second position, food in third position, medical on fourth position and rent on fifth position. Thus, if we observed these five areas it can be said that these are the five basic needs of human being in which winery has helped them in their day to day living easy. Thus, in conclusion it can be said that winery has helped in making day to day living of the residents living in the nearby area very comfortable by fulfilling their basic needs. Contributions of Winery in Development Table 20: Contribution from winery in various fields Area/Field Yes No N % N % New School 140 93.33 10 6.67 New Road 105 70.00 45 30.00 Electricity supplies 131 87.33 19 12.67 Water facilities 99 66.00 51 34.00 Safety and Security 105 70.00 45 30.00 Bank Facility 92 61.33 58 38.67 Post Office 134 89.33 16 10.67 Bus Stand 126 84.00 24 16.00
- 17. International Journal of Engineering and Management Research e-ISSN: 2250-0758 | p-ISSN: 2394-6962 Volume-11, Issue-4 (August 2021) www.ijemr.net https://doi.org/10.31033/ijemr.11.4.3 31 This Work is under Creative Commons Attribution-NonCommercial-NoDerivatives 4.0 International License. Figure 19: Contribution from winery in various fields Respondents were asked whether in the list of given areas winery has contributed in the development of these areas. In response to these question maximum responses received in affirmation in each area that winery has contributed in the development of these given areas. The top five areas in which winery has contributed were, first new schools, second post offices, third electricity supplies, fourth bus stands then comes new roads and safety and security. Thus, it can be said that winery has contributed a lot in the development of sampled area. Hypothesis Testing H01: There is no significant impact of Indian winery on socio economic benefits to local people. H11: There is a significant impact of Indian winery on socio economic benefits to local people. For testing this hypothesis, it is assumed that if respondents’ score for socio-economic status I significantly above sixty percent level then it will be inferred their socio-economic condition is good and they are getting benefits for winery or winery had significant positive impact on the life of people associated with winery. Test results are given below – Table 5.21: Hypothesis Testing N Mean SD t df Result 150 70.94 4.73 28.35 149 *** 93.33% 70% 87.33% 66% 70% 61.33% 89.33% 84% 6.67% 30% 12.67% 34% 30% 38.67% 10.67% 16% 0% 10% 20% 30% 40% 50% 60% 70% 80% 90% 100% New School New Road Electricity supplies Water facilities Safety and Security Bank Facility Post Office Bus Stand Area/ Field
- 18. International Journal of Engineering and Management Research e-ISSN: 2250-0758 | p-ISSN: 2394-6962 Volume-11, Issue-4 (August 2021) www.ijemr.net https://doi.org/10.31033/ijemr.11.4.3 32 This Work is under Creative Commons Attribution-NonCommercial-NoDerivatives 4.0 International License. Table 5.20: Socio Economic Status Interpretation Test results given above shows that the socio- economic status score of respondents (70.94) was significantly high above the test value (60.00) and the difference in these scores was highly significant (t =28.35, p<0.001) this results shows that the socio- economic status of people associated with winery is significantly good and there is significant impact of winery on their life and getting socio-economic benefits for these wineries thus null hypothesis “There is no significant impact of wine industry on socio economic benefits” is rejected and alternative hypothesis is accepted. VI. CONCLUSIONS The analysis of socio-economic benefits from Indian winery for people living in the areas of winery are getting benefited from these wineries both at social as well as economic level. Winery has helped the residents of nearby area are education in first position, clothing in second position, food in third position, medical on fourth position and rent on fifth position. Thus, if we observed these five areas it can be said that these are the five basic needs of human being in which winery has helped them in their day to day living easy. Thus, in conclusion it can be said that winery has helped in making day to day living of the residents living in the nearby area very comfortable by fulfilling their basic needs. Winery has also contributed in the development of these areas. The top five areas in which winery has contributed were, first new schools, second post offices, third electricity supplies, fourth bus stands then comes new roads and safety and security. Thus, it can be said that winery has contributed a lot in the development of sampled area. REFERENCES [1] MS, N. B. (2008.). Influence of wine packaging on customers` decession to purchase. Journal of Food service Business Research, 84-98. [2] Barber, N. (2008 Sep). Relationship of wine consumers' self-confidence. Journal of Food service Business Research Product Involvement, and Packaging Cues, 45-64. [3] Barber, N. (2008). Capturing the younger wine consumer. Journal of Wine Research, 123-141. [4] Barber, N. (2009). The importance of wine bottle closures in retail purchase decisions of consumers. Journal of Hospitality Marketing & Management, 597- 614. [5] Botonaki, A. (2006). Consumer response evaluation of a greek quality wine. Acta Agriculturae Scandinavica, Section C — Food Economics, 91-98. [6] Brown, U. (2006). Foreign wine consumption in Australia . Journal of Food Products, 15-26. [7] Bruwer, J. (2007). The Australian online wine- buying consumer: Motivational and behavioural perspectives. Journal of Wine Research, 193-211. 60 70.94 54.00 56.00 58.00 60.00 62.00 64.00 66.00 68.00 70.00 72.00 Test Value Obs. Value SE- Status Score Area/ Field
- 19. International Journal of Engineering and Management Research e-ISSN: 2250-0758 | p-ISSN: 2394-6962 Volume-11, Issue-4 (August 2021) www.ijemr.net https://doi.org/10.31033/ijemr.11.4.3 33 This Work is under Creative Commons Attribution-NonCommercial-NoDerivatives 4.0 International License. [8] Bruwer, J. (2012). Perspectives on consumers' attitudes to wine's region of origin in a restaurant setting. Journal of Foodservice Business Research, 300-318. [9] Charters, S. (2008). Why do people drink wine? A consumer-focused exploration. Journal of Food Products Marketing, 13-31. [10] COX, D. (2009). Predicting consumption, wine involvement and perceived quality of Australian red wine. Journal of Wine Research, 209-229. [11] Bruwer, J. (2012). Perspectives on consumers' attitudes to wine's region of origin in a restaurant setting. Journal of Foodservice Business Research, 300-318. [12] Nallaperuma, K. (2017). A comparative analysis of experts’ and consumers’perceptions of regionality in Australian wine purchase. Journal of Wine Research, 194-215. [13] Ogbeide, O. A. (2014). Are Australian wine consumers willing to pay for the expert service of wine retailers?. Journal of Wine Research, 189-208. [14] Batra, A. (2008). An exploratory study on specific preferences and characteristics of wine tourists. Anatolia: An International Journal of Tourism and Hospitality Research, 271-286. [15] Bruwer, J. (2002). Segmentation of the Australian wine market using a wine-related lifestyle. Journal of Wine Research, 217-242. [16] Ellias, D. (2018). The effect of wine knowledge type on variety seeking behavior in wine purchasing. Journal of Wine Research, 71-86. [17] Nallaperuma, K. (2017). A comparative analysis of experts’ and consumers’perceptions of regionality in Australian wine purchase. Journal of Wine Research, 194-215. [18] Olsen, D. J. (2007). Wine for my generation: Exploring how US wine consumers are socialized to. Journal of Wine Research, 1-18. [19] Saayman, M. (2014). Factors determining visitors’ memorable wine-tasting experience at wineries. Anatolia: An International Journal of Tourism and Hospitality Research , 372-383 [20] Batra, A. (2008). An exploratory study on specific preferences and characteristics of wine tourists. Anatolia: An International Journal of Tourism and Hospitality Research, 271-286. [21] Bruwer, J. (2002). Segmentation of the Australian wine market using a wine-related lifestyle. Journal of Wine Research, 217-242. [22] Ellias, D. (2018). The effect of wine knowledge type on variety seeking behavior in wine purchasing. Journal of Wine Research, 71-86. [23] Nallaperuma, K. (2017). A comparative analysis of experts’ and consumers’perceptions of regionality in Australian wine purchase. Journal of Wine Research, 194-215. [24] Ogbeide, O. A. (2014). Are Australian wine consumers willing to pay for the expert service of wine retailers? Journal of Wine Research, 189-208. [25] Reynolds, D. (2014). Do U.S. state laws affect per capita wine purchase?. Journal of Foodservice Business Research, 19-27. [26] Ajzen, I., & Fishbein, M. (1980). Understanding attitudes and predicting social behavior. Englewood Cliffs, N.J.: Prentice-Hall. [27] Altaffer, P. & Washington-Smith, G. (2009, Jul). From the corners of the world. [28] Anderson P & Baumberg B (2006). Alcohol in Europe. A public health perspective. [29] Anderson, J. C & Gerbing D.W. (1988). Structural equation modeling in practice: A review and recommended two-step approach, Psychological Bulletin, 103(3), 411-423. [30] Armitage, A. (2007 Sep). Mutual research designs: Redefining mixed methods research design. Paper presented at the British Educational Research Association Annual Conference, Institute of Education, University of London. [31] Assael, Henry. (2004). Consumer behaviour: A strategic approach. Boston: Houghton Mifflin Company. [32] Atkin, C. K. & Freimuth, V. (1989). Formative evaluation research in campaign design. In: R. E. Rice & C. K. Atkin (Eds.), Public communication campaigns. (2nd ed.). Newbury Park, CA: Sage. pp. 131-150. [33] Atkini T., Nowak, L. & Rosanna G. (2007). Women wine consumers: information search and retailing implications. International Journal of Wine Business Research, 19(4), 327-339. [34] Bagozzi, R. P. (1994). Principles of marketing research. Cambridge: Blacwell Publishers. [35] Bartoli, P. Et Boulet D. (1989). Dynamique et regulation de la sphere agroalimentaire, L’exempleviticole, these de doctorat. Etudes et Recherches, INRA-ESR Montpeillier [36] Basu, A. & Dutta, M. J. (2008). The relationship between health information seeking and community participation: The roles of health information orientation and efficacy. Health Communication, 23(1), 70-79. [37] Bearden, William O. & Michael J. Etzel. (1982). Reference group influence on product and brand purchase decision. Journal of Consumer Research, 9, 183-194. [38] https://study.com/academy/lesson/research- methodology-approaches-techniques-quiz.html. [39] http://www.sociology.kpi.ua/wp- content/uploads/2014/06/Ranjit_Kumar- Research_Methodology_A_Step-by-Step_G.pdf. [40] https://www.questionpro.com/blog/research-design/. [41] https://www.questionpro.com/blog/descriptive-research/. [42] http://www.yourarticlelibrary.com/marketing/research- design-introduction-contents-and-types/48714.