
Recommended
Recommended
More Related Content
What's hot
What's hot (20)
Similar to An Empirical Study on Food and Beverage Service Quality and Customer Satisfaction in Star Graded Hotels in Dambulla
Similar to An Empirical Study on Food and Beverage Service Quality and Customer Satisfaction in Star Graded Hotels in Dambulla (20)
More from Dr. Amarjeet Singh
More from Dr. Amarjeet Singh (20)
Recently uploaded
Recently uploaded (17)
An Empirical Study on Food and Beverage Service Quality and Customer Satisfaction in Star Graded Hotels in Dambulla
- 1. International Journal of Engineering and Management Research e-ISSN: 2250-0758 | p-ISSN: 2394-6962 Volume-10, Issue-6 (December 2020) www.ijemr.net https://doi.org/10.31033/ijemr.10.6.1 1 This Work is under Creative Commons Attribution-NonCommercial-NoDerivatives 4.0 International License. An Empirical Study on Food and Beverage Service Quality and Customer Satisfaction in Star Graded Hotels in Dambulla Bandara WMAH1 and Dahanayake SNS2 1 Undergraduate, Department of Tourism & Hospitality Management, Rajarata University, SRI LANKA 2 Senior Lecturer, Department of Tourism & Hospitality Management, Rajarata University, SRI LANKA 1 Corresponding Author: asankahemantha825@gmail.com ABSTRACT The hotel industry is one of the integral constituents in the flourishing tourism industry and is extremely competitive. In this competitive arena, service quality has become a crucial success factor in maintaining hotel standards. A strong, sustainable, outstanding service industry requires good service quality standards. However, due to the intangible nature of service products, measuring service quality is substantially challengeable than measuring the quality of physical products. Hence, this study attempts to investigate the impact of food and beverage service quality on customer satisfaction in the star graded hotels. Dambulla is one of the major tourist destinations in Sri Lanka, has been identified as the study area. A total of 150 foreign departure tourists who have visited three and above star graded hotels in the respective area were selected through a convenient sampling technique. A widely accepted SERVQUAL model was utilized to ascertain the findings. Primary data were collected through a self-administered structured questionnaire. Descriptive, frequency, Pearson correlation, and multiple regression analysis were conducted to analyze data using SPSS. The results reveal that there is a positive significant impact of tangibility, reliability, responsiveness, assurance of food and beverage service quality on customer satisfaction in the star graded hotels in Dambulla area. On the contrary, empathy shows that there is no impact on customer satisfaction. Moreover, tangibility is the most influential service quality attribute that affects customer satisfaction. Thus, the authorities must pay their attention towards improving the tangible evidence such as staff attires and appearance, aesthetic upkeep of interior and exterior, and provide reliable service for their guests with greater customer care. Keywords— Customer Satisfaction, Food and Beverage Service, Service Quality, Star Graded Hotels I. INTRODUCTION Hotel is a service-oriented industry. In this, hotels are receiving customer feedbacks as a result of day-to-day operation. Some customer feedbacks are negative while others are positive. However, streams of literature exist to instruct hotels on what should be done when a service experience does not match with customer expectations. But a relatively small proportion of literature exists to measure what should be done when a service experience matches customer expectations Therefore studying service quality and customer satisfaction has become a frequent topic in the hospitality industry. In a modern competitive business environment, Service quality and customer satisfaction are very significant. But defining service quality and customer satisfaction is no easy task. Because it is personal and subjective. Service quality in a business has become a measure of the extent to which the service provider meets customer expectations. Today, hospitality is facing an increased number of competitors and a pressure environment. In this, those who provide high-quality customer service can attain a competitive place in the market in the present. It is said that service must fill the internal and external requirements of customers by achieving productivity and through quality. Customer satisfaction is different from service quality. customer satisfaction is a result of customer perception of the value received in a transaction or relationship where value equals perceived service quality relative to price and customer actuation cost. customer satisfaction is a psychological concept that involves the feeling of wellbeing and pleasure that results from obtaining what one hopes for and expects from an appealing product or service. However positive customer experience will result in a return to a particular organization and product and recommend it to others. In other words, service organizations' overall performance depends on how much the staff satisfies their customers. Satisfaction with a service is a function of two independent elements called functional element (food and beverages in Restaurant) and performance delivery element (The Service). Therefore understanding factors that influence customer satisfaction is very useful to the managers of hotels and restaurants to plan and deliver the right offering. Problem Identification Many types of research have been done in the area of service quality and customer satisfaction. Because service quality is more difficult to evaluate than good quality. Therefore, when it is considered about world hospitality research, a significant amount of attention of
- 2. International Journal of Engineering and Management Research e-ISSN: 2250-0758 | p-ISSN: 2394-6962 Volume-10, Issue-6 (December 2020) www.ijemr.net https://doi.org/10.31033/ijemr.10.6.1 2 This Work is under Creative Commons Attribution-NonCommercial-NoDerivatives 4.0 International License. researchers have given on the overall hotel industry service quality, and customer satisfaction. In addition to that, the hotel industry in Sri Lanka consists of different services including accommodation, food, and other services. Especially, classified hotels in Sri Lanka are providing above mentioned services to their guests. Even though the Sri Lankan hotel industry is on a development path, it still suffering from researches on hotel service quality and customer satisfaction. Therefore Sri Lankan researchers have given a prominent place to measure the service quality and customer satisfaction in hotels by today. Moreover, almost all researchers had selected the Colombo area and star grade hotels for their surveys. In addition to that researchers have considered about four major departments in hotels for their surveys (Food and Beverage, Front Office, Housekeeping, and Kitchen ) In this, researchers have found that there was a positive relationship between service quality and customer satisfaction. But very few had addressed the area of food and beverages service quality and its impact on customer satisfaction separately. Even though Dambulla is far away from the capital of Sri Lanka, it is a very Significant area in Sri Lankan hospitality industry same as other tourist destinations in Sri Lanka. In addition to that, it can be seen many classified hotels which provide standard service to the guests. But very Few Studies have examined the Dambulla area for the surveys. Therefore the researcher selected Dambulla area for the survey. Especially, the researcher examines. food and beverage departments of classified hotels in Dambulla area. According to that, The problem of this study were as bellow, “What is the impact of the food and beverage service quality on customer satisfaction in three and above star grade hotels in Dambulla area?” Objectives To identify the impact of tangibility of food and beverage service quality on customer satisfaction in three and above star grade hotels in Dambulla area To identify the impact of reliability of food and beverage service quality on customer satisfaction in three and above star grade hotels in Dambulla area To identify the impact of responsiveness of food and beverage service quality on customer satisfaction in three and above star grade hotels in Dambulla area To identify the impact of assurance of food and beverage service quality on customer satisfaction in three and above star grade hotels in Dambulla area To identify the impact of empathy of food and beverage service quality on customer satisfaction in three and above star grade and hotels in Dambulla II. METHODOLOGY Research Design The approach of this study was quantitative approach. The researcher measured the impacts of food and beverage service quality on customer satisfaction in three and above star grade hotels in Dambulla area. To conduct this survey quantitative data were required. This study was testing the theories that already existed (Service quality and customer satisfaction) and tests were carried out by using questionnaires. Population and Sampling Technique Since the researcher expected to collect data from the customers of hotels, the researcher selected 150 Foreign tourist guests of the three and above hotels in Dambulla area by representing restaurant, bar, and room service divisions. The sample was selected by using a convenient sampling method. Data Collection Primary data was used in this survey. The researcher used a questionnaire to collect primary data. The questionnaire measured the food and beverage service quality using five variables (Tangibility, Reliability, Responsiveness, Assurance, Empathy) and each question contained five points Likert scale (1= strongly agree to 5= strongly disagree).In the primary data collection, the researcher expected to collect data covering restaurants, bars, and room service divisions. The Banquet area was not covered. Because almost all customers did not experience banquet facilities in hotels. But almost departure guests have overall experience about restaurant, bar and room service comparing with in house guests. Therefore primary data was collected from foreign departure guests who were visiting the three and above star grade hotels in Dambulla area to spend their holidays Data Analyzing The analysis of collected data was carried out using the Statistical Package for Social Science (SPSS). This Software package was the optimum analyzing method for this survey. Cronbach’s alpha was used to measure the reliability of the questionnaire. Pearson’s correlation was used to measure the relationship between food and beverage service quality and customer satisfaction. Regression was used to measure the impact of service quality variables (tangibility, reliability, responsiveness, assurance, and empathy) on customer satisfaction and to measure the overall impact of food and service quality on customer satisfaction. Hypotheses of Study According to this study hypotheses were as follows,
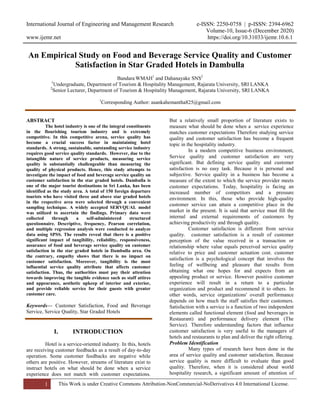
- 3. International Journal of Engineering and Management Research e-ISSN: 2250-0758 | p-ISSN: 2394-6962 Volume-10, Issue-6 (December 2020) www.ijemr.net https://doi.org/10.31033/ijemr.10.6.1 3 This Work is under Creative Commons Attribution-NonCommercial-NoDerivatives 4.0 International License. H1 = There is a positive impact of tangibility of food and beverage service quality on the customer satisfaction in three and above star grade hotels in Dambulla area H2 = There is a positive impact of reliability of food and beverage service quality on customer satisfaction in three and above star grade hotels in Dambulla area H3 = There is a positive impact of responsiveness of food and beverage service quality on customer satisfaction in three and above star grade hotels in Dambulla area H4 = There is a positive impact of assurance of food and beverage service quality and customer satisfaction in three and above star grade hotels in Dambulla area H5 = There is a positive impact of empathy of food and beverage service quality on customer satisfaction in three and above star grade hotels in Dambulla area Conceptual Framework FIGURE 1: Conceptual Framework III. LITERATURE REVIEW Service Quality A strong, sustainable, world-class service industry requires good service quality standards(Osarenkhoe, Komunda et al. 2017). But defining service quality is not easy(González, Comesaña et al. 2007). But there are many kinds of research that have been defined service quality in different ways(Eshetie, Seyoum et al. 2016). The literature relating to the definition of the quality of service is widely classified into two components, namely technical and functional. The technical perspective (Physical Perspective) gives the nature of the provided service. In a hotel, rooms, reception area includes to the technical perspective. But functional perspective (Interactive service) investigates the mode of service. Because a consumer has a typically different perception of service quality compared to technical expert. In a hotel, the nature of greeting, the care given to the guest, the attention given to the guest include to the functional perspective(Majid , Zahra et al. 2016). In addition to that, some researchers add image quality (corporate) also as a component of service(Saleh and Ryan 1991). .However, Simply service quality can be defined as a measure of the extent to which the service provided meets Customer expectations(Eshetie, Seyoum et al. 2016).In the service industry, almost definitions of service quality focus on meeting customer expectations and how well services delivered to match their expectations(Giritlioglu, Jones et al. 2014). According to the provision and receipt of service, there are three parties involved in service delivery. Such as management, staff, and customers. Each group views the quality of service from independent viewpoints(Saleh and Ryan 1991). Customers evaluate service quality by comparing their expectations regarding a particular service with actually delivered one(Marković, Raspor et al. 2011). On the other hand, Managers believe that guests demand more than guests reported themselves as required(Saleh and Ryan 1991). However due to the intangible nature of service products, Measuring service quality is more difficult than measuring the quality of a physical product. Therefore the different models were produced by the experts for measuring the quality of service in recent years (Majid, Zahra et al. 2016). one of the most widely used instruments for measuring service quality is the SERVQUAL model. It was designed by Parasuraman in 1988. SERVQUAL model is regarded as an acceptable model for the measurement of service quality. In 1985 parasurman identified ten dimensions in assessing service quality (reliability, responsiveness, competence, access, courtesy, communication, credibility, security, understanding, tangibles). But later reduced to five dimensions as tangibility, reliability, responsiveness, assurance, and empathy. According to the SERVQUAL model customer satisfaction result from the quality service where customer perception of service experience exceeds customer expectations (Parasurman, Zeithaml et al. 1988). In addition to that, The hospitality industry has been facing an increased number of competitors and a pressure environment (Murasiranwa, Nield et al. 2010). Service quality has become a key strategic factor for companies to differentiate their products and services From their competitors(Almsalam 2014). Because customers participate in delivering and consumption of service, while they interact with various factors of organizations (Khattab and Aldehayyat 2011). Therefore Tangibility Reliability Responsivenes ss Assurance Empathy Customer Satisfaction Service Quality (Indepemdent Varriable) (Dependent Varriable)
- 4. International Journal of Engineering and Management Research e-ISSN: 2250-0758 | p-ISSN: 2394-6962 Volume-10, Issue-6 (December 2020) www.ijemr.net https://doi.org/10.31033/ijemr.10.6.1 4 This Work is under Creative Commons Attribution-NonCommercial-NoDerivatives 4.0 International License. each service organization is maintaining systems to deliver continuous and effective service. This service delivery also requires two components. Firstly, the service should exist through anticipation of the customer's need ( a guest need not ask the menu in the restaurant, it must be there ready for use). Secondly, The service provision must be able to accommodate customer needs (Saleh and Ryan 1991). Eventually, From the customer point of view, a Quality service experience may lead a consumer to develop and modify his or her attitude in long run. And it will lead to recommend someone else, reduction in complaints and improve customer retention rates (Almsalam 2014) Customer Satisfaction Customer satisfaction is the heart of marketing. Often marketers express their ideas on customer satisfaction using slogans such as “our focus is customer satisfaction”,“ Customer is king”(Andaleeb and Conway 2006). As a result, several studies have investigated the relationship between service quality and customer satisfaction(Gunarathne 2014). In this, researchers have found that there is a strong relationship between service quality and customer satisfaction (Sureshchandar, Rajendran et al. 2002). Therefore service providers are trying to improve the service quality to satisfy their customers (Saleem and Raja 2014). For customer satisfaction, definitions abound in the research literature. According to that customer satisfaction can be defined as a function of an initial standard and some perceived discrepancy from an initial different point (Oliver 1980). Furthermore, customer satisfaction can be defined as an outcome of customer perception of value received in a transaction or relationship where value equal to perceive value (Eshetie, Seyoum et al. 2016). Most definitions of customer satisfaction indicate the confirmation and disconfirmation process (Edwin and Sheryl 2013). Satisfaction is caused by confirmation or positive disconfirmation of customer expectations and dissatisfaction is caused by negative disconfirmation of customer expectations (Pizam.A and Ellis 1999). In other words, Fulfilling customer expectations will produce a feeling of satisfaction and not meeting them will produce dissatisfaction among customers (Edwin and Sheryl 2013). Because of that, the ability to satisfy the customer is significant for many reasons. As an example, It has been found that dissatisfied customer may complain to the establishment and it may cause to spread negative word of mouth in extreme cases (Andaleeb and Conway 2006). When it is considered about customer satisfaction in hospitality, it can be understood that it is not a universal phenomenon and not everyone gets the same level of satisfaction out of hospitality experience. Because customers have different needs, objectives, and past experiences that influence their expectations (Pizam.A and Ellis 1999). Further Pizam argued that unlike material products or pure service, most hospitality experience is a combination of product and services. Therefore it can be described that satisfaction with a hospitality experience is a total of satisfaction with individual elements or attributes of all products and services. The hotel industry determines customer satisfaction via guest comment cards (Saleem and Raja 2014). .However, Studies have found that hotel lobby, quality of foods, employee’s knowledge, and service are the important factors that determine the satisfaction of hotel guests. Further, it is said staff in a hotel must provide a standardized, structured, and simplified service to the guest to satisfy guests fully(Lu, Berchoux et al. 2015). Tangibility Tangible service quality dimensions include physical facilities, the appearance of service personal, tools or equipment used to provide service, physical representations of service, and other customers in the service facility (Parasurman, Zeithaml et al. 1985). .In other words, the Tangibility dimension is about creating a firsthand impression (Gunarathne 2014). The tangible pieces of evidence in hospitality premises influence guests to believe about the hospitality offer. In addition to that, tangibles reinforce or challenge the guest's prior belief about hospitality offers (Bowie , Buttle et al. 2017). Reliability The reliability service dimension describes the consistency of performance and dependability. It means that firm performs the service right the first time and It also means that the firm honors and it involves accuracy billing, Keeping records correctly, performing the service at the designated time (Parasurman, Zeithaml et al. 1985). Reliability is important because every customer wants to know if their supplier is reliable and fulfill the set requirements with satisfaction (Gunarathne 2014). When companies deliver the promised service, they are considered as reliable. On the other hand, when they do not deliver promised service, they are considered unreliable (Bowie , Buttle et al. 2017). Responsiveness Responsiveness concerns the willingness or readiness of employees to provide service. It involves mailing transaction slips immediately, calling the customer back quickly, and giving prompt service(Parasurman, Zeithaml et al. 1985). This dimension is also very important. because every customer feels more valued if they get the possible quality in the service (Gunarathne 2014). .As an example if a customer gets into a problem regarding a food order request and request for help, the length of time he or she wait to fix it will represent the amount of employees responsiveness (Eshetie, Seyoum et al. 2016).
- 5. International Journal of Engineering and Management Research e-ISSN: 2250-0758 | p-ISSN: 2394-6962 Volume-10, Issue-6 (December 2020) www.ijemr.net https://doi.org/10.31033/ijemr.10.6.1 5 This Work is under Creative Commons Attribution-NonCommercial-NoDerivatives 4.0 International License. Assurance Assurance service quality is the Knowledge and courtesy of all employees and their ability to inspire trust and confidence in the guest (Barbara, Vincent et al. 1990). In this, assurance service quality refers to the company’s employees. This dimension describes whether the employees are skilled workers which can gain the trust and confidence of the customers. if the customers are not comfortable with the employees, there is a rather large chance that the customer will not return to do further business with the company (Gunarathne 2014). .Especially, this dimension of service quality is important to the cases in which the risk is high. Empathy Empathy service quality refers to how a company cares and gives individualized attention to its customers, to make the customer feeling extra valued and special(Majid, Zahra et al. 2016). Empathy is combining with reliability, responsiveness, assurance dimensions to a higher level, even though they really cannot be compared as individuals. If the customer feels they get individualized and quality attention there is a very big chance that they will return to the company and do business there again (Gunarathne 2014). IV. ANALYSIS OF DATA The reliability of a measure is an indication of the stability and consistency with which the instrument measures the concept and helps to assess the goodness of the measure. Cronbach’s alpha is a reliability coefficient that indicates how well the items in a set are positively correlated to one another. Cronbach’s alpha should be greater than a minimum value of 0.700 and it is considered those questions as accepted. According to the following table, it can be shown the results of reliability in this study. TABLE 1: Results of reliability analysis Variable Items Cronbach’s Alpha Tangibility 6 0.850 Reliability 6 0.896 Responsiveness 5 0.916 Assurance 4 0.835 Empathy 5 0.864 Satisfaction 6 0.954 All Variables 32 0.962 According to the above table, Cronbach’s Alpha for the tangibility was 0.850. Cronbach’s Alpha value for reliability was 0.896. In addition to that, Cronbach’s Alpha value for responsiveness was 0.916. Moreover, Cronbach’s Alpha value for assurance was 0.835 and for the empathy 0.864. Cronbach’s Alpha value for satisfaction was 0.954. Finally, Cronbach’s Alpha value for all variables was 0.962. According to that all independent variables and dependent variables can be accepted. Because both variables have positive values (more than 0.7). Descriptive Statistics Descriptive Statistics were used to describe the basic features of the data in the study and Provide a simple summary of the sample and the measures. In this researcher used to mean, Standard deviation, and skewness. The bellow table shows the descriptive statistics of the variables. TABLE 2: Descriptive Statistics Variable Mean Std. Deviation Tangibility 3.9489 0.67416 Reliability 4.2867 0.64278 Responsiveness 4.3133 0.64064 Assurance 4.3717 0.58558 Empathy 4.3600 0.59166 Satisfaction 3.8689 0.83804 According to the above, tangibility had 3.9489 mean values and 0.67416 standard deviations. Reliability had 4.2867 mean values and 0.64278 Standard deviations. Responsiveness had 4.3133 mean values and 0.64064 standard deviations. In addition to that assurance had 4.3717 mean values and 0.58558 Standard deviations. Empathy had 4.3600 mean values and 0.59166 standard deviations. Customer Satisfaction had 3.8689 mean values and 0.83804. Mean values all independent variables. It means that almost all respondents were closed to the level of agreement. However, assurance had the highest mean value among variables in the food and beverage service quality. It means that the assurance of food and beverage service quality has the highest level of agreement to customer satisfaction than other variables. On the other hand, the tangibility of food and beverage service had minimum mean value. Correlation Analysis Researcher used Pearson’s correlation analysis to identify strength of relationship between the independent variables and dependent variables (relationship between food and beverage service quality and the customer satisfaction) Following table number 4.18 shows Pearson’s correlation analysis results relating to this study.
- 6. International Journal of Engineering and Management Research e-ISSN: 2250-0758 | p-ISSN: 2394-6962 Volume-10, Issue-6 (December 2020) www.ijemr.net https://doi.org/10.31033/ijemr.10.6.1 6 This Work is under Creative Commons Attribution-NonCommercial-NoDerivatives 4.0 International License. According to the above table, the Correlation between customer satisfaction and the tangibility of food and beverage service is 0.579. It means that there was a moderate positive relationship between those two variables. In addition to that, the relationship between the two variables was statistically significant. Because P = 0.000 (P< 0.05). The correlation between customer satisfaction and the reliability of food and beverage service was 0.638. It means that there is a moderate positive relationship between two variables. Further, the relationship between the two variables was statistically significant.Because p = 0.000 (P< 0.05). The correlation between customer satisfaction and the responsiveness of the food and beverage service was 0.634. It means that there was a moderate positive relationship between the two variables. On the other hand, the relationship between both variables was statistically significant. Because P = 0.000 (P< 0.05) The correlation between customer satisfaction and assurance of food and beverage service was 0.581. It also means that there was a moderate positive relationship between the two variables. In addition to that, the relationship among variables was statistically significant. Because P = 0.000 (P< 0.05). The correlation between customer satisfaction and empathy of food and beverage service was 0.517. It means that there is a moderate positive relationship between two variables. Moreover, the relationship between the two variables was statistically significant. Because P = 0.000 (P< 0.05). Multiple Regression Analysis Multiple regression analysis was used to examine the impact of independent variables on the dependent variable of the study. In this research, tangibility, reliability, responsiveness, assurance, empathy was considered an independent variable. Customer satisfaction was considered as a dependent variable. Results of the multiple regression analysis of the study were presented below tables. TABLE 4: Results of ANOVA Model Sum of Squares df Mean Square F Sig. Regressio n 54.64 5 10.928 31.47 0.00b Residual 50.00 144 0.347 Total 104.64 149 According to table 4, R-value can be identified as 0.723a . It means that there is a positive correlation between the independent variable (food and beverage service quality) and the dependent variable (customer satisfaction) and it was 72.3%. R2 value can be identified as0.522. It means the model was strongly fitted to the data. 52.2% of customer satisfaction was explained by the independent variables (tangibility, reliability, responsiveness, assurance, and empathy). According to table 5, the F value was 31.471 and it shows that the overall model was significant. Because P = 0.000 (P< 0.05). According to table 6, the researcher explained the results of multiple regression analysis. When it is considered the unstandardized coefficient for the tangibility of food and beverage service, it was significantly influenced by customer satisfaction and had a positive significant impact on customer satisfaction. Because B =0.331and P = 0.000 (P< 0.05). When it is considered the unstandardized coefficient value for the reliability of food and beverage service, it was significantly influenced by customer satisfaction and had a positive impact significant on customer satisfaction. Because B = 0.288and P = 0.034 (P< 0.05). TABLE 3: Correlation Analyses Satisfaction Correlation Sig.(2tailed) N Tangibility 0.579** 0.000 150 Reliability 0.638** 0.000 150 Responsiveness 0.634** 0.000 150 Assurance 0.581** 0.000 150 Empathy 0.517** 0.000 150 TABLE 5: Model Summary Model R R Square Adjusted R Square Std. Error of the Estimate 1 0.723a 0.522 0.506 0.58928
- 7. International Journal of Engineering and Management Research e-ISSN: 2250-0758 | p-ISSN: 2394-6962 Volume-10, Issue-6 (December 2020) www.ijemr.net https://doi.org/10.31033/ijemr.10.6.1 7 This Work is under Creative Commons Attribution-NonCommercial-NoDerivatives 4.0 International License. In addition to that, when it is considered about the value of the unstandardized coefficients of responsiveness of food and beverage service, it was significantly influenced by customer satisfaction and had a positive significant impact on customer satisfaction. Because B = 0.286 and P = 0.031 (P< 0.05). Moreover, when it is considered the unstandardized coefficient value of assurance of food and beverage service, it was significantly influenced by customer satisfaction and had a positive significant impact on customer satisfaction. Because B = 0.285 and P = 0.034 (P< 0.05). Finally, when it is considered the unstandardized coefficient value of empathy of food and beverage service quality, it was not significantly influenced by customer satisfaction and had a negative insignificant impact on customer satisfaction. Because B = -0.075 and P = 0.570 (P< 0.05). Hypothesis Testing Impact Hypothesis Result Tangibility on Customer satisfaction H+ Accepted Reliability on Customer satisfaction H+ Accepted Responsiveness on Customer satisfaction H+ Accepted Assurance on Customer Satisfaction H+ Accepted Empathy on Customer Satisfaction H+ Rejected The summary of hypothesis testing is shown in the above table. The left column shows predicted hypothesizes. Middle and right column shows the hypnotizing effect of service quality on customer satisfaction and whether the hypnotized effects are supported by the findings or not. V. CONCLUSION The results of the study are lead to confirm the predictions made by the researcher regarding the impact of food and beverage service quality on the customer satisfaction of three and above star grade hotels in Dambulla area. The objective of this study was to identify the impact of food and beverage service quality and customer satisfaction. According to the research findings, there was a positive significant impact of food and beverage service quality (tangibility, reliability, responsiveness, assurance) on customer satisfaction in three and above star grade hotels in Dambulla area. In this study, four hypotheses were supported and one was rejected (empathy). The Findings of the study will help all hotels (not only classified hotels but also unclassified hotels) to take decisions, actions on their service to customers. Because the hotel industry is highly service- oriented. Therefore the researcher proposes the following recommendations. Each hotel must pay high attention to the tangible evidence on their service. Especially they have to maintain their staff appearance. In this, Hotels must inspect employee’s uniforms, shoes, hairs, beards, etc. Because when the employees directly deal with customers, the above-mentioned areas gives a sign of the level of service. In addition to the internal-external decorations in the hotel, the premise must be maintained well. Tent cards, menus, and other promotional materials must be matched with the hotel theme and decorations and must be present on the tables. The furniture and other types of equipment in the hotel area must be comfortable and modern. In addition to that cleanliness of each area must be maintained well. Because tangibility has the highest impact on customer satisfaction. Further, Hotels must perform the correct service on time as hotels promised to perform before arrival. In addition to that, the service Perform must be reasonable compared with the payment of the customer. When issuing bills to the customers it must be ensured that it is an error- free record. Moreover, when customers have problems with hotel service or another matter, the employee must demonstrate their interest to help them. In addition to that, employees must be knowledgeable and informative not only on the hotel but also other matters as well (when a guest asks about the best place to visit, time to a train). Always employees must be at the customer's whenever the customer needs help. In such a situation employees must give quick service to solve problems. Employees must greet the customer according to the time of the day and must address and deal politely. Always employees must instill confidence in the customer. In addition to that, customers must be given secure places and secure transactions. When determining operation hours, it must be thought whether operation hours are convenient to the customers. In addition to that, employees’ attitudes must be changed to take positive job involvement. When employees make a mistake, they must apologize quickly. Hotels have to maintain a proper human resource practice. These hotels must select the right candidate from a pool of applicants. Then the selected candidates must be given proper training to perform a high level of service. Further, employees must be rewarded financially or non financially, when they perform a quality service.
- 8. International Journal of Engineering and Management Research e-ISSN: 2250-0758 | p-ISSN: 2394-6962 Volume-10, Issue-6 (December 2020) www.ijemr.net https://doi.org/10.31033/ijemr.10.6.1 8 This Work is under Creative Commons Attribution-NonCommercial-NoDerivatives 4.0 International License. REFERENCES [1] Almsalam, S. (2014). The effects of customer expectation and perceived service quality on customer satisfaction. International Journal of Business and Management Invention, 3(8), 79-84. [2] Andaleeb, S. S. & C. Conway. (2006). Coutomer satisfaction in restuarant industry. Journal of Service Marketing, 20(3). [3] Barbara, R. & L. Vincent, et al. (1990). Defining and measuring the quality of customer service. Marketing Intelligence & Planning, 8(6), 11-17. [4] Bowie, D. & F. Buttle, et al. (2017). Hospitality marketing. great britain. Routledge Taylor and Francis Group. [5] Edwin, N. T. & K. Sheryl. (2013). From customer satisfaction to customer delight: Creating a new standard of service for the hotel. International Journal of Contemporary Hospitality Management, 25(5), 642-659. [6] Eshetie, S. K. & W. Seyoum, et al. (2016). Service quality and customer satisfaction in hospitality industry: The case of selected hotels in jimma town, Ethiopia. Global Journal of Management and Business Research: E Marketing, 16(5), 73-86. [7] Giritlioglu, I. & E. Jones, et al. (2014). Measuring food and beverage service quality in spa hotels: A case study in Balıkesir, Turkey. International Journal of Contemporary Hospitality Management, 26(2), 183-204. [8] González, M. E. A. & L. R. Comesaña, et al. (2007). Assessing tourist behavioral intentions through perceived service quality and customer satisfaction. Journal of Business Research, 153-160. [9] Gunarathne, W. H. D. P. (2014). Relationship between service quality and customer satisfaction in Sri Lankan hotel industry. International Journal of Scientific and Research Puublications, 4(11), 1-6. [10] Khattab, S. A. A. & J. S. Aldehayyat. (2011). Perceptions of service quality in Jordanian hotels. International Journal of Business and Management Invention, 6(7), 226-233. [11] Lu, C. & C. Berchoux, et al. (2015). Service quality and customer satisfaction: qualitative research implications for luxury hotels. International Journal of Culture, Tourism and Hospitality Research, 9(2), 168-182. [12] Majid, E. & M. Zahra, et al. (2016). Effect of dimensions of service quality on the brand equity in the fast food industry. Studies in Business and Economics, 11(3), 30-46. [13] Majid, E. & M. Zahra, et al. (2016). Effect of dimensions of service quality on the brand equity in the fast food industry. Studies in Business and Economics, 11(3), 30-46. [14] Marković, S. & S. Raspor, et al. (2011). What are the key dimensions of restaurant service quality? An empirical study in the city restaurant settings. Socio-Cultural, Environmental and Economics. [15] Murasiranwa, E. T. & K. Nield, et al. (2010). Hotel service quality and Business Performance in five hotels belonging to a UK hotel chain. Available at: https://scholarworks.umass.edu/cgi/viewcontent.cgi?article =1435&context=refereed. [16] Oliver, R. L. (1980). Cognitive model of the antecedents and consequences of satisfaction decisions. Journal of Marketing Research, 17(4), 460-469. [17] Osarenkhoe, A. & M. B. Komunda, et al. (2017). Service quality as a mediator of customer complaint behaviour and customer loyalty. International Review of Management and Marketing, 7(1), 197-208. [18] Parasurman, A. & V. A. Zeithaml, et al. (1985). A conceptual Model of service quality and its implications for furture researchs. Journal of Marketing, 49, 41-50. [19] Parasurman, A. & V. A. Zeithaml, et al. (1988). SERVQUAL: Multiple item scale for measuring consumer perception of service quality. Journal of Retailing, 64(1). [20] Pizam.A & T. Ellis. (1999). Customer satisfaction and its measurement in hospitality enterprises. International Journal of Contemporary Hospitality Management, 7(11), 326-339. [21] Saleem, H. & N. S. Raja. (2014). The impact of service quality on customer satisfaction, customer loyalty and brand image: Evidence from hotel industry of Pakistan. Middle-East Journal of Scientific Research, 19(5), 706-711. [22] Saleh, F. & C. Ryan. (1991). Analysing service qnality in the hospitality industry using the SERVQUAL model. The Service Industries Journal, 11(3), 324-345. [23] Sureshchandar, G. S. & C. Rajendran, et al. (2002). The relationship between service quality and customer satisfaction. Journal of Service Marketing, 16(4), 363-379.